
 ?Mathematical formulae have been encoded as MathML and are displayed in this HTML version using MathJax in order to improve their display. Uncheck the box to turn MathJax off. This feature requires Javascript. Click on a formula to zoom.
ABSTRACT
Introduction: Accurate identification of the dominant factors affecting coastal wetlands can provide a reference for vegetation rehabilitation. In this study, quantitative analysis was performed on the Yancheng coastal wetland using ANOVA and geostatistical methods. Outcomes/other: The results indicated that in the directions perpendicular and parallel to the coastline, the soil moisture and salinity in the study area exhibited relatively significant (p<0.05) spatial variability. Vegetation in the southern experimental zone was in a low-moisture, low-salinity ecological niche, whereas vegetation in the northern experimental zone was in a high-moisture, high-salinity ecological niche. Soil salinity exhibited higher spatial variability than soil moisture, and it was most correlated with unvegetated mudflats, followed by areas with Spartina alterniflora, Suaeda glauca, and Phragmites australis. Discussion: The fitting of the semivariogram showed that the nugget and sill of the ratio were relatively low (<25%) for soil moisture and salinity in the northern experimental zone and northern buffer zone, whereas these values were relatively high (>75%) for soil moisture and salinity in the southern experimental zone and southern buffer zone. Conclusion: Compared with the northern study area, the contribution of human disturbance to the spatial heterogeneity of soil moisture and salinity in the southern study area is higher.
Introduction
In coastal wetlands, the distributions of vegetation and soil attributes show zonal characteristics, and these variations are essential to maintaining ecosystem functions and biodiversity (Gathman and Burton Citation2011; Chin et al. Citation2015). In the past, the ability of coastal wetlands to maintain their position in the intertidal zone depended on the accumulation of both organic and inorganic material, and vegetation played an important role in these processes (Kirkman et al. Citation1996; Wang et al. Citation2017). In the current Anthropocene, human factors are often combined with natural factors, which together affect the coastline, soil and hydrological characteristics of coastal wetlands, thereby affecting the vegetation distribution patterns (Cong et al. Citation2019; Fan et al. Citation2019). As suggested by previous studies (Bertness, Ewanchuk, and Silliman Citation2002; Pennings., Mary-Bestor., and Bertness. Citation2005), the general mechanisms producing zonation patterns of vegetation in coastal salt marshes may be universal, but the importance of particular factors is likely to vary geographically (Farina et al. Citation2017). To mitigate the negative effects of human factors on coastal wetland biodiversity, it is important to accurately identify the contributions of human factors (Kirkman et al. Citation1996; Liu et al. Citation2014; Sudhakar-Reddy, Vazeed-Pasha, and Jha Citation2016). However, because coastal wetland vegetation is affected by many ecological factors (De Steven and Toner Citation2004) and natural and human factors exhibit significant spatial heterogeneity at different scales (Fan et al. Citation2019; Cong et al. Citation2019; Sudhakar-Reddy, Vazeed-Pasha, and Jha Citation2016), it is difficult to quantitatively identify the relative contributions of the various factors.
At the macroscale, human and natural factors jointly affect the hydrological characteristics of coastal wetlands and affect the soil processes and vegetation distribution characteristics by changing soil moisture and soil salinity (Dick and Gilliam Citation2007). Through field sampling and remote sensing methods, rising sea levels (Wang et al. Citation2017; Fuller and Wang Citation2014), decreasing groundwater levels (Liu et al. Citation2014) and decreasing riverine runoff (Whigham et al. Citation2012; Fuller and Wang Citation2014) were found to have caused changes in soil moisture/salinity and vegetation structure/type in the coastal wetlands of various regions. Coastal wetland vegetation exhibits a gradient distribution pattern that has long interested researchers (Bertness, Ewanchuk, and Silliman Citation2002). Human activities generate multiple anthropogenic gradients and natural gradients due to differences in intensity and their influence on natural ecosystems (Michelsen, McDevitt, and Coelho Citation2014; Chi et al. Citation2018). Soil moisture and soil salinity determine the spatial patterns of dominant grass patches and thus the distributions of soil organic carbon (SOC) and total nitrogen (TN). In the Yellow River Delta of China, the spatial variations in SOC and TN in a seawall-reclaimed wetland were found to exhibit two scales, with the small scale (40 m) being the distance between soil salinity patches, reflecting the influences of soil salinity on SOC and TN. However, in a natural wetland, both SOC and TN exhibited only one scale of variation (90 m), which reflected the influences of soil salinity (Zhou and Bi Citation2020). In addition, a previous study found that the gradient in moisture content in the soil and the gradient of net primary productivity in vegetation exhibited significant net influences (P < 0.05 or P < 0.01) in all seasons and could be considered the main driving factor and indicator, respectively, of vegetation patterns in the Yellow River Delta of China (Sun et al. Citation2020).
Coastal wetland vegetation exhibits a gradient distribution pattern, and the spatial heterogeneities in soil moisture and soil salinity are dominant factors that drive this pattern (Bantilan-Smith et al. Citation2009). The distance from a river or sea represents a combination of these effects and indicates the influence generated by environmental factors, and vegetation patterns always show regular distributions with increasing distance (Xue et al., Citation2018). At the microscale, the gradient effect analysis method is an important means to explain plant diversity and vegetation pattern variations in coastal wetlands (Watt and Scrosati Citation2013; Arias et al., Citation2018). In the coastal wetlands of the Hawaiian Islands, the mean values for the vegetative characteristics exhibited significant differences (ANOVA, P < 0.05) among the salinity classes and hydrologic zones of constructed wetlands, restored wetlands and natural wetlands (Bantilan-Smith et al. Citation2009). Due to the complexity of hydrodynamic conditions and surface features in estuaries and coastal zone, coastal wetlands in river deltas often have high plant diversity. In Chesapeake Bay, the results of a previous study (Sharpe and Baldwin Citation2013) suggested that for estuarine gradients possessing strong environmental drivers of community structure (i.e., salinity, soil nitrate-nitrogen, and inundation), the observed pattern of plant species richness was best described by environmental effects, with environmental factors including the mean porewater salinity and soil nitrate-nitrogen accounting for anywhere from 39 to 71% of the total variance. Besides, Bertness, Ewanchuk, and Silliman (Citation2002) examined the hypothesis that nitrogen supply is currently affecting plant species distributions across New England marsh landscapes by surveying 14 salt marshes in Narragansett Bay, Rhode Island.
The coastal wetlands of Jiangsu are located in eastern China. This area has two national nature reserves, which play an important role in global biodiversity conservation. Before the 1990s, this area, particularly the core zone of the two national nature reserves, was strictly protected (Wang et al. Citation2011), and natural factors played a dominant role in the evolution of the vegetation patterns. Due to a lack of stable sediment sources, the mudflats in the northern study area have been relatively severely eroded and damaged by tides, and erosion has started to advance toward the center of the core zone (Zang Citation2019). In addition, due to its location in the economically developed and densely populated Yangtze River Delta, the nature reserve has recently been subject to disturbance from industry (Wang et al. Citation2010), agriculture (Li et al. Citation2014), and aquaculture (Zuo et al. Citation2004; Zang et al. Citation2019) in both local and adjacent areas. Considering that natural and human factors affecting the vegetation patterns in the study area are becoming increasingly complex, to avoid limited conclusions obtained based on single sections and limited areas, further field surveys and laboratory analysis were conducted in this study based on the knowledge acquired (data of core zone) by previous researchers (Zhang et al. Citation2013a; Zang et al. Citation2017). The hypothesis of this paper is that in the natural state, the soil moisture and salinity of a muddy coastal wetland in a plain area exhibit gradient distribution characteristics, while the vegetation patterns exhibit zonal characteristics; however, the rising sea level has led to an increase in the frequency and intensity of tidal inundation, while human reclamation activities have led to a decrease in the frequency and intensity of tidal inundation. Natural and human factors change the inherent gradient characteristics of soil moisture and salinity, which may lead to the gradual disappearance of the integrity or zonality of vegetation patterns and the enhancement of randomness or intrazonality characteristics. The objective of this paper is as follows: Several sections were selected in the buffer zone and experimental zone to represent various protection levels, and an attempt was made to clarify the dominant factors controlling the vegetation patterns in the study area by analyzing the spatial heterogeneity in soil moisture and salinity. Our final objectives were to quantitatively reveal the relative contributions of human and natural factors to the spatial heterogeneity in soil moisture and salinity and the intrazonality in vegetation patterns in coastal wetlands.
Materials and methods
Study area and sampling sites
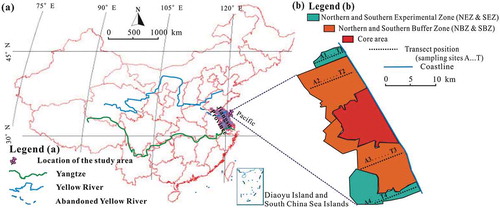
The study area of this paper is located in Yancheng city, Jiangsu Province, China ()). The study area consists of five basic functional zones ()) as follows: the central core zone (CZ), which features primarily wetland plants, such as Spartina alterniflora (S. alterniflora), Suaeda glauca (S. glauca), and Phragmites australis (P. australis); the southern buffer zone (SBZ) and northern buffer zone (NBZ), which flank the CZ and feature primarily small rivers and freshwater lakes; and the southern experimental zone (SEZ) and northern experimental zone (NEZ), which flank the buffer zone and feature primarily constructed wetlands, such as salt pans and rice fields.
Field samples were collected in June 2017. The process was as follows: a relatively continuous successional sequence of S. alterniflora, S. glauca, P. australis, and bare mudflats was first selected in the NEZ, NBZ, SBZ, and SEZ, and 4 transects (T1, T2, T3, and T4) were randomly established ()). According to the coenotype, 20 plots (from A to T) were established in each transect using a 1 m × 1 m sampling frame (from sea to land: bare mudflat without vegetation, S. alterniflora, S. glauca, and P. australis; there were 5 plots in each vegetation type, with a spacing of 10 m). The geographical coordinates and elevations of the sampling points were recorded using a global positioning system. The soils were dug up with a sampling shovel (depth of 30 cm), and the samples were sealed in sampling bags, labeled, and delivered to the laboratory for analysis.
Figure 1. Location (a) and functional zones (b) of the study area
Analysis methods
In order to make the sample data conform to the characteristics of normal distribution, triple mean square error were used to exclude outliers from the analysis. Based on the processed data, the spatial heterogeneity in soil moisture and salinity and its influence on vegetation patterns were analyzed using geostatistical analysis methods.
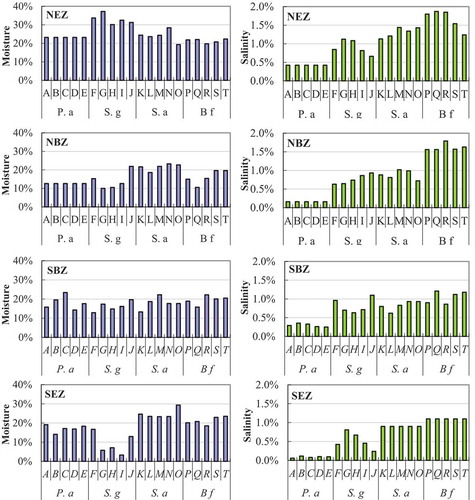
The soil moisture (weight percent %) was measured using the oven drying method (instrument: Suo’ao SA-TRX24; temperature: 35°C; drying time: 48 hours), and the soil salinity (weight percent %) was measured using the electrical conductivity method (instrument: APURE EC-860). The soil wet weight was measured first; the soil was then dried to a constant temperature, and the dry weight was measured. Finally, the soil was ground, passed through a 2 mm fine sieve, and made into a soil solution to measure salinity. In this paper, the soil moisture and soil salinity data for the study area were statistically analyzed using Microsoft Excel 2003. One-way analysis of variance (ANOVA) was performed using IBM SPSS 20.0 at the intra- and intergroup levels to determine the significance of the spatial variations in soil moisture (left side of ) and salinity (right side of ).
Canonical correlation analysis (CCA) is a sorting method based on a single-peak model that combines correspondence analysis and multivariate regression analysis in the sorting process (Ter Braak Citation1986; Li et al. Citation2017) and is thus capable of presenting the quadrats, the study object and the sorting results for the environmental factors on the same plot (Bu et al. Citation2016). In this paper, because the study object is a type variable, we added three virtual variables and converted the four vegetation types to quantitative variables. CCA plots for vegetation, soil moisture and salinity in different zones were obtained by using direct gradient analysis.
To further separate the contributions of human activity to changes in vegetation pattern based on previous studies (Walz and Stein Citation2014; Xu, Xu, and Tang Citation2016), we constructed a qualitatively and quantitatively integrated Human Disturbance Index (HDI) model:
where HDI is the human disturbance index (nondimensional index); Ait is the area of landscape type i as a percentage of the total area of n landscape types in the study area at time t; Si is the intensity of interference from human activity on landscape type i; and Scle is the construction land equivalent, used to compare effects on coastal wetlands by different human activities, and is reflected by the land use/cover types (The satellite remote sensing images are taken from the open website of http://www.gscloud.cn). Scores were assigned by experts according to the Delphi method (Walz and Stein Citation2014; Xu, Xu, and Tang Citation2016; Zang et al. Citation2019), as shown in .
Table 1. Criteria for evaluating the interference intensity of human activities in different cover type
The nugget-to-sill ratio (NSR) of the semivariogram can be used to characterize the proportion of the variation in the spatial autocorrelation of a variable (Balaguer-Beser et al. Citation2013; Cambardella et al. Citation1994; Piotrowska-Długosz et al. Citation2017). Therefore, a semivariogram is introduced to describe the spatial variations in soil moisture and salinity in the study area and, on that basis, reveal the dominant factors affecting soil processes and vegetation patterns in coastal wetlands. In this paper, the study area was divided into 1 km × 1 km patches using the ArcGIS 10.0 platform, and a semivariogram was calculated based on the soil moisture and salinity at the centroid of each grid cell. After verifying that the model met the fitting accuracy and passed the spherical model validation test, spatial distribution maps of soil moisture and salinity in the study area were generated using the ordinary kriging interpolation method. Based on the model parameters (including nugget and sill), the relative contributions of artificial cofferdams and seawater erosion to the spatial variations in soil moisture and salinity were determined.
Results
The spatial distribution characteristics of soil moisture and soil salinity
As shown in , the soil moisture and salinity displayed large variability in this study. The lowest and highest values of soil moisture were 3.31% (in the SEZ) and 37.24% (in the NEZ), respectively, both of which were found in the S. glauca communities. The lowest and highest values of soil salinity were 0.06% (in the P. australis communities in the SEZ) and 1.87% (in the bare flat in the NEZ), respectively.
In the direction perpendicular to the coastline, the spatial variations in soil moisture and salinity (outliers excluded) between different plant communities (P. australis, S. glauca, S. alterniflora, and unvegetated mudflats) within the same functional zone were statistically analyzed. The coefficient of variation (CV) showed moderate variations in soil moisture among P. australis, S. glauca, S. alterniflora, and unvegetated mudflat communities within the same functional zone (the CV values ranged from 16.16% to 36.24%). The one-way ANOVA results showed significant (n = 20, p < 0.05) spatial differences in soil moisture among these four types of plant communities within the same functional zone. The CV values also showed moderate variations in soil salinity between different plant communities within the same functional zone (the CV ranged from 46.66% to 63.26%). Additionally, there were significant (n = 20, p < 0.05) spatial differences in soil salinity among these four types of plant communities within the same functional area. Overall, soil salinity displayed a higher spatial variability than soil moisture.
Figure 2. Spatial distribution characteristics of soil moisture and salinity for different sampling sites (from A to T) in the different functional zones (southern experimental zone, SEZ; northern experimental zone, NEZ; southern buffer zone, SBZ; and northern buffer zone, NBZ) in the different plant communities (Phragmites australis, P. australis; Suaeda glauca, S. glauca; Spartina alterniflora, S. alterniflora; and bare mudflat, Bf)
The spatial variations in soil moisture and salinity in the same type of vegetation community among the different functional zones (NEZ, NBZ, SBZ, and SEZ) were also statistically analyzed. There were moderate variations in soil moisture in the same type of vegetation community among the NEZ, NBZ, SBZ, and SEZ (with CV values ranging from 15.89% to 53.51%). The one-way ANOVA results showed significant (n = 20, p < 0.05) spatial differences in soil moisture in the same type of vegetation community among the different functional zones. Similarly, the CV values showed moderate variations in soil salinity in the same type of vegetation community among the different functional zones (CV ranged from 22.83% to 54.95%). There were also significant (n = 20, p < 0.05) spatial differences in soil salinity in the same type of vegetation community among the different functional zones. The statistical parameters of soil moisture and salinity in the directions perpendicular and parallel to the coastline were compared. The extents of the variation and spatial differences in soil moisture and salinity in the two directions were found to be nearly the same.
The correlations of soil moisture and soil salinity with the vegetation pattern
shows the correlation between vegetation and the two environmental factors in the different functional zones in the study area obtained using the CanoDraw module in Canoco 4.5. The distances between the vertical projection points of each vegetation type and the arrows reflect the correlation of the vegetation type with soil moisture and salinity (the closer a vertical projection point is to an arrow, the higher the correlation).
In the NEZ ()), soil moisture is most correlated with S. glauca, the correlation between soil moisture and P. australis is relatively close to that between soil moisture and S. alterniflora, and soil moisture is least correlated with unvegetated mudflats. In the NEZ ()), soil salinity is most correlated with unvegetated mudflats, followed by S. alterniflora, S. glauca, and P. australis, which is in complete agreement with the vegetation pattern in the CZ in the continent–ocean direction. In the NBZ ()), soil moisture is most correlated with S. alterniflora, followed by unvegetated mudflats, P. australis, and S. glauca; the correlation of soil salinity in the NBZ is consistent with that in the NEZ. In the SBZ ()), soil moisture is most correlated with S. alterniflora, followed by unvegetated mudflats, S. glauca and P. australis, which is close to the correlation in the NBZ; the correlation of soil salinity in this zone is consistent with that in the NEZ and NBZ. In the SEZ ()), soil moisture is most correlated with unvegetated mudflats, followed by S. alterniflora, P. australis and S. glauca, which is opposite the correlation in the NEZ; the correlation of soil salinity in this zone is still consistent with that in the other three zones (NEZ, NBZ, and SBZ).
Figure 3. Canonical correspondence analysis ordination diagram for different plant communities (Phragmites australis, P. a; Suaeda glauca, S. g; Spartina alterniflora, S. a; and bare mudflat, Bf) and soil moisture and salinity in typical sections in the different functional zones (a: northern experimental zone, NEZ; b: northern buffer zone, NBZ; c: southern experimental zone, SEZ; d: southern buffer zone, SBZ)
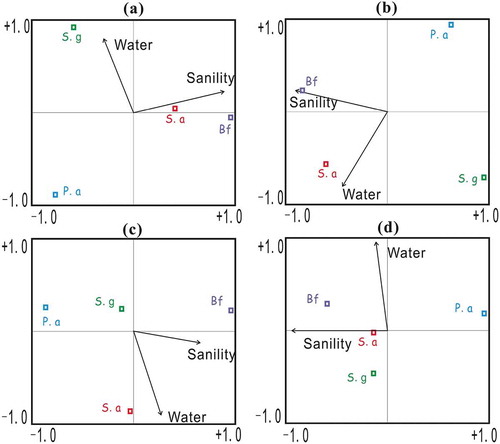
In each CCA plot, each quadrant represents different combined characteristics of soil moisture and salinity. On this basis, ecological niches can be classified into four types, namely, high moisture and high salinity (H-H), high moisture and low salinity (H-L), low moisture and high salinity (L-H) and low moisture and low salinity (L-L). In , there is a relatively large difference in the descending order of the correlation of soil moisture with the four vegetation types between the different zones, whereas the descending order of the correlation of soil salinity with the four vegetation types is consistent among the different zones. This result indicates that the ecological niche of the same vegetation type may vary significantly among different zones. As demonstrated in the CCA plots of various vegetation types, except for the NBZ ()), vegetation types are not in the first, second, third or fourth quadrants of all the zones according to the order, and there is no longer consistency and predictability in the distribution characteristics of vegetation in the noncore zone in the direction parallel to the coastline. The alteration of the gradient order of ecological niches is consistent with the field survey results.
The dominant factors of spatial heterogeneity of soil moisture and soil salinity
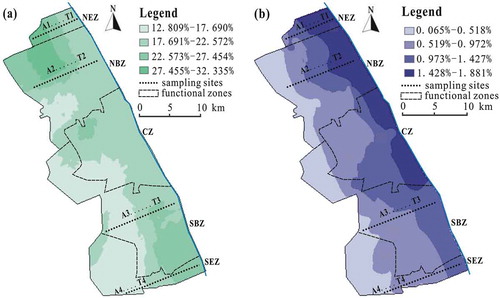
) shows soil moisture gradient: In the direction perpendicular to the coastline, soil moisture falls in the range of 12.809–32.335%, but its increase is discontinuous. In the direction parallel to the coastline, the overall soil moisture is higher in the northern study area (NEZ and NBZ) than in the southern study area (SEZ and SBZ), resulting in a different order of the correlation between vegetation and soil moisture in different zones (). In , the spatial variability in soil salinity is higher than that in soil moisture, as can be easily visually discerned in ). In the direction perpendicular to the coastline, the soil salinity in the study area falls in the range of 0.065–1.881% and displays ascending gradient characteristics. In the direction parallel to the coastline, the spatial distribution of soil salinity is continuous. As a result, the correlation between vegetation and soil salinity is consistent in different zones ().
Figure 4. The spatial heterogeneity of soil moisture (a) and salinity (b) in the study area
As demonstrated in , the HDI for the NEZ and NBZ are both lower 0.600, the nugget and sill of the ratio for the NEZ and NBZ are both lower than 25%. They suggesting that compared with that of seawater erosion, the spatial variation caused by nonregional human factors (random variables), a manifestation of human activity, accounts for a relatively small proportion of the total spatial variation in the system, and thus, soil moisture and salinity each exhibit high spatial correlation. The opposite of HDI for the NEZ and NBZ are higher than 0.600, the nugget and sill of the ratio for the SEZ and SBZ area are both higher than 75%. They suggesting that compared with that of seawater erosion, the spatial variation caused by human factors accounts for a relatively large proportion of total variation in the system and that human activity has a significant impact on the spatial distributions of soil moisture and salinity in this part of the study area.
Table 2. Spatial variation functions and relevant parameters of soil moisture and salinity under different human disturbance index (HDI) backgrounds in the subarea
Discussion
The spatial heterogeneity of soil moisture and soil salinity
Soil processes often exhibit spatial heterogeneity that may influence the plant community structure and vegetation patterns (Dick and Gilliam Citation2007). To fully reveal the impacts of human and natural factors on the integrity of coastal wetlands, the extent of this study area was further increased to the buffer zone and experimental zone on the two sides of the CZ. The results obtained in this study show that the average soil moisture and salinity in various types of vegetation communities are both slightly lower than those obtained in a previous study (Zhang et al. Citation2013b), which is mainly a result of the overall lower soil moisture and salinity in the SEZ than in the other functional zones, as demonstrated in .
The interactions between surface water and groundwater in complex hydrological networks maintain a dynamic balance between water regimes and salinity in coastal wetlands (Liu and Mou Citation2016). While geographically isolated wetlands are spatially isolated, field-based studies have observed a continuum of hydrologic connections between these systems and other surface waters (Golden et al. Citation2014; Evenson et al. Citation2015). However, our results suggested that human reclamation activities lead to coastal wetland degradation and promote the spatial heterogeneity of soil moisture and salinity. Different sampling seasons (in this study, samples were collected July) and measurement error (in this study, soil moisture and soil salinity were not obtained in the field using portable measuring instruments but instead were obtained by testing the samples in the laboratory) may also result in differences; thus, the temporality of these two soil parameters should be discussed in a subsequent study.
The randomness and intrazonality of vegetation distribution
The results of another study in the CZ of the Yancheng Coastal Wetland (Zhang et al. Citation2013a) demonstrated that soil moisture and salinity in the study area exhibited spatial variability in the direction perpendicular to the coastline. This paper found that the spatial variations in soil moisture and soil salinity in the buffer and experimental zone were statistically significant in the direction parallel to the coastline. This paper also identified a consistent correlation between vegetation and soil salinity in different zones of the study area, suggesting that the controlling effect of soil salinity is higher than that of soil moisture. The importance of salinity is consistent with the situation in the coastal wetlands in Hawaii and Chesapeake Bay (Bantilan-Smith et al. Citation2009; Sharpe and Baldwin Citation2013) and different from the situation of coastal wetlands in the Yellow River Delta (Sun et al. Citation2020).
These results indicate that the combined effects of soil moisture and soil salinity have a sufficient impact on the disturbance of coastal wetland patterns by hydrological pulses; therefore, the original vegetation pattern may develop a random and intrazonal pattern (Zang et al. Citation2019). The results of this paper show that: compared with the northern study area, the contribution of human disturbance to the spatial heterogeneity of soil moisture and salinity in the southern study area is higher; the integrity of coastal wetlands has increasingly been threatened by human activities, such as farmland cultivation and aquaculture, as the intensity of human activity increases, the vegetation pattern and landscape pattern of coastal wetlands tends to be fragmented, and the intrazonality characteristics of vegetation have become increasingly prominent.
The contrasting relationships between human factors and natural factors
Coastal wetlands have adapted to a dynamic range of natural disturbances over recent millennia but face growing pressures from human population growth and coastal development (White and Kaplan Citation2017). In the USA, previous results (Fuller and Wang Citation2014) suggested that increased saline intrusion associated with sea level rise and reduced freshwater flow continue to reduce the diversity of freshwater vegetation and oligohaline marsh communities in the southeastern Everglades. In China, Zhang et al. (Citation2013a) investigated the dominant factors affecting the spatial variations in soil moisture and salinity in the nature reserves in the Yancheng coastal wetlands using variation functions and found spatial autocorrelations in soil moisture and salinity in the CZ. They noted that the spatial distribution characteristics of soil moisture and salinity were entirely caused by natural conditions.
In developing countries of Asia, interactions between human and natural factors are becoming increasingly intense, and the impacts of human activities on muddy coasts are far greater than those of natural factors (Sudhakar-Reddy, Vazeed-Pasha, and Jha Citation2016; Cong et al. Citation2019; Fan et al. Citation2019). Based on the field surveys conducted in this study, we conclude that there are different relations between natural (regional) factors and human (nonregional) factors that play a dominant role in the variations in soil moisture and salinity in the northern and southern study areas. The northern study area consists of eroded tidal flats. The elevation of the tidal flat surface is low, and tidal waters intrude into this part of the study area at a high frequency. Consequently, in the northern study area, the intensity of human activity is relatively low, and seawater erosion has a larger impact than artificial cofferdams. The CZ of the study area contains a rich variety of vegetation types and consequently has become home to migratory birds. In recent years, the carrying capacity of the habitats in the CZ has been enhanced through beneficial human interference. In particular, as a result of the construction of manmade tide diversion ditches and lakes for waterfowl, the natural and human impacts in the CZ are nearly balanced. The southern study area consists of depositional tidal flats, and the elevation of the tidal flat surface is relatively high. In addition, due to reclamation activity, the rise in tide level has been limited. Therefore, soil moisture and salinity are, overall, lower in the southern study area than in the CZ and northern study area. In the southern study area, artificial cofferdams have a larger negative impact than seawater erosion.
Conclusions
Against a background of rising sea levels and intensifying human activity, coastal wetlands play a positive role in mitigating the negative impacts of continent–ocean interactions, and further research is required to fully reveal the impact of the interactions among natural and human factors on maintaining coastal wetland integrity. The protection and rehabilitation of plant and landscape diversity in coastal wetlands can help maintain the integrity of regional ecosystems and is of great importance to global biodiversity protection. This paper presents a case study of Jiangsu, China. Based on field surveys and laboratory analysis, this study investigates the relationships between vegetation patterns and soil moisture and salinity in coastal wetlands with various protection levels, analyzes the dominant factors affecting the evolution of vegetation patterns in coastal wetlands, and updates and enriches the existing knowledge to provide a reference for vegetation rehabilitation in similar areas. The main conclusions derived from this study are summarized as follows:
The soil moisture and salinity in the coastal wetlands of Yancheng display spatial variability, and the combined characteristics of soil moisture and salinity vary between different functional zones. This variation disrupts the typical gradient distribution pattern of vegetation in the sea–land direction, resulting in the loss of consistency and predictability of vegetation in the directions parallel and perpendicular to the coastline.
There are intense continent–ocean interactions in the coastal wetlands of Yancheng, and natural impacts and human interference are relatively balanced in the core zone of the coastal wetlands in the nature reserve. Comparatively, seawater erosion has a larger negative impact than artificial cofferdams in the zone north of the core zone, whereas artificial cofferdams have a larger negative influence in the zone south of the core zone.
Acknowledgments
Our sincere appreciation goes to Chenglong Wang, Teng Wang Yifei Zhao and Yongqiang Zhao, whose cooperation and participation in fieldwork were greatly appreciated.
Disclosure statement
The authors report no potential conflicts of interest.
Additional information
Funding
References
- Arias, M. E., F. Wittmann, P. Parolin, M. Murray-Hudson, and T. A. Cochrane. 2018. “Interactions between Flooding and Upland Disturbance Drives Species Diversity in Large River Floodplains.” Hydrobiologia 814 (1): 5–10. doi:10.1007/s10750-016-2664-3.
- Balaguer-Beser, A., L. A. Ruiz, T. Hermosilla, and J. A. Recio. 2013. “Using Semivariogram Indices to Analyse Heterogeneity in Spatial Patterns in Remotely Sensed Images.” Computers & Geosciences 50: 115–127. doi:10.1016/j.cageo.2012.08.001.
- Bantilan-Smith, M., G. L. Bruland, R. A. MacKenzie, A. R. Henry, and C. R. Ryder. 2009. “A Comparison of the Vegetation and Soils of Natural, Restored, and Created Coastal Lowland Wetlands in Hawaii.” Wetlands 29 (3): 1023–1035. doi:10.1672/08-127.1.
- Bertness, M. D., P. Ewanchuk, and B. R. Silliman. 2002. “Anthropogenic Modification of New England Salt Marsh Landscapes.” Proceedings of the National Academy of Science 99 (3): 1395–1398. doi:10.1073/pnas.022447299.
- Bu, C. F., P. Zhang, C. Wang, Y. S. Yang, H. B. Shao, and S. F. Wu. 2016. “Spatial Distribution of Biological Soil Crusts on the Slope of the Chinese Loess Plateau Based on Canonical Correspondence Analysis.” Catena 137: 373–381. doi:10.1016/j.catena.2015.10.016.
- Cambardella, C. A., T. B. Moorman, J. M. Novak, T. B. Parkin, D. L. Karlen, R. F. Turco, and A. E. Kanopka. 1994. “Field-scale Variability of Soil Properties in Central Lowa Soils.” Soil Science Society of America Journal 58 (5): 1501–1511. doi:10.2136/sssaj1994.03615995005800050033x.
- Chi, Y., H. H. Shi, W. Zheng, J. K. Sun, and Z. Y. Fu. 2018. “Spatiotemporal Characteristics and Ecological Effects of the Human Interference Index of the Yellow River Delta in the Last 30 Years.” Ecological Indicators 89: 880–892. doi:10.1016/j.ecolind.2017.12.025.
- Chin, A. T. M., D. C. Tozer, N. G. Walton, and G. S. Fraser. 2015. “Comparing Disturbance Gradients and Bird-based Indices of Biotic Integrity for Ranking the Ecological Integrity of Great Lakes Coastal Wetlands.” Ecological Indicators 57: 475–485. doi:10.1016/j.ecolind.2015.05.010.
- Cong, S., X. Wu, Y. Zhang, B. Y. Xue, and H. J. Wang. 2019. “Evolution of the Northern Fujian Coast under the Impact of Natural and Anthropogenic Forces, 1976–2017: An Analysis of Coastal Monitoring and Satellite Images.” Anthropocene Coasts 2: 72–86. doi:10.1139/anc-2018-0016.
- De Steven, D., and M. M. Toner. 2004. “Vegetation of Upper Coastal Plain Depression Wetlands: Environmental Templates and Wetland Dynamics within a Landscape Framework.” Wetlands 24 (1): 23–42. doi:10.1672/0277-5212(2004)024[0023:VOUCPD]2.0.CO;2.
- Dick, D. A., and F. S. Gilliam. 2007. “Spatial Heterogeneity and Dependence of Soils and Herbaceous Plant Communities in Adjacent Seasonal Wetland and Pasture Sites.” Wetlands 27 (4): 951–963. doi:10.1672/0277-5212(2007)27[951:SHADOS]2.0.CO;2.
- Evenson, G. R., H. E. Golden, C. R. Lane, and E. D’Amico. 2015. “Geographically Isolated Wetlands and Watershed Hydrology: A Modified Model Analysis.” Journal of Hydrology 529: 240–256. doi:10.1016/j.jhydrol.2015.07.039.
- Fan, D. D., D. V. Nguyen, J. F. Su, V. V. Bui, and D. L. Tran. 2019. “Coastal Morphological Changes in the Red River Delta under Increasing Natural and Anthropic Stresses.” Anthropocene Coasts 2: 51–71. doi:10.1139/anc-2018-0022.
- Farina, J. M., Q. He, B. R. Silliman, and M. D. Bertness. 2017. “Biogeography of Salt Marsh Plant Zonation on the Pacific Coast of South America.” Journal of Biogeography 45: 1–10.
- Fuller, D. O., and Y. Wang. 2014. “Recent Trends in Satellite Vegetation Index Observations Indicate Decreasing Vegetation Biomass in the Southeastern Saline Everglades Wetlands.” Wetlands 34: 67–77. doi:10.1007/s13157-013-0483-0.
- Gathman, J. P., and T. M. Burton. 2011. “A Great Lakes Coastal Wetland Invertebrate Community Gradient: Relative Influence of Flooding Regime and Vegetation Zonation.” Wetlands 31: 329–341. doi:10.1007/s13157-010-0140-9.
- Golden, H. E., C. R. Lane, D. M. Amatya, K. W. Bandilla, H. R. Kiperwas, C. D. Knightes, and H. Ssegane. 2014. “Hydrologic Connectivity between Geographically Isolated Wetlands and Surface Water Systems: A Review of Select Modeling Methods.” Environmental Modelling & Software 53: 190–206. doi:10.1016/j.envsoft.2013.12.004.
- Kirkman, L. K., R. F. Lide, G. Wein, and R. R. Sharitz. 1996. “Vegetation Changes and Land-use Legacies of Depression Wetlands of the Western Coastal Plain of South Carolina: 1951–1992.” Wetlands 16 (4): 564–576. doi:10.1007/BF03161347.
- Li, C. C., Y. B. Cheng, Q. Tang, S. B. Lin, Y. H. Li, X. J. Hu, J. Nian, et al. 2014. “The Association between Prenatal Exposure to Organochlorine Pesticides and Thyroid Hormone Levels in Newborns in Yancheng, China.” Environmental Research 129: 47–51. doi:10.1016/j.envres.2013.12.009.
- Li, W., L. J. Cui, B. D. Sun, X. S. Zhao, C. J. Gao, Y. Zhang, M. Y. Zhang, X. Pan, Y. R. Lei, and W. Ma. 2017. “Distribution Patterns of Plant Communities and Their Associations with Environmental Soil Factors on the Eastern Shore of Lake Taihu, China.” Ecosystem Health and Sustainability 3 (9): 1385004. doi:10.1080/20964129.2017.1385004.
- Liu, G. L., L. C. Zhang, Q. Zhang, Z. Musyimi, and Q. H. Jiang. 2014. “Simulation of Urban Expansion and Encroachment Using Cellular Automata and Multi-agent System Model: A Case Study of Tianjin Metropolitan Region, China.” Wetlands 34: 787–801. doi:10.1007/s13157-014-0542-1.
- Liu, Q., and X. Mou. 2016. “Interactions between Surface Water and Ground Water: Key Processes in Ecological Restoration of Degraded Coastal Wetlands Caused by Reclamation.” Wetlands 36: 95–102. doi:10.1007/s13157-014-0582-6.
- Michelsen, O., J. E. McDevitt, and C. R. V. Coelho. 2014. “A Comparison of Three Methods to Assess Land Use Impacts on Biodiversity in A Case Study of Forestry Plantations in New Zealand.” The International Journal of Life Cycle Assessment 19 (6): 1214–1225. doi:10.1007/s11367-014-0742-1.
- Pennings., S. C., G. M. Mary-Bestor., and M. D. Bertness. 2005. “Plant Zonation in Low-latitude Salt Marshes: Disentangling the Roles of Flooding, Salinity and Competition.” Journal of Ecology 93: 159–167.
- Piotrowska-Długosz, A., A. Siwik-Ziomek, J. Długosz, and D. Gozdowski. 2017. “Spatio-temporal Variability of Soil Sulfur Content and Arylsulfatase Activity at a Conventionally Managed Arable Field.” Geoderma 295: 107–118. doi:10.1016/j.geoderma.2017.02.009.
- Sharpe, P. J., and A. H. Baldwin. 2013. “Wetland Plant Species Richness across Estuarine Gradients: The Role of Environmental Factors and the Mid-domain Effect.” Aquatic Botany 107: 23–32. doi:10.1016/j.aquabot.2013.01.005.
- Sudhakar-Reddy, S., S. Vazeed-Pasha, and C. S. Jha. 2016. “Spatio-temporal Changes Associated with Natural and Anthropogenic Factors in Wetlands of Great Rann of Kachchh, India.” Journal of Coast Conserve 20: 145–155. doi:10.1007/s11852-016-0425-0.
- Sun, J. K., Y. Chi, Z. Y. Fu, T. Li, and K. K. Dong. 2020. “Spatiotemporal Variation of Plant Diversity under a Unique Estuarine Wetland Gradient System in the Yellow River Delta, China.” Chinese Geographical Science 30 (2): 217–232. doi:10.1007/s11769-020-1109-0.
- Ter Braak, C. J. F. 1986. “Canonical Correspondence Analysis: A New Eigenvector Technique for Multivariate Direct Gradient Analysis.” Ecology 67 (5): 1167–1179. doi:10.2307/1938672.
- Walz, U., and C. Stein. 2014. “Indicators of Hemeroby for the Monitoring of Landscapes in Germany.” Journal for Nature Conservation 22: 279–289. doi:10.1016/j.jnc.2014.01.007.
- Wang, G. D., M. Wang, M. Jiang, X. G. Liu, X. Y. He, and H. T. Wu. 2017. “Effects of Vegetation Type on Surface Elevation Change in Liaohe River Delta Wetlands Facing Accelerated Sea Level Rise.” Chinese Geographical Science 27 (5): 810–817. doi:10.1007/s11769-017-0909-3.
- Wang, J. N., A. Li, Q. J. Wang, Y. Zhou, L. C. Fu, and Y. Li. 2010. “Assessment of the Manganese Content of the Drinking Water Source in Yancheng, China.” Journal of Hazardous Materials 182: 259–265. doi:10.1016/j.jhazmat.2010.06.023.
- Wang, Z., Z. Q. Li, G. Beauchamp, and Z. G. Jiang. 2011. “Flock Size and Human Disturbance Affect Vigilance of Endangered Red-crowned Cranes.” Biological Conservation 144: 101–105. doi:10.1016/j.biocon.2010.06.025.
- Watt, C. A., and R. A. Scrosati. 2013. “Bioengineer Effects on Understory Species Richness, Diversity, and Composition Change along an Environmental Stress Gradient: Experimental and Mensurative Evidence.” Estuarine, Coastal and Shelf Science 123: 10–18. doi:10.1016/j.ecss.2013.02.006.
- Whigham, D. F., C. M. Walker, R. S. King, and S. J. Baird. 2012. “Erratum To: Multiple Scales of Influence on Wetland Vegetation Associated with Headwater Streams in Alaska, USA.” Wetlands 32: 423. doi:10.1007/s13157-012-0309-5.
- White, E., and D. Kaplan. 2017. “Restore or Retreat? Saltwater Intrusion and Water Management in Coastal Wetlands.” Ecosystem Health and Sustainability 3: e01258. doi:10.1002/ehs2.1258.
- Xu, Y., X. R. Xu, and Q. Tang. 2016. “Human Activity Intensity of Land Surface: Concept, Method and Application in China.” Journal of Geographical Sciences 26 (9): 1349–1361. doi:10.1007/s11442-016-1331-y.
- Xue, L., X. Z. Li, Z. Z. Yan, Q. Zhang, W. H. Ding, X. Huang, B. Tian, Z. M. Ge, and Q. X. Yin. 2018. “Native and Non-native Halophytes Resiliency against Sea-level Rise and Saltwater Intrusion.” Hydrobiologia 806 (1): 47–65. doi:10.1007/s10750-017-3333-x.
- Zang, Z. 2019. “Analysis of Intrinsic Value and Estimating Losses of Blue Carbon in Coastal Wetlands: A Case Study of Yancheng, China.” Ecosystem Health and Sustainability 5 (1): 216–225. doi:10.1080/20964129.2019.1673214.
- Zang, Z., X. Zou, P. Zuo, Q. Song, C. Wang, and J. Wang. 2017. “Impact of Landscape Patterns on Ecological Vulnerability and Ecosystem Service Values: An Empirical Analysis of Yancheng Nature Reserve in China.” Ecological Indicators 72: 142–152. doi:10.1016/j.ecolind.2016.08.019.
- Zang, Z., X. Q. Zou, Q. C. Song, and Y. L. Yao. 2019. “Analysis of the Spatiotemporal Correlation between Vegetation Pattern and Human Activity Intensity in Yancheng Coastal Wetland, China.” Anthropocene Coasts 2: 87–100. doi:10.1139/anc-2018-0007.
- Zhang, H. B., H. Y. Liu, Y. F. Li, J. An, X. Y. Xue, and M. H. Hou. 2013a. “Spatial Variation of Soil Moisture/Salinity and the Relationship with Vegetation under Natural Conditions in Yancheng Coastal Wetland.” Environmental Science 34 (2): 540–546. In Chinese.
- Zhang, H. B., H. Y. Liu, Y. F. Li, Q. M. Tan, and M. H. Hou. 2013b. “The Studying of Key Ecological Factors and Threshold of Landscape Evolution in Yancheng Coastal Wetland.” Acta Ecologica Sinica 33 (21): 6975–6983. doi:10.5846/stxb201301150096.
- Zhou, S. W., and X. L. Bi. 2020. “Seawall Effects in a Coastal Wetland Landscape: Spatial Changes in Soil Carbon and Nitrogen Pools.” Journal of Coastal Conservation 24: 11. doi:10.1007/s11852-019-00718-7.
- Zuo, P., S. W. Wan, P. Qin, J. J. Du, and H. Wang. 2004. “A Comparison of the Sustainability of Original and Constructed Wetlands in Yancheng Biosphere Reserve, China: Implications from Emergy Evaluation.” Environmental Science & Policy 7: 329–343. doi:10.1016/j.envsci.2004.05.001.