
 ?Mathematical formulae have been encoded as MathML and are displayed in this HTML version using MathJax in order to improve their display. Uncheck the box to turn MathJax off. This feature requires Javascript. Click on a formula to zoom.
ABSTRACT
Somatosensory comfort is mainly determined by the Temperature and Humidity Index (THI) with Wind Efficiency Index (WEI), but this conventional usage of these indicators does not capture the age-related differentials. Here we resolved this gap with a modification of the climatic comfort definition and method in a national standard, denoted as the Relative Climate Sensitive Index (RCSI), which incorporated the age-related vulnerability scores determined through online questionnaires with a scoring method, for each of the age-related and adaptive climatic comfort responses to changes in residence with Beijing-Tianjin-Hebei (BTH) region as an example. First, the result showed that the human comfort of living environment decreased with age in the BTH region, implicating age obviously impacted comfort, and weak adaptability made the elderly the relatively most high-risk group – their suitable region was less than a quarter of the whole study region. Second the adverse effects of persistent hot weather on comfort, indicating global warming as the leading driver of dwindling comfort over recent years. As the warming was more significant in the southeastern part, all these forces combined had there a hotspot, appealing for extra attention. Last this improved evaluation accorded with actual situation to captured high-risk groups with their distributions.
Introduction
The anthropogenic global warming has posed a significant threat to ecosystem resilience, which could be permanently harmful to the global ecosphere (Goldsmith Citation1994). And natural supporting services to humanity’s processes have been declining during the last 50 years, leading to global climate change mitigation and adaption also been declining (Bongaarts Citation2019). This downward trend also appears in nonmaterial contributions, including learning and inspiration, physical and psychological experiences, and supporting identities and sense of place (Watts et al. Citation2015; Díaz et al. Citation2019). Along with this change, individuals’ comfort of the environment may influence their quality of life through the emotion and physical state. Even when the negative effects are deep, many diseases become more virulent to human and the thermal stress may directly result in death (Rupa Basu Citation2002; Cheng et al. Citation2019). Therefore, the corresponding comfort risks should be quantified to distribute aid and help with researches in feedback loops and non-linear interactions between health and the global change.
Using meteorological factors to calculate climatic comfort or environmental stress was first in the study of animal life and gradually extended to sciences focusing upon the study of humanity, but the core ideas kept consistent. Due to insufficient tools and poor understanding of comfort, previous studies mainly focused on those meteorological factors which could be directly aware of. Like temperature and relative humidity, the main variables related to climatic comfort or discomfort, influencing the environmental stress in the body (Rothfusz Citation1990; Tselepidaki et al. Citation1995; Staiger, Laschewski, and Grätz Citation2012; Houghton and Yaglou Citation1923; Yaglou Citation1927). As the heat from radiation got attention, the thermal balance came into widespread use in evaluation. The Wet Black Ball Temperature Index (WBGT), recommended by the International Standard Organization (ISO) to identify the thermal load, originated from the Black Global Humidity Index (BGHI) (Yaglou and Minard Citation1957; Budd, Citation2008). The Accumulated Heat Index (AHI), a metric accumulating heat stress has been proposed in 2015 (Lee, Byun, and Kim Citation2015). Hitherto, more than 100 meteorology-related indicators have been proposed to quantify the human comfort of living environment in different sensations (Chen Citation2000; Moran et al. Citation2001; Li, Liu, and Zhang Citation2011; Blazejczyk et al. Citation2012; Yan, Ye, and Chen Citation2013; Sirangelo et al. Citation2020). Among these methods the Temperature and Humidity Index (THI), the Wind Efficiency Index (WEI), the Dressing Index are widely used to guide tourism and population distributions in China. Ma et al. analyzed the directly and potentially climate-induced impacts on tourism in Shaanxi, Beijing and other western cities while Yu et al. assessed the global warming stressor posing a risk to summer resorts (Ma, Sun, and Li Citation2007; Ma and Sun Citation2009; Ma, Sun, and Ma Citation2011; Feng, . Yu, and Sun Citation2015).
However, there is little research on estimating the comfort of living environment based on a combination of population and environmental variables – showing up differences of comfort in age and mapping the comfort zones. Comfort in previous methods is viewed as an objective advantages or disadvantages, ignoring many physical, physiological, and psychological factors in this cognitive process (García Citation2019; Chinazzo, Wienold, and Andersen Citation2019). Indeed, age, gender, routines, education, financial situations, and jobs could have great influences on vulnerability and then changed the climatic comfort of living conditions (Lian et al. Citation2020). Numerous researches have confirmed that the most vulnerable individuals are the elderly and low-income groups (Fouillet et al. Citation2006; Gasparrini et al. Citation2012; Taylor et al. Citation2015; Wang et al. Citation2019). And much of these vulnerabilities may be preventable with an adequate warning and an appropriate response to layout of population, but preventive efforts are complicated by the meager evaluation like THI and WEI that may ignore the differentials in the comfort of various ages. Thus, prevention programs must be based around prospective and rational identification of high-risk persons and regions.
The Beijing-Tianjin-Hebei (BTH) region is a magnet for population and the society-economy development, one of the most important areas in China. As exploratory scenarios suggest the unprecedented declines in the extent and integrity of ecosystems, impacts amplified by the urban heat island effect, aging and high population density, implicating the future development of this area needs adequate ecosystem-supporting services for human beings (Tan et al. Citation2010; Varquez et al. Citation2020). Due to large complexities in age and physical states, potential underestimate of discomfort by THI or WEI will cause heat stress in people, harming their health and impairing their well-being and productivity, ending up with unnecessary casualties (Zander et al. Citation2018).
In the present work, we aim to contribute to the lack of age-related indexes in methods of the THI and WEI. In order to achieve this and to resolve this gap of not reflecting the vulnerability from age differentials, 50,083 participants were invited to complete an online questionnaire to probe their climatic comfort of the living environment across age groups. Different comforts in the same condition demonstrated that age was one of the major factors in comfort, and then a modified indicator measuring the age-induced vulnerability was constructed by comparing the affected degree. We investigated and analyzed the spatial and temporal changes of comfort calculated by the improved method based on the daily weather data of 171 stations in the BTH region from 1961 to 2019. The results provide a scientific basis for planning the population layout and taking the vulnerable into consideration. Our findings led to a general template to present the differentials of climatic comfort in all age baskets and properly evaluate human climatic comfort in relation to living environmental variability.
Materials and methods
Study region and meteorological data
The BTH region, located in the center of the North China Plain, is the economic center of the Bohai Bay Rim area. It covers about the area of 218,000 km2 and is characterized by the typical temperate-monsoonal climate with four clearly distinct seasons. In order to achieve the coordinated development and innovation drive of Beijing, Tianjin, and Hebei to become a top-tier metropolitan area, it is necessary to maintain human quality of life here.
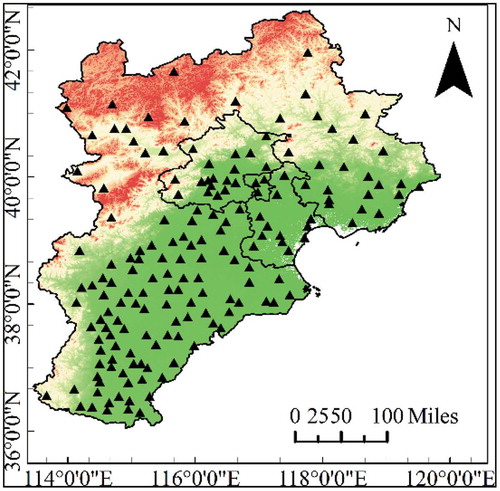
The daily meteorological data from 1961 to 2019 from 171 observatories in the BTH region () were selected, including temperature, relative humidity, sunshine duration, and wind speed (detailed information for this meteorological dataset see ). More details for the quality and observatories can be found at China National Meteorological Science Data Center (http://data.cma.cn/).
Table 1. The information for meteorological dataset used in this study
Figure 1. The distribution of meteorological stations in BTH region
Methodology
Introduction of THI and WEI
Living environment refers to the place closely associated with human living, and it is also where human interacts with the local environment. Under the national standard of China “Evaluation Standards for Climatic Comfort of Human Settlements,” the climatic comfort is defined as the comfort of a healthy person acting without any self-proofing equipment in nature (China National Standardization Administration Citation2011). In this method, two indicators are used to present the climatic comfort of the living environment, including the Temperature Humidity Index (THI) and the Wind Efficiency Index (WEI). The THI is determined by the environmental air temperature and humidity (EquationEquation 1(1)
(1) ), and it is used for evaluation of climate comfort from 21st March to 23rd September (the summer half year), with the wind velocity less than 3 m/s. For the remaining period, the climatic comfort of the living environment can be evaluated by WEI, which can be calculated by wind, temperature, and solar radiation (EquationEquation 2
(2)
(2) ). Besides, the climatic comfort of the living environment can be divided into five categories (), including Chill, Cold, Comfortable, Hot, and Muggy.
Table 2. Key questions in the online questionnaire
Table 3. The classification of the THI and WEI in the national standard
Where T (°C) is the mean air temperature at chosen timescale; RH (%) is the mean air relative humidity at chosen timescale; V (m/s) is the mean wind speed over time, and S (h/d) is the mean sunshine hours at chosen timescale.
Improvement of the evaluation method above
Age groups can be used as a demographic in a section of the population. It can refer to people who probably have the similar vulnerability in a group. Thus, we selected age as the main variable to present individual vulnerability, and then we conducted a 7-day questionnaire three times for the age-related vulnerability. Participants were required to complete the questions about self-perceived comfort to determine the age-influenced scores in this study. Here key questions were shown in and the answers combined five grade evaluation (scores of 1–5), meaning the higher the score, the lower climatic comfort and the higher vulnerability (). Narrow all of the questionnaires to get reliable ones. As we make sure the surveyed people have spent in BTH at least 3 months, the score of each group (the whole for an overall perspective, the youth for under 45, the midlife for 45–59, the pre-elderly for 60–74 with the elderly for more than 75) are taken a weighted average out.
Table 4. The classification of age-related vulnerability
At the first time around, we had 1152 effective samples with a return rate of 95.21% in the BTH region in April 2019. Participants included 498 males and 654 females whose mean age and length of residence were 41.7 years old and 4.8 years, respectively. And 535 people lived in Beijing, 350 people lived in Tianjin, and 291 people lived in Hebei. Then 23,122, including 11,028 males and 9778 females participated in the second round with a return rate of 91.15% in January 2019. Their mean age and length of residence were 39.1 years old and 5.3 years, respectively, and 7809 lived in Beijing, 3957 lived in Tianjin, 9310 lived in Hebei. In July 2020, 25,809 residents, aged nearly 38.5, from across the BTH region completed the online questionnaire. There were 11,806 males and 14,003 females, and 8211 in Beijing, 7598 in Tianjin, 10,000 in Hebei with the length of residence was around 7.6 years.
As batches make no significant differences in climatic comfort among age groups, the average value of the questionnaires can be considered as a different vulnerability of people under current living conditions (). In the BTH region, the age-related vulnerability increases with age and residents tend to feel much more uncomfortable during hot summer in a year. As the natural and society-economy conditions differ slightly here, and compares the random of sampling with the limitation of this small enquires, and the results of these samples are in line with reality, we thought this sampling is relatively enough to support next steps.
Table 5. The age-related vulnerability to derive RCSI from questionnaires
It is supposed that original detection () is reasonable when the scores under different weathers among age groups are 3.23 to the chill, 2.37 to the cold, 2.29 to the hot, and 3.43 to the muggy in the BTH region. Then, we propose an improved detection to determine the daily climatic comfort by comparing the age-influenced scores of different ages and adjusting original interval ranges ().
Table 6. The improved detection of degrees of climatic comfort of living condition
Based on , the Relative Climate Sensitive Index (RCSI) is proposed by proportions of different climate types and age-influenced scores. We calculated the daily THI and WEI to look them up in and figured out the daily corresponding comfort of all ages within a certain period in the study region. Then arriving at the daily age-related vulnerability scores through , the sum of scores divided by the total days equalled the RCSI of all ages ().
Figure 2. Improvement of the original evaluation based on age differentials
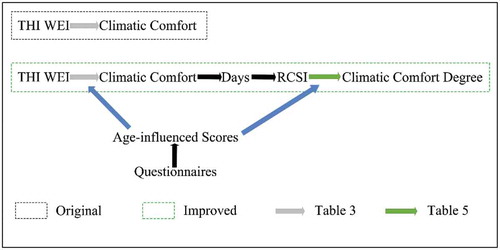
where the variables are defined as follows: i: feeling types including chill, cold, hot, and muggy; j: the target age group including who for an overall level, you for the youth, mid for the midlife, pre for the pre-elderly and eld for the elderly; n: total days of each group of a climatic comfort type; grade: per age-influenced score of each group under a climatic comfort type.
Mean RCSI per age group over a period in the BTH region takes the form:
Where the variables are defined as follows: xi: the total days of a feeling type within a period, i from 1 to 4, respectively, for chill, cold, hot, and muggy.
The climatic comfort of living conditions can be calculated through crossing RCSI with Climatic Comfort Degree ().
Table 7. Classification of comfort through RCSI
Results
The age-related differentials for somatosensory feelings
shows that the vulnerability tends to soar up with age, with a range from 2.22 to 2.89 of the youth, 2.30 to 4.05 of the midlife, and nearly 2.37 to 4.56 of the elderly. Thus, age has a role, the elderly is more sensitive to changes in climatic living conditions. And as residents’ responses aggravate with age, the potential vulnerability accompanies. For all scenarios, the relatively stable level from 2.22 to 2.89 of the youth indicates their fitness to adapt. Opposed to other groups, the under-45 s show similar discomfort to hot and cold weather, or relatively they are much more afraid of hot, which is in line with the opinion that young people are more physical-fit, better at adjusting to keep a wide range of optimal temperature, lacking in the heat-tolerant ability for a strong metabolism.
For taking acclimatization into consideration, the respondents need a living time of more than 3 months. And partly, the responses can be seen from the age-influenced scores in . Those who came in 2 weeks from Fujian, Guangdong, Guangxi, Hubei, Hunan, Jiangsu, Jiangxi, Shanghai, Zhejiang represented the southern climate condition, named as the southerners, while those from Gansu, Ningxia, Shaanxi, Tibet, Qinghai, Xinjiang, Liaoning, Jilin, and Inner Mongolia represented the northern climate conditions, named as the northerners.
Table 8. The average age-influenced scores of RCSI for original residence in the south or the north
The age-related vulnerability scores calculated separately reflected their hometown-related influence on climatic comfort. It can be concluded that the southerners show an adaptation of hot and sultry weather during late spring to early autumn; thus, relatively do not adapt to the cold. Although southerners and northerners are similarly affected by the cold weather, the northerners do better in adaptation to chill weather.
Spatial distribution of climatic comfort in BTH region
shows the comfort degree of the whole as an example. Comfort presents a form of a turned V and the most comfortable area is in Beijing, Shijiazhuang, Baoding, Xingtai, Chengde, Tangshan Zunhua, and Qinglong area with a decreasing trend on either side of this belt. And the comfort is positively correlated with altitude and longitude and presents a three-degree shift in the northwest-southeast direction on the left flank. The comfortable degree is higher in the northwestern region, slightly dropping in Zhangjiakou City with its close surrounding and tend to decrease further from the periphery of borders. As opposed to altitude and longitude – leading factors associated with air temperature, humidity, and wind velocity, total radiation arriving in this region keeping relatively stable, latitude has little to do with comfort. Interestingly, the uncomfortable degree appears higher on the coast. At a regional scale, the main climatic factor is lower temperatures in the northwestern region and increasing heatwaves in the southeastern area (Nan and Juan Citation2017).
Figure 3. The spatial distribution of climatic comfort across all ages in the BTH area from 1961 to 2019
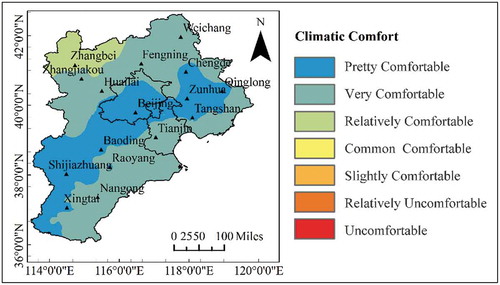
The Pretty Comfortable area (aka the relatively suitable area in all) covers a quarter of BTH region in the midlands, especially a hotspot running from the northeast to southwest and centering in a belt from Xingtai to Qinglong. The Very Comfortable area is the largest one and surrounds the Pretty Comfortable one.
Due to the various climatic sensitivity, there are significant differentials of the comfort of living conditions. Meanwhile, the Pretty and Relatively Comfortable zone shrinks with age, and the comfortable zone for the elderly may turn to a corresponding belt less than a quarter of the rest.
For the youth and midlife, a relatively comfortable area is well larger than the area of the elderly (). Overall, for the young people, the BTH region except the Zhangbei area meets the comfort to live in. And most of the BTH region is just Common Comfortable. More interestingly, there exist three relatively comfortable zones. And one is located in Beijing urban areas, the other one shows a semicircle in the northeast of Hebei, including Chengde as well as the nearby areas. The third is centered in the Shijiazhuang area. It should be noted that the relatively Uncomfortable and Uncomfortable zones overlap the BTH region.
Figure 4. The spatial distribution of climatic comfort by age group in BTH region from 1961 to 2019. The average climatic comfort of (a) the youth; (b) the midlife; (c) the pre-elderly; (d) the elderly. The results of (c, d) are acceptable. Impacts on cognitive processes of age-related vulnerability may change the comfort threshold, implying that elderly people will be apt to feel cold or hot than the young
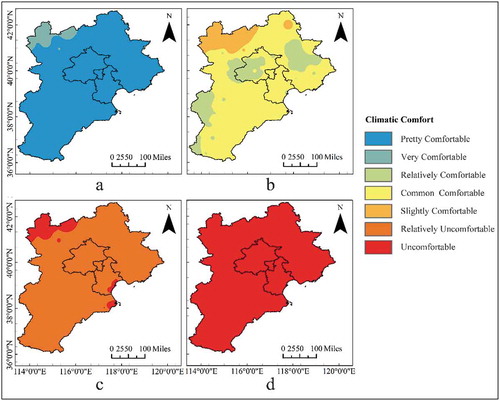
As vulnerability increases with age, the relatively suitable region gradually shrinks to the midlands. Combined, climate changes and aging will dramatically reduce comfort, with mean declines of 58% (from 30% to 93%) under current tendency with no other resource restrictions. Indeed, if climatic comfort is considered only as a whole, most will be overly optimistic about the human quality of life in old age, underestimating the potential risks and costs they will suffer. And this estimate presents RCSI as a better choice and represents the spatial extent of THI and WEI undermining the focus on the high-risk groups due to not accounting for age.
Seasonal variation and interannual changes of climatic comfort
As the comfort of life is a multifaceted problem, the daily comfort across age groups from 1961 to 2019 reflects that period from May to September may be the best season of a year when RCSI at the lowest is below 1.5 (). From November to March, RCSI are stably concentrated at 3.0, while the value largely reaches tothe same with a range from 2.8 to 3.0 in April and a range from 1.5 to 3.0 in October.
Figure 5. The density of monthly climatic comfort in the BTH region from 1961 to 2019
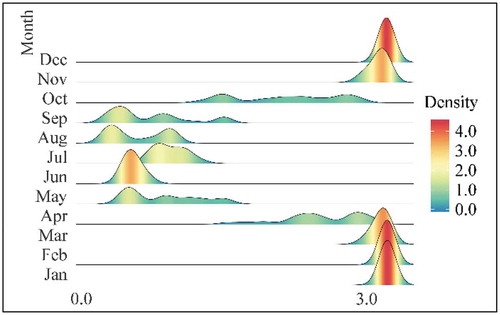
Comparing the month-mean comfort per age group over this region from 1961 to 2019 (), age-to-age differentials in comfort, either geographic location or date, are associated with a high risk of ignoring several possible problems to a particular group. Comfort decreases with age and relatively comfortable days are shrinking to two periods – from May to July and in September. The young people may not be affected by the hot summer, but other groups have apparently had uncomfortable days due to hot spells in the summer.
Figure 6. The seasonal variation of climatic comfort per age group in the BTH region from 1961 to 2019. (a) The average climatic comfort among age groups; (b) of the youth; (c) of the midlife; (d) of the pre-elderly; (e) of the elderly
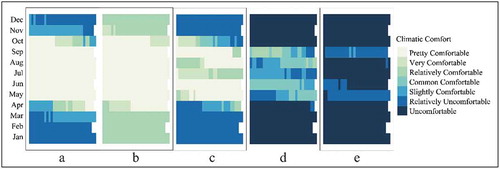
The masked signs from the conventional average-predominated evaluation are significant, potential risks from ignored people of advanced age stop them from reasonable supplies and policy support. Moreover, comfort is a subjective and personalized concept as can be cluttered with links to daily activities with a subtle influence that resulted from social change. Lifestyles, dress codes, jobs, fashion trends, complacency about the weather cause differential in exposure to climate changes. It is sensible to sort and assess like using the RCSI.
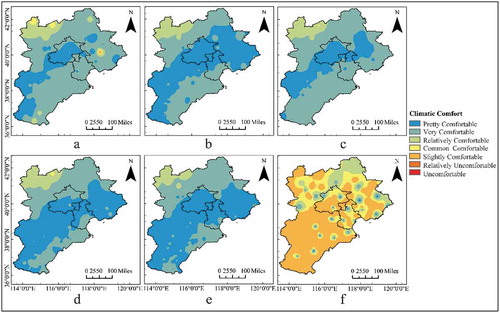
From 1965 to 1985, the comfortable zone had experienced two phases including an extension in the midlands, especially in northeastern and southwestern of the BTH region, and a reduction shrinking to Beijing, Shijiazhuang, Chengde areas (). And the climatic comfort of the BTH region kept stable (). But in the last 10 years, comfort has dived from Pretty and Very Comfortable to Common and Slightly Comfortable, while the Relatively Comfortable zone has sharply shrunk to particles in the north BTH region ().
Figure 7. The spatial distribution of climatic comfort across the ages in 6 selected years in the BTH region. (a–f) respectively for 1965, 1975, 1985, 1995, 2005, and 2015. Changes in a–e were mainly driven by interdecadal fluctuations of precipitations and shifts in rain bands. However, the urbanization is really taking off in the BTH region since 2010, coming with much more significant urban heat island effect. The frequency, intensity and duration of heatwaves have also grown, as climate change has intensified around the world, affecting an increasing number of people and areas. With an average warming rate of 0.23℃/10a (α = 0.01) from 1961 to 2000, and jumping to 3.3℃/10a (α = 0.01) for nearly a decade, the Relatively Comfortable zone has changed to Common and Slightly Comfortable in f. As the comfort decreases sharply with temperature and age, these prolonging hot periods have triggered and strengthened the decrease. Especially people living in the northwest Hebei province may still have comfort problems from cold, but the heatwaves have already shown negative impacts on their life quality during summer. And the urban and population density is relatively low in the north BTH region, there become more comfortable recently due to the lower warming
In all, the principal feature of the warming and its effects on quality of life are the ladder-like RCSI (aka climatic comfort of living conditions), driven by temperature, precipitation, and wind velocity in the BTH region in recent decades. Note that geography (e.g. altitude and longitude) becomes operative through temperature, and temperature here acts through a form of longitude and altitude. Moreover, the quasi-periodic signal of comfort due to precipitation patterns driven by SSTA, which triggers intensifying La Niña-type response in the tropical Pacific (Li et al. Citation2016).
Discussion
Our results offer four key findings. First, climatic discomfort grows with age. Original evaluation through THI and WEI neglects the possible risks, especially of the elderly, which may have a devastating effect on the vulnerable. RCSI represents both the climate changes and individual factors in a single metric, and it is useful and possible to assess the human quality of life. Risks cannot be fully eliminated, but adaptation measures can reduce vulnerability and exposure, and at the same time increase resilience (IPCC Citation2012). This method is sensible to prioritize the limited adaptation resources, design adaptation layout and inform adaptation strategies and understand how climate changes interact with comfort can inform adaptive actions and help to reduce the vulnerability.
Second, people here tend to be adapted to hot rather than cold, and heat acclimatization may be essential for preventing further loss of the life, property, and well-being (Lin, de Dear, and Hwang Citation2011). But much poorer self-regulation of infants, the elderly, lower-income people may lead to less adaptation to offset climatic fluctuations in the same situation (, Li, Li, and Wang Citation2019; Yan Citation2007; Mao Citation2007). As humid subtropical monsoon climate dominates here, annual heat and precipitation resources mainly coming in the summer as a couple, residents would have a certain heat adaptation during warm periods and then relatively feel much colder in the autumn. However, cold acclimatization is partly weakened for heating equipment. Technical tools have protected people from bad weathers, but the abuse of air conditioners or fans may have destroyed heat adaption to a certain extent. Temperature as well as humidity differences between indoors and outdoors may cause obvious discomfort, even ending up with a cold, heatstroke, fatigue, tension, irritability, hard to concentrate, memory loss, headache, dizziness, or other various diseases.
Third, the belt of Beijing, Xingtai, Qinglong with their surroundings becomes a relatively habitable zone. And low temperature, rapid cooling down from the late summer to early autumn and unstable accessibility for medical assistance are the main-and quite likely deadly disadvantages in the northwest. High humidity causes an apparently underreported perceptive-temperature and may put the over-60s at high risk in high latitudes coast (e.g. Qinhuangdao). As altitude decreases, alleviation in temperature difference and humidity lead to an increase in comfort over a year, especially in the spring or the early summer. On the other side, as the perennial conditions do not fully attend to the basic environmental needs, a relative improvement could not cover the increasing risks. Global warming may alleviate the cold stress in part but relatively worsens human quality of life in the south-eastern due to the growing intensity of the urban heat island and heatwaves. When the RCSI indicates a slight comfort increase in the high mountain chain of the north-western (probably for warming in summers), it is probable that global warming has posed people in the eastern coastal regions of the BTH region in a terrifying situation. In the past 59 years, the climate-driven positive is much weaker than the negative in the BTH region. Areas including Raoyang and Nangong, require adaptation in local contexts and adequate cooling treats for an emergency.
Forth, the higher climatic comfort in Beijing compared with other similar parts (e.g. Huailai and Fengning) indicates that, in the spring, the geography and frequent cold air activities may retard the warming rate. And these variations are partly due to centralized natural spectacles in nearby sites (e.g. Yesanpo National Park), which does not mean that metropolitan area is totally protected from climatic discomfort. Another illustration of the wetlands-driven influence is the relatively comfortable zones in Beijing urban areas as well as the semicircle. Apparently, greenery may be useful for adaptation and to maintain the human quality of life (Haddad et al. Citation2020). At a regional scale, the annualized comfort differs along the sloping downward terrain but metro areas and unevenly regional weather stations may cause disjunct leaps.
This study has some limitations. First, research gaps still remain, and existing knowledge is yet to address this challenge while development would falter without data. The comfort of children cannot be assessed in our method due to the scoring method, but they are a typical vulnerable group (Anderko et al. Citation2020). And comfort or discomfort is a cognitive process that mixes many internal and external forces, which is difficult to be measured by level. And age is probably a main factor, but evidences have confirmed the impacts of job, gender, or economic and social position (Buscail, Upegui, and Viel Citation2012; Kjellstrom Citation2016; Venugopal et al. Citation2020). Increasing heatwaves may cause other disasters threatening the quality of life (Johnston et al. Citation2020). Second, uncertainty comes from the scoring method. Providing accurate judgments on their comfort is not easy, overestimate or underestimate may lead to a lot of uncertainty in the age-related vulnerability scores. Third, due to the size and population of the BTH region, the way and duration of our sampling may bring that a certain uncertainty and potential limitation, like it does not take those who do not have contact with online questionnaires into account. However, if enlarge the enquires or extend the timeframe without reasonable control may go against the essential random in practice – like our questionnaires may focus on a particular population. Therefore, we would push ahead with an improvement in this method to gradually refined by a deeper inquiry into this region, and try to design a fuller sampling approach to make up for the small sample and problems due to long-term investigation.
Conclusion
Our research is an attempt to consider age differentials in the climatic comfort of the living environment. Clearly, RCSI covers much more potential risks of the elderly, links human comfort with the climate changes, living environment, and their age on a decade to half a century timescale. And through this method, differences in the comfort zone among age groups are even starker, especially the relative comfort zone of the elderly is less than the average. Increasing intensity of heatwaves and urban heat island driven by climate change and urbanization has led the eastern part a hotspot. But our results show the positive effects of vegetation in alleviation.
Vulnerability growing with age, the elderly is probably more vulnerable rather than the specific type at the peak all along. However, climatic comfort is subjective and affected by physiological, and psychological factors. Spatial and temporal patterns by age group may depend on themselves driven by some uncertainties. As this current manuscript is based on the 50,083 questionnaires, and by examination, we find the results are basically in line with reality, and instructive and acceptable to point out the vulnerable people and areas. However, RCSI is still is insufficient. Impacts on the vulnerability of age need to be accurately quantified and other relevant factors need to be taken into consideration.
Authors’ contributions
Siyu Liu designed the study, Siyu Liu, Weiying Yuan, Na Huang, Shangqian Ma, Ziyuan Zhang, and Yu Song acquired and undertook the data analysis, Siyu Liu, Buju Long, Zhihua Pan, and Fei Lun made the interpretation.
Disclosure statement
The authors declare no conflict of interest.
Additional information
Funding
References
- Anderko, L., S. Chalupka, M. Du, and M. Hauptman. 2020. “Climate Changes Reproductive and Children’s Health: A Review of Risks, Exposures, and Impacts.” Pediatric Research 87: 414–12. doi:10.1038/s41390-019-0654-7.
- Blazejczyk, K., Y. Epstein, G. Jendritzky, H. Staiger, and B. Tinz. 2012. “Comparison of UTCI to Selected Thermal Indices.” International Journal of Biometeorology 56 (3): 515–535. doi:10.1007/s00484-011-0453-2.
- Bongaarts, J. 2019. “IPBES. Summary for Policymakers of the Global Assessment Report on Biodiversity and Ecosystem Services of the Intergovernmental Science-Policy Platform on Biodiversity and Ecosystem Services.” Population and Development Review 45 (3): 665–686. doi:10.1111/padr.12283.
- Budd, G. M. 2008. “Wet-bulb Globe Temperature (Wbgt)—its History and Its Limitations.” Journal of Science and Medicine in Sport 11 (1): 20–32. doi:10.1016/j.jsams.2007.07.003.
- Buscail, C., E. Upegui, and J.-F. Viel. 2012. “Mapping Heatwave Health Risk at the Community Level for Public Health Action.” International Journal of Health Geographics 11 (1): 38. doi:10.1186/1476-072X-11-38.
- Chen, F. 2000. “Study on Urban Habitat Environment and Satisfaction Evaluation.” Urban Planning 53 (7): 25–27. doi:10.3321/j.1002-1329.2000.07.007.
- Cheng, J., X. Zhiwei, H. Bambrick, H. Su, S. Tong, and W. Hu. 2019. “Impacts of Heat, Cold, and Temperature Variability on Mortality in Australia, 2000–2009.” Science of the Total Environment 651 (2): 2558–2565. doi:10.1016/j.scitotenv.2018.10.186.
- China National Standardization Administration. 2011. “GB/T 27963-2011: Evaluation of Climate Comfort in Human Settlements.” Beijing. http://cmastd.cmatc.cn/reader.jspx
- Chinazzo, G., J. Wienold, and M. Andersen. 2019. “Daylight Affects Human Thermal Perception.” Scientific Reports 9 (1): 13690. doi:10.1038/s41598-019-48963-y.
- Díaz, S. S., B. Josef, E. S. Brondízio, H. T. Ngo, J. Agard, A. Arneth, P. Balvanera, et al. 2019. “Pervasive Human-driven Decline of Life on Earth Points to the Need for Transformative Change.” Science 366 (6471): aax3100. doi:10.1126/science.aax3100.
- Feng, Q., Z. Yu,G. Sun, et al. 2015. “An Analysis of Climate Comfort Degree and Tourism Potential Power of Cities in Northern China in Summer to the North of 40°N.” Journal of Natural Resources 30 (2): 327–339. doi:10.11849/zrzyxb.2015.02.015.
- Fouillet, A., G. Rey, F. Laurent, G. Pavillon, S. Bellec, C. Guihenneuc-Jouyaux, J. Clavel, et al. 2006. “Excess Mortality Related to the August 2003 Heat Wave in France.” International Archives of Occupational and Environmental Health 80 (1): 16–24. doi:10.1007/s00420-006-0089-4.
- García, M. C. 2019. “Thermal Differences, Comfort/Discomfort and Humidex Summer Climate in Mar Del Plata, Argentina.” In Urban Climates in Latin America, edited by C. Henríquez and H. Romero, 83–109. Cham: Springer. doi:10.1007/978-3-319-97013-4_5.
- Gasparrini, A., B. Armstrong, S. Kovats, and P. Wilkinson. 2012. “The Effect of High Temperatures on Cause-specific Mortality in England and Wales.” Occupational and Environmental Medicine 69 (1): 56–61. doi:10.1136/oem.2010.059782.
- Goldsmith, J. R. 1994. “Planetary Overload: Global Environmental Change and the Health of the Human Species.” American Journal of Epidemiology 139 (12): 1230–1232. doi:10.1093/oxfordjournals.aje.a116971.
- Haddad, S., R. Paolini, G. Ulpiani, T. Ihara, M. Kanda. 2020. “Holistic Approach to Assess Co-benefits of Local Climate Mitigation in a Hot Humid Region of Australia.” Scientific Reports 10:14216. doi:10.1038/s41598-020-71148-x.
- Houghton, F. C., and C. P. Yaglou. 1923. “Determining Equal Comfort Lines.” Journal of the American Society of Heating and Ventilating Engineers 29: 165–176.
- IPCC-Field, C.B., Barros, V., Stocker, T. F. et al. 2012. Managing the Risks of Extreme Events and Disasters to Advance Climate Change Adaptation. Cambridge University Press. https://www.ipcc.ch/report/managing-the-risks-of-extreme-events-and-disasters-to-advance-climate-change-adaptation
- Johnston, F. H., N. Borchers-Arriagada, G. G. Morgan, B. Jalaludin, A. J. Palmer, G. J. Williamson, D. M. J. S. Bowman, et al. 2020. “Unprecedented Health Costs of Smoke-related PM2.5 From the 2019–20 Australian Megafires.” Nature Sustainability. doi:10.1038/s41893-020-00610-5.
- Kjellstrom, T. 2016. “Impact of Climate Conditions on Occupational Health and Related Economic Losses: A New Feature of Global and Urban Health in the Context of Climate Change.” Asia Pacific Journal of Public Health 28 (2_suppl): 28S–37S. doi:10.1177/1010539514568711.
- Lee, J., H. Byun, and D. Kim. 2015. “Development of Accumulated Heat Stress Index Based on Time-weighted Function.” Theoretical and Applied Climatology 124 (3–4): 541–554. doi:10.1007/s00704-015-1434-x.
- Li, N., P. Li,Z. Wang. 2019. “Field Survey on Summer Thermal Comfort and Adaptation of University Dormitories in Changsha.” Journal of Harbin Institute of Technology 51 (4): 194–200. doi:10.11918/j..0367-6234.201805105.
- Li, X., S. Xie, S. Gille, and C. Yoo. 2016. “Atlantic-induced Pan-tropical Climate Change over the past Three Decades.” Nature Climate Change 6 (3): 275–279. doi:10.1038/nclimate2840.
- Lian, T., Y. Fu, M. Sun, M. Yin, Y. Zhang, L. Huang, J. Huang, et al. 2020. “Effect of Temperature on Accidental Human Mortality: A Time-series Analysis in Shenzhen, Guangdong Province in China.” Scientific Reports 10 (1): 8410. doi:10.1038/s41598-020-65344-y.
- Lin, T. P., R. de Dear, R. L. Hwang. 2011. “Effect of Thermal Adaptation on Seasonal Outdoor Thermal Comfort.” International Journal of Climatology 31 (2): 302–312. doi:10.1002/joc.2120.
- Li, Y., C. Liu, H. Zhang, et al. 2011. “Evaluation on the Human Settlement’s Environment Suitability in the Three Gorges Reservoir Area of Chongqing Based on RS and GIS.” Journal of Geographical Sciences 21 (2): 346–358. doi:10.1007/s11442-011-0849-2.
- Ma, L., and Sun, G. 2009. “Evaluation of Climate Comfort Index for Tourism Hotspot Cities in West China.” Arid Land Geography 32 (5): 791–797. doi:10.1016/S1003-6326(09)60084-4.
- Ma, L., G. Sun, F. Li, et al. 2007. “Evaluation of Tourism Climate Comfortableness in Shaanxi Province.” Resources Science 29 (6): 40–44. http://en.cnki.com.cn/article_en/cjfdtotal-zrzy200706006.htm.
- Ma, L., G. Sun, Y. Ma, et al. 2011. “Variation of Tourism Climate Comfort Degree in Beijing in the Last 50 Years.” Journal of Arid Land Resources and Environment 25 (10): 161–166. doi:10.1007/s12182-011-0124-2.
- Mao, Y. 2007. “Study on Climate Adaptability of Human Beings to Thermal Comfort in China.” Journal of Xi’an University of Architecture & Technology. http://kreader.cnki.net/Kreader/CatalogViewPage.aspx?dbCode=cdmd&filename=2007097118.nh&tablename=CDFD9908&compose=&first=1&uid=WEEvREcwSlJHSldRa1FhdkJtNEYweFZmbDVLdGNMUXR2Y1BTWlErSzdNZz0=$9A4hF_YAuvQ5obgVAqNKPCYcEjKensW4ggI8Fm4gTkoUKaID8j8gFw!!
- Moran, D. S., K. B. Pandolf, Y. Shapiro, Y. Heled, Y. Shani, W. T. Mathew, R. R. Gonzalez, et al. 2001. “An Environmental Stress Index (ESI) as a Substitute for the Wet Bulb Globe Temperature (WBGT).” Journal of Thermal Biology 26 (4–5): 427–431. doi:10.1016/S0306-4565(01)00055-9.
- Nan, D., and Wang, J. 2017. “Comparative Analysis on the Spatial-temporal Variations of Urban Heat Islands in Beijing-Tianjin-Hebei Metropolitan Area.” Journal of Beijing Union University 31 (4): 21–28. doi:10.16255/j.cnki.ldxbz.2017.04.005.
- Rothfusz, L. P. 1990. “The Heat Index Equation (Or, More than You Ever Wanted to Know about Heat Index).” Tech. Attachment, SR/SSD 90–23, NWS S. Reg. Headquarters, Forth Worth, TX. http://www.srh.noaa.gov/images/ffc/pdf/ta_htindx.PDF
- Rupa Basu, J. M. 2002. “Samet, Relation between Elevated Ambient Temperature and Mortality: A Review of the Epidemiologic Evidence.” Epidemiologic Reviews 24 (December): 190–202. doi:10.1093/epirev/mxf007.
- Sirangelo, B., T. Caloiero, R. Coscarelli, E. Ferrari, and F. Fusto. 2020. “Combining Stochastic Models of Air Temperature and Vapour Pressure for the Analysis of the Bioclimatic Comfort through the Humidex.” Scientific Reports 10 (1): 11395. doi:10.1038/s41598-020-68297-4.
- Staiger, H., G. Laschewski, and A. Grätz. 2012. “The Perceived Temperature – A Versatile Index for the Assessment of the Human Thermal Environment. Part A: Scientific Basics.” International Journal of Biometeorology 56 (1): 165–176. doi:10.1007/s00484-011-0409-6.
- Tan, J., Y. Zheng, X. Tang, C. Guo, et al. 2010. “The Urban Heat Island and Its Impact on Heat Waves and Human Health in Shanghai.” International Journal of Biometeorology 54:75–84. doi:10.1007/s00484-009-0256-x.
- Taylor, J., P. Wilkinson, M. Davies, B. Armstrong, Z. Chalabi, A. Mavrogianni, P. Symonds, et al. 2015. “Mapping the Effects of Urban Heat Island, Housing, and Age on Excess Heat-related Mortality in London.” Urban Climate 14 (Part 4): 517–528. doi:10.1016/j.uclim.2015.08.001.
- Tselepidaki, I. G., D. N. Asimakopoulos, K. Katsouyanni, C. Moustris, G. Touloumi, and A. Pantazopoulou. 1995. “The Use of a Complex Thermohygrometric Index in Predicting Adverse Health Effects in Athens.” International Journal of Biometeorology 38 (4): 194–198. doi:10.1007/BF01245388.
- Varquez, A. C. G., N. S. Darmanto, Y. Honda, et al. 2020. “Future Increase in Elderly Heat-related Mortality of a Rapidly Growing Asian Megacity.” Scientific Reports 10:9304. doi:10.1038/s41598-020-66288-z.
- Venugopal, V., P. K. Latha, R. Shanmugam, M. Krishnamoorthy, R. Omprashanth, R. Lennqvist, P. Johnson, et al. 2020. “Epidemiological Evidence from South Indian Working Population—the Heat Exposures and Health Linkage.” Journal of Exposure Science & Environmental Epidemiology. doi:10.1038/s41370-020-00261-w.
- Wang, Y., A. Wang, J. Zhai, H. Tao, T. Jiang, B. Su, J. Yang, et al. 2019. “Tens of Thousands Additional Deaths Annually in Cities of China between 1.5 °C and 2.0 °C Warming.” Nature Communications 10 (1): 3376. doi:10.1038/s41467-019-11283-w.
- Watts, N., W. N. Adger, P. Agnolucci, J. Blackstock, P. Byass, W. Cai, S. Chaytor, et al. 2015. “Health and Climate Change: Policy Responses to Protect Public Health.” The Lancet 386 (10006): 1861–1914. https://www.thelancet.com/action/showPdf?pii=S0140-6736%2815%2960854–6
- Yaglou, C. P. 1927. “Temperature, Humidity, and Air Movement in Industries: The Effective Temperature Index.” Journal of Industrial Hygiene 9: 297–309.
- Yaglou, C. P., and D. Minard. 1957. “Control of Heat Casualties at Military Training Centres.” A.M.A. Archives of Industrial Health 16 (4): 302–316.
- Yan, H. 2007. “Research on Human Thermal Comfort Climate Adaptability.” Journal of Xi’an University of Architecture & Technology. http://kreader.cnki.net/Kreader/CatalogViewPage.aspx?dbCode=cdmd&filename=1014011117.nh&tablename=CDFD1214&compose=&first=1&uid=WEEvREcwSlJHSldRa1FhdkJtNEYweFZmbDVLdGNMUXR2Y1BTWlErSzdNZz0=$9A4hF_YAuvQ5obgVAqNKPCYcEjKensW4ggI8Fm4gTkoUKaID8j8gFw
- Yan, Y., S. Ye, H. Chen, et al. 2013. “Advances on Assessment of Bioclimatic Comfort Conditions at Home and Abroad.” Advances in Earth Science 28 (10): 1119–1125. doi:10.11867/j..1001-8166.2013.10.1119.
- Zander, K. K., J. R. Cadag, J. Escarcha, and S. T. Garnett. 2018. “Perceived Heat Stress Increases with Population Density in Urban Philippines.” Environmental Research Letters 13 (8): 84009. doi:10.1088/1748-9326/aad2e5.