
ABSTRACT
The U.S. federal government’s requirements and guidance for wetland conservation are reflected in a series of federal laws, regulations, and policies. However, the degree to which these requirements are reflected in local planning efforts is unclear. This study using five components with 56 indicators evaluates how well wetland conservation efforts are integrated into 112 local comprehensive plans in Nebraska, USA. The results show that the majority of local comprehensive plans pay little direct attention to wetland conservation, although many conservation efforts are conducted under the umbrella of environmental protection frameworks. The indicators include water resource protection received the highest score and was the descriptor of natural or environmental resources and resulted in the highest level of local awareness on natural assets. The indicator of setting goals for no net loss of wetlands received the lowest score among all indicators, demonstrating a clear gap between the national vision and the local reality of wetland conservation. Findings suggest local governments need more direct and proactive inputs to improve wetland conservation. Further findings from this research provide a practical roadmap for planners globally, particularly for the developing countries, to integrate wetland conservation into the local planning systems.
Introduction
Significance of Wetlands
Wetlands are usually transitional spaces between aquatic and dryland habitats (U.S. Fish and Wildlife Service (USFWS) Citation2011), part of complex socio-ecological systems shaped by their socio-legal settings, and biophysical conditions that provide a series of important functions useful to humans (Gillespie Citation2018; USDA-NRCS (United States Department of Agriculture-Natural Resources Conservation Service) Citation2007; Mitsch and Gosselink Citation2000). Wetlands, as “biological supermarkets,” are home to many species of birds, fish, insects, and plants (USEPA, Citation2016). Thus, wetlands are crucial resources that provide a high quality of life to human communities (Thomassey Citation2007). The functions provided by a particular wetland depend on its location within a watershed (Novitzki et al., Citation1996). In the U.S., the U.S. Army Corps of Engineers (USACE) define wetland as “Areas that are inundated or saturated by surface or ground water at a frequency and duration sufficient to support, and that under normal circumstances do support, a prevalence of vegetation typically adapted for life in saturated soil conditions. Wetlands generally include swamps, marshes, bogs, and similar areas”(USACE, Citation1987). The main ecological services of wetlands include improving water quality, providing habitats to wildlife, fish, and plants, reducing floods and soil erosion, providing water supplies, and as open spaces (LeGrange Citation2005). Human actions and disturbances have caused critical wetland degradation and losses on earth. Four main impact factors, including pollution, biological resources use, natural system modification, and agriculture and aquaculture are considered as the major reasons of wetland degradation (Xu et al. Citation2019; Zhou, Zhang, and Liu Citation2016; Kirwan and Megonigal Citation2013; Klemas Citation2013; Nicholls Citation2004; Dugan and Dugan Citation1990). Strategies for protecting wetlands from human activities have been in place for many decades. Scientists, ecologists, and conservationists have globally promoted the importance of wetlands since 1970s (Finlayson, Citation2019; Davernport et al., Citation2010).
Loss and conservation of Wetlands
Wetlands were once seen as major impediments to transportation, agriculture, and community development (LaGrange Citation2015). Further, on a global scale, among the myriad detrimental human activities, urbanization, industrialization and transportation, forested plantations and agriculture have been the most direct causes of wetland loss (Xu et al. Citation2019; Hu et al. Citation2017; Kingsford, Basset, and Jackson Citation2016; Serran and Creed Citation2016; USFWS, Citation2006). Previous studies have shown that the world has lost between 54% and 57% of its wetlands since 1900 (Davidson Citation2014). Half of the wetlands in the lower 48 states of the U.S. have been lost since the 1780s (Jacob and Dupras Citation2021; Zollitsch and Christie Citation2015; Dahl Citation1990). The loss of wetlands in inland states has been dramatic in the 20th century, especially from 1950s to 1980s (Dahl Citation2011, Citation1990). After a short period of gain from 1998 to 2004, the wetland of U.S. start to loss again from 2004 to 2009 (Dahl Citation2011). For example, there are four major types of wetlands in Nebraska: saline wetlands, riverine wetlands, playa wetlands, and sandhill wetlands which made up 6% of the land of Nebraska, approximately 11,778 km2, in 1867 (Tang et al. Citation2016; LaGrange Citation2015; Dahl Citation1990), but covered only 3.9% of Nebraska in 1990, approximately 7,711 km2 (Tang et al. Citation2016; LaGrange Citation2015; Dahl Citation1990). The leading cause of this loss is agricultural conversions (Fretwell Citation1996). The rate of loss (69–75%) has been more significant for natural inland wetlands, such as those found in Nebraska, than for natural coastal wetlands (62–63%) during the 20th century (Reis et al. Citation2017; Davidson Citation2014). In the central Nebraska area, historic wetlands degradation is over 85% and accelerated due to agriculture expanding over several decades (Tang et al. Citation2018; LaGrange Citation2015; Tang et al. Citation2012). Although the number of manmade wetlands has increased in recent decades, this increase can still not offset the losses of natural wetlands and the degradation of ecosystem services by natural wetlands that were previously established for hundreds of years (Gardner et al. Citation2015). The significant wetland loss and continuous degradation call for effective wetland conservation in the inland states.
In the U.S., federal and state agencies have made dramatic efforts to protect and restore wetlands. Local jurisdictions play a critical role in wetland conservation since wetlands are often located adjacent to water bodies such as rivers, streams, lakes, and coastal waters which play important roles for local communities (ASWM, Citation2011; Kusler Citation2006). Local wetland conservation can lead to a series of significant benefits to local communities, such as groundwater recharge and discharge, flood storage and conveyance, sediment stabilization, pollution control, water quality improvement, wildlife habitat and food chain support, fisheries, and local heritage (Maltby Citation1991; Kusler Citation2003). Many state agencies and local jurisdictions have recognized wide-ranging benefits of wetland conservation for communities, such as increased quality of life and disaster resistance (Berke and Godschalk Citation2009). State and local agencies can make different types of plans to protect and restore wetland resources within their jurisdictions. In U.S., most of the states made the state-wide wetland program plans and keep regular updates in every 3–5 years. For example, the most recent Wetland Program Plan for Nebraska was updated in 2019 which set up a state-level collaborative framework for protecting, restoring, and managing wetlands within the state. Moreover, in order to protect the globally unique saline wetlands in eastern Nebraska, the state made the specific Nebraska’s Eastern Saline Wetlands Conservation Plan in 2018, which is a ten-year period plan to address saline wetlands conservation through collaborative partnerships.
Local planning mechanism and evaluation
Typically, two types of local planning approaches are applied to wetland conservation: standalone wetland conservation planning and integrated wetland conservation planning. The standalone wetland conservation planning tends to develop separate wetland protection and restoration plans. An integrated wetland conservation planning approach emphasizes incorporating conservation efforts into existing planning mechanisms, such as local comprehensive planning, hazard or floodplain mitigation planning, watershed planning, storm water management planning, parks and recreation planning, and infrastructure planning. The standalone wetland conservation planning is a centralized planning process with collective efforts that receive higher attention than integrated wetland conservation planning. However, the standalone wetland planning typically only involves limited stakeholders in the planning process which leads to inadequate authority and relatively weak capacity in the implementation of wetland management. The integrated wetland conservation planning process normally includes broader stakeholders, particularly for the specific stakeholders (e.g., floodplain managers, land use planners, transportation planners, etc.), into the planning process to achieve “multiple-win” goals. The standalone wetland conservation planning is a separate document from existing local plans, leading to implementation difficulty. Compared with standalone planning approach, the integrated planning approach provides a collaborative platform with multi-objective opportunities and less implementation barriers. Local integrated plans can also provide a framework for specific purposes (e.g., watershed management, land use planning, floodplain management, etc.) for a local community over a long planning term. Local integrated wetland plans are robust tools for both developed countries and developing countries. Gürlük and Rehber (Citation2006) show an excellent case study of the integrated wetland management plan of Uluabat lake, Turkey, as not only a comprehensive plan but also a blueprint for local wetland protection. The case study of Jia, Ma, and Wei (Citation2011) analyses the different functions of wetland planning on different types of urban wetland in Beijing, China. Generally, developing countries are rapidly developing modern communities, industries, utilities, etc. A high-quality local integrated wetland plan can play an important role in achieving land development and wetland conservation goals.
This study particularly examined the integration of wetland conservation into local comprehensive plans, which serve as blueprints for local development. Comprehensive plans are sometimes called comprehensive development plans, master plans, or general plans. A comprehensive plan typically outlines the protections for important community natural resources and addresses potential community challenges. Local comprehensive plans are ideal for identifying critical wetland resources and developing strategic policies to balance land development and wetland conservation. Empirical research on the role of local comprehensive plans in the management of large-scale natural systems is very limited (Berke et al. Citation2013). Scholars have developed methods to evaluate the quality of local planning since the early 1990s (Lyles and Stevens Citation2014). Evaluating existing plans assisted researchers and planners in improving the quality and effectiveness of these plans (Berke and Godschalk Citation2009; Brody Citation2003). A high quality plan makes it easy for planners to gain community support and implement the plan (Guyadeen Citation2018). Local jurisdictions are often involved in developing comprehensive plans to protect ecological systems based on shared goals and strategies. Berke et al. (Citation2013) suggested coordinated local planning should be incentivized by state and federal governments. Most existing frameworks for evaluating the quality of plans use coding protocols based on specific indicators and then assess a set of plans based on the presence or absence of these criteria (Brody Citation2003; Kaiser, Citation1995). Tang (Citation2008) advanced the plan evaluation concepts through evaluating how effectively strategic environmental assessment principles were integrated into local comprehensive land use plans. Finlayson (Citation2012) found that 29% of the groups he examined integrated policies on wetland conservation into their planning activities and decision-making processes. As Berke et al. (Citation2013) also find that, few studies on the management of natural systems exist in local comprehensive plans. This study further developed this research framework with a series of measurable indicators under five components and used indicators to assess the relative wetland conservation efforts in local comprehensive plans. Using these 56 indicators and 5 components, we normalize all the score into percentages to analyze and compare the performance of each indicator, component, and plan. The analysis of these indicators presented in this study has the potential to assist local planners in identifying methods to reduce the gap between ideal and actual conservation efforts.
Research questions
The primary goal of this study was to determine how effectively local comprehensive plans have integrated wetland conservation in their long-term planning documents. We first developed a component-category-indicator framework and then used the framework to assess how well wetland conservation was integrated into local plans. Specifically, we focused on how local comprehensive plans in Nebraska integrated wetland conservation into local comprehensive plans and what categories of wetland conservation were the focus of these local plans.
This study addressed two specific research questions:
How well do the cities, counties, and Natural Resources Districts (NRDs) in Nebraska integrate wetland conservation into local comprehensive plans?
How can the integration of wetland conservation into local comprehensive plans be improved?
Research framework
Based on the literature (Berke and French Citation1994; Brody Citation2003; Tang Citation2008), a component-category-indicator score system was introduced into this study. We identified 56 indicators of the five evaluation components and the relevant categories to assess the wetland conservation efforts in local comprehensive plans (). Classifying the indicators in the local comprehensive plans resulted in consistent summaries of region specific wetland-related content. Three types of plans were analyzed in this research: city comprehensive plans, county comprehensive plans, and NRD master plans. Using a ternary scale to evaluate each wetland-related content item, we analyzed the differences among plans, jurisdictions, and indicators.
Table 1. Indicators used to evaluate the local comprehensive plans
The five components of the evaluation are described below.
Factual basis
Effective plans must be based on reliable data on the existing local conditions and the development needs of a community. These data are the basis for developing goals and policies. In this study, thirteen indicators were used to measure a plan’s grounding in facts; for example, does a plan include a definition of wetlands and data on the local historical loss, and does it identify the major challenges facing the planning area? This study uses three categories in this component: resource inventory, management concepts, and human impacts. These 13 indicators are used to evaluate the planners’ understanding of the fundamental facts of wetland conservation.
Goals and objectives
Goals and objectives reflect a community’s future conditions and guide the implementation of a local comprehensive plan. This component includes six indicators. These specific goals and objectives guide the implementation of wetland conservation in local comprehensive plans. For example, a direct mention of land use goals related to wetland conservation is considered to be an indicator of a land use objective.
Policies, tools, and strategies
Policies, tools, and strategies are the realizations of goals and objectives. This study measures the presence and strength of policies, tools, and strategies in local comprehensive plans that in realizing their stated wetland conservation goals and objectives. Four categories and 28 indicators are included in this component. The four categories are: land use policies, watershed related regulations, land acquisition and incentive strategies, and education and outreach.
Coordination and integration
Environmental problems are complex and effective plans must be coordinated with those of other jurisdictions, landowners, and organizations. This study assesses whether the wetland-related content in local comprehensive plans directly or indirectly reflects public participation and/or cooperation with other agencies, jurisdictions, and landowners. These four indicators focus on four different aspects of coordination: laws, governments, non-governmental organizations, and planning system.
Implementation
A good plan should identify realistic and measurable steps to make the plan a reality. Once adopted, a plan’s policies, tools, and strategies must be successfully implemented. Local comprehensive plans should also state how they will monitor the effectiveness of the implementation. Thus, implementation is a requisite component to finish the evaluation. Five indicators are adopted to measure the implementation efforts in these plans.
Methodology
Study area
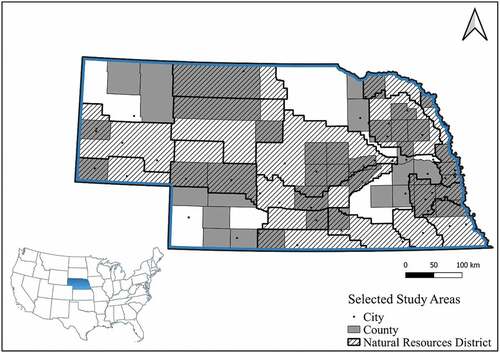
The study area covers all 147 cities, 93 counties, and 23 NRDs in Nebraska. Nebraska is a state of Midwest region of the U.S. with two major land regions: the Dissected Till Plains and the Great Plains. The population of Nebraska is over 1.9 million with area of 200,000 km2. We collected local comprehensive plans from cities and counties and master plans from NRDs. The population for this study is all of the jurisdictions in Nebraska, including city, county, and NRD levels. We collected all the comprehensive plans in three approaches: download from government websites, respond from local planning departments and respond from consulting companies. After systematic searching, we were able to collect 112 comprehensive plans in total, including 57 of them from cities, 40 of them from counties, and 16 of them from NRDs by 31 December 2018. The rest local comprehensive plans are either in the process of development or unavailable to acquire. The City of Lincoln and Lancaster County share the same Lincoln/Lancaster County 2040 Comprehensive Plan. Each plan evaluated in this research represents the most recently adopted version and is currently in effect for that local jurisdiction. The location of the selected plans is illustrated in .
Figure 1. Location map for the cities, counties, and NRDs of Nebraska.
Nebraska law gives a comprehensive plan a core role in the whole local government’s planning system (Scholz et al. Citation2002). Most cities and counties in Nebraska use the term comprehensive plan, although some regions use the term of comprehensive development plan. The planning jurisdiction of a county means the rural area within the boundary of that county but outside the planning jurisdiction of cities or villages. The planning jurisdiction of a city means all the area with the corporate limits and the extraterritorial jurisdiction of that city. In Nebraska, NRDs are responsible for the development, management, use, and conservation of groundwater and surface water. The NRDs prepare and adopt master plans in accordance with natural river basin boundaries in Nebraska. Among 12 aspects of NRDs’ master plans, most of them such as flood prevention and control, water supply, pollution control, and wildlife habitat management, are closely related to wetland conservation.
Plan coding procedures
We first evaluated the wetland conservation measures in 112 local comprehensive plans in three steps. The first step was to capture all of the wetland content into the five components discussed in the research framework section. The second step was to group the similar indicators as sub-categories within each component. The third step was to evaluate the indicators and issue specific scores for each indicator. After evaluation of the local plans, the component scores of the different components, indicators, and jurisdictions were compared to identify the success of different jurisdictions in integrating wetland conservation into their local plans.
We used a 0-1-2 scoring system. Each plan was assigned a score of 0, 1 or 2 for each indicator. If a local comprehensive plan did not contain content relating with a specific indicator, that plan will score 0 points for that indicator. If a plan contains content directly linked with a specific indicator in the context of wetland management, the plan scored 2 points for that indicator. When an indicator was generally mentioned without a direct focus for wetlands itself, a score of 1 was given to this indicator. Some plans mention environmental or natural resources protection, but do not specifically refer to wetlands. The final score for each indicator is shown as a 0–2 scale.
To create a benchmark for comparison, all of the final scores for each plan and each component were standardized into percentages on a 0–100% scale. Each component may include varied indicators, but we standardize the score by using the actual given scores divided by possible maximal scores in each component (at the scale of 0–100%). The final score for each local comprehensive plan was also standardized as a percentage by using the actual given scores divided by the possible total points in each plan (at the scale of 0–100%).
Statistical reliability test
This study adopts the Krippendorff’s alpha (α) to test the reliability for inter-coder plan evaluation (Krippendorff Citation2011; Stevens, Lyles, and Berke Citation2014). The local comprehensive plans collected are assigned to two researchers from the research team for simultaneous evaluation. The value of Krippendorff’s alpha (α) (>0.80), indicated reliable plan evaluation results.
Results
Overview of plan evaluation
The average final score for all the local comprehensive plans collected in this research was 29.4% (0–100% scale). This result indicates that wetland conservation is not well integrated into local comprehensive plans in Nebraska, although there is a wide variation among jurisdictions. However, wetland conservation has been increasingly integrated into local plans through time.
Among all of the 112 plans, the maximum score is 86.61% (0–100% scale), from Lancaster County and City of Lincoln (LPlan 2040, 2016 update). The minimum score is 1.79%, from the Lower Republican NRD Master Plan. According to the quartile method, the upper bound of the total score is 69.42% (0–100% scale). Five plans are above the upper bound, including Lincoln County (70.54%), Blaine County (74.11%), Cherry County (72.32%), Douglas County (80.36%), and Lancaster County & City of Lincoln (86.61%).
Jurisdiction evaluation
The total scores are expressed at the scale of 0–100%. illustrates the total scores for the county, city and NRD comprehensive plans. The county comprehensive plans perform best among three. The score of county comprehensive plans is higher than the other two in mean, median, and range. Among the three levels of planning jurisdiction, the county comprehensive plans have the highest mean score of 41.88%. City comprehensive plans place second with a mean score of 28.51%. NRD master plans have the lowest mean score of 5.25%. If median values are considered, the county comprehensive plans still perform best and the NRD master plans remain at the lowest level.
Figure 2. Boxplot of the total scores from the county, city, and NRD comprehensive plans.
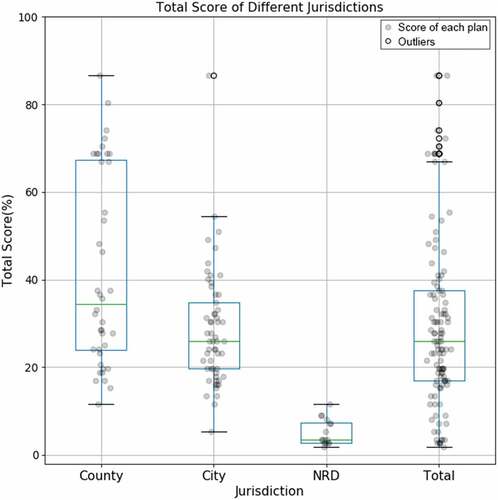
In the county comprehensive plans, the 50th percentile is 34.38% with an interquartile range (IQR) of 45.32%. There are no outlier scores in the county comprehensive plans. In the city comprehensive plans, the 50th percentile is 25.89%, with an IQR of 16.52%. The Lincoln/Lancaster county’s LPlan 2040 (86.60%) is the only outlier among the city comprehensive plans. The 50th percentile of the NRD master plans is 3.57%, with an IQR of 5.13%. There are no outliers in the NRD master plans.
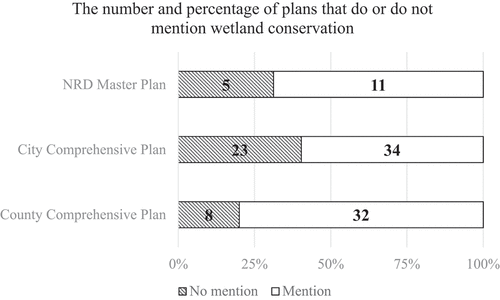
Among the local comprehensive plans, there were several plans with a score of 0, indicating that they do not mention wetlands at all. The numbers and percentages of local comprehensive plans that do not mention wetlands are given in . Another critical statistic result is the rate of zero scores at the jurisdictional level: 41% (23 out of 56) of the city comprehensive plans do not mention wetlands, whereas only 20% (8 out of 40) of the county comprehensive plans and 31% (5 out of 16) of the NRD plans do not mention wetlands.
Figure 3. The number and percentage of plans mention that do or do not mention wetland conservation.
Component performance
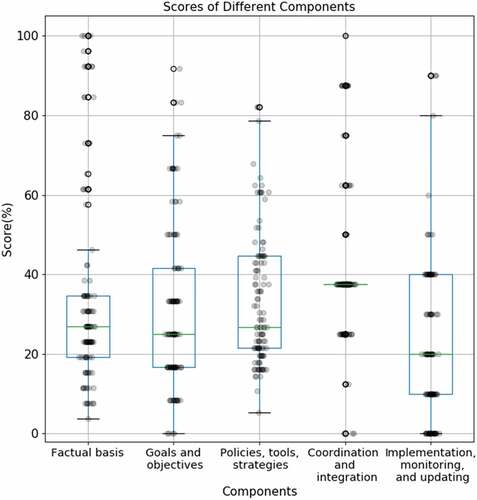
At the component level (0–100% scale), The mean of the component score is between 20.54% to 41.47%. The component Factual basis had a mean score of 35.06%; goals and objectives has a mean score of 30.65%; policies, tools, strategies has a mean score of 32.68%; coordination and integration has a mean score of 41.47%; and implementation, monitoring, and updating has a mean score of 20.54%. The component coordination and integration range from 0 to 100%, which is the largest. The mean score of counties is also the highest among the three in all five components. The medians, percentiles, and outliers for each component are shown in . It illustrates that the coordination and integration component scores are the highest scores, and the implementation component scores were the lowest scores.
Figure 4. Boxplot comparison for the received scores among five plan components regarding to wetland conservation efforts.
Indicator performance
Each indicator’s performance is listed in . Indicator performance is measured by total mean score with a scale of 0–2. For 56 indicators used in this study, the mean score of all of the indicators was 0.65, with a range from 0.04 (“goals for no net loss of wetlands”) to 1.25 (“natural or environmental resources described”). The median for the indicators was 0.66 with an IQR of 0.51. We consider individual indicators in the 90th percentile as good performers. The five indicators in the 90th percentile are “natural or environmental resources described” (1.25), “subdivision regulations on open space and park lands” (1.19), “integration with other plans/policies/programs” (1.14), “environmental regulations for natural system protection” (1.13), and “goals for ecosystem/biodiversity protection” (1.12). Moreover, the indicators that received the lowest attentions by these plans are located in the 10th percentile. The five indicators in the 10th percentile are “goals for no net loss of wetlands” (0.04), “wetland-related task force/committee” (0.09), “development rights related strategies” (0.10), “density bonus” (0.13), and “waterfront recreational sites for education/educational facilities” (0.15).
Table 2. Total mean score and ranking of each indicator
Indicator performance by jurisdictions
Each indictor’s performance by jurisdictions is also expressed at a scale of 0–2. The mean score of the county comprehensive plans was 0.84, with a standard deviation of 0.44. The indicator “natural or environmental resources described” has the highest score (1.48) in the county comprehensive plans subsample. This indicator also had the highest score in the whole sample. The next four most common indicators all belong to the goals and objectives category. “Integration with other plans/policies/programs” was the only indicator in the coordination and integration category in the 90th percentile of the county comprehensive plans subsample. There were also five indicators ranked below the 10th percentile score for county comprehensive plans. The lowest scored indicator was the “goals for no net loss of wetlands” (0.10) indicator from the factual basis component. The other four indicators ranked below the 10th percentile also included three from the policies, tools, and strategies component, and one from the implementation component.
The mean score of the city comprehensive plans was 0.57, with a standard deviation of 0.26. The indicator with the highest score is the “subdivision regulations on open space and park lands” (1.21) indicator from the policies, tools, and strategies component. In addition to the top indicator, four of the five 90th percentile indicators from the city comprehensive plans belong to the policies, tools, and strategies component. Another indicator, the “natural or environmental resources described” (1.14) indicator, from the factual basis component, ranked third among the city comprehensive plans indicator ranking. Six indicators ranked below the 10th percentile of city comprehensive plans’ scores. The lowest score comes from the indicator “goals for no net loss of wetlands” (0.04). Among 57 city comprehensive plans, only LPlan 2040 of the City of Lincoln described the national goal of no net loss. All five components include indicators ranked in the 10th percentile of the city comprehensive plans.
The mean score for all indicators in the NRD masterplans was 0.10, with a standard deviation of 0.06. For the NRDs master plans, the highest scores were from the indicator “goals for ecosystem/biodiversity protection” (1.56), which belongs to the goals and objectives component. This indicator was the only indicator from the goals and objectives component ranked above the 90th percentile of the master plans. The policies, tools, and strategies component has three indicators above the 90th percentile and the coordination and integration component has two indicators in this rank. The indicators from the master plans below the 10th percentile ranking all scored 0 points, which indicates that these indicators are neither directly mentioned in the plans nor related to the plans.
Points distribution
The distribution of the 0, 1, or 2 points is expressed by percentage at a scale of 0–100%. show the distribution of the 0, 1, or 2 points analyzed independently. In the full sample, 47.9% of the indicators scored 0 points, 39.04% scored 1 point, and 13.06% scored 2 points.
Figure 5. Percentage of 0, 1, and 2 points in each type of plan regarding to wetland conservation efforts.
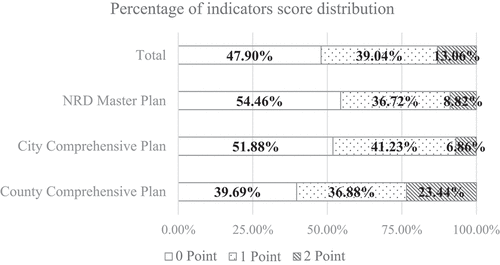
Figure 6. The percentage of indicators with 0, 1, or 2 points regarding to wetland conservation efforts.
demonstrates that the county comprehensive plans (39.69%) have the lowest 0 point rate, whereas the NRD master plans (54.46%) have the highest 0 point rate. The county comprehensive plans also have the highest rate of 2 point scores (23.44%) (i.e., most often directly mention wetland conservation measures), whereas the city comprehensive plans have the lowest number of 2 point score (6.86%). In total, the 0 point indicators represent 47.90% of the sample, which leaves 39.04% of the indicators with a score of 1 point and only 13.06% of the indicators with a score of 2 points.
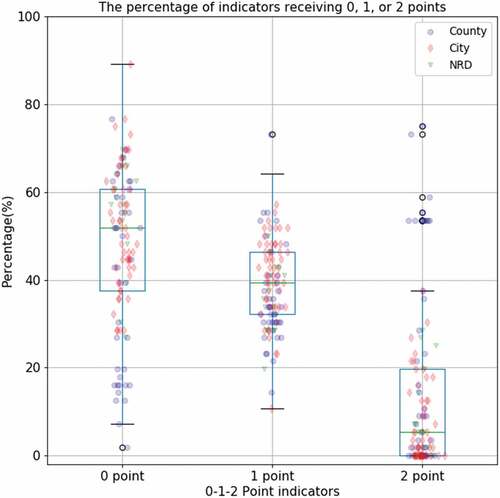
shows the point distribution for each indicator. Each point in the figure represents the percentage of 0 (or 1 or 2) scores in an individual comprehensive plan. demonstrates that many indicators were not mentioned in any plan (i.e., a score of 0), and that very few plans directly mentioned any indicators (i.e., few 2 point indicators).
Discussions
These results indicate a clear disconnect between wetland conservation efforts and local comprehensive planning efforts. Out the 112 comprehensive plans in the sample, approximately one-third of them did not contain content that directly addressed wetland conservation. This finding indicates local jurisdictions in Nebraska generally have relatively limited capacity and interest to manage and implement wetland conservation and management efforts. These findings should contribute to the improvement of local comprehensive plans by highlighting the need for better integration of wetland conservation. Based on our findings, the majority of the local comprehensive plans do not address wetland conservation sufficiently. Even basic information, such as “wetland definition” (ranked 48 out of 56) and “local wetland types/classification” (ranked 47 out of 56) are not well integrated into local comprehensive plans.
Moreover, the low frequency of 2 point scores for indicators across all of the local comprehensive plans shows that most local comprehensive plans in Nebraska do not directly consider wetland conservation or acknowledge a role for wetlands in their communities’ futures. Federal and state policies and strategies are not integrated into local plans, despite a few good examples of local plans that incorporate wetland conservation. Indicators such as “links with local approvals with 404 permit and/or 401 certifications/swampbuster/title 117” (ranked 51 of 56) and “Goals for no net loss of wetlands” (ranked 56 of 56) are among the least represented indicators in the local comprehensive plans. This result indicates the clear gap between the federal conservation mission and the local reality.
However, we also acknowledge efforts local jurisdictions have made in their plans for general environmental protection or natural resources conservation. From the number of indicators that scored 1 point, we found that local governments are making some efforts to protect wetlands. In general, local governments are protecting wetlands by planning more green space and placing limits on construction, which will have a positive influence on wetland conservation. The conservation template used in the Douglas County comprehensive plan is an outstanding example of integrating wetland conservation with land use strategies and local comprehensive plan implementation. It considers many elements, such as land use policies, zoning regulations, storm water policies, and landscaping regulations. However, this level of detail is not found in any other comprehensive plans in our sample. The general trend matches the trend in wetland loss identified in the U.S. Fish & Wildlife Service report (U.S. Fish and Wildlife Service (USFWS) Citation2011): wetlands are shrinking despite the slow integration of wetland conservation into local plans.
The results also support the findings from Berke et al. (Citation2013) and Finlayson (Citation2012)’s studies. The percentage of local communities in Nebraska that integrate some degree of wetland conservation into local comprehensive plans is higher than 29%. However, 20% of the county plans, 41% of the city plans, and 31% of the NRD plans do not integrate any aspect of wetland conservation into their comprehensive plans.
The variations among jurisdictions may occur for the following reasons. Counties in Nebraska generally better integrate wetland conservation into their local comprehensive plans relative to NRDs. It is not surprising that counties perform better since many of wetlands are located on county planning areas, rather than within city limits. Counties perform better than cities because of differences in responsibilities between different level of planning jurisdictions. Cities have authority over the built environment areas including city limits and Extraterritorial jurisdiction lands, whereas counties manage these lands in natural conditions beyond built areas. The differences between cities and counties are obvious when the two are compared. There are four major types of wetlands in Nebraska: saline wetlands, riverine wetlands, playa wetlands, and sandhill wetlands. Many of them are located outside the cities’ boundaries. The low scores of NRDs was likely caused by their specific function. The main focus of NRD master plans is on water resource management rather than land use planning. NRDs in Nebraska were created to solve issues of flood control, soil erosion, and groundwater quantity and quality. NRDs use function plans to implement conservation, which is one possible reason why NRDs perform poorly in master plans. The master plan of Papio-Missouri River NRD is an example here. This master plan got the highest score (31%) among all the NRD master plans. This master plan contains a chapter focusing on land use and other natural resources other than water. For comparison, the master plan of Lower Platte South NRD get a low score (3%). This master plan is a plan mainly focus on water resources, and no land use related contents are included. Another important reason for their poor performance was likely by the choice of indicators used in this study. The indicators used in this study are based on the sample of comprehensive plans used. One of the critical functions of local comprehensive plans is land use planning and NRDs are not as concerned with land use planning as counties and cities. In addition, NRDs may consider wetland conservation with other types of plans, such as hazard mitigation plans.
The focus of this study only addressed the plan quality itself and did not measure the actual performance of plan implementation in wetland conservation. However, higher quality plans can make good preparations for local jurisdictions in wetland conservation efforts. The actual planning implementation performance may be subject to a series of other factors, such as financial commitment and political culture. The final result shows that the coordination and integration component (41.47%) gains the highest score, and the implementation, monitoring, and updating component (20.54%) receives the lowest score. The indicators of coordination component get very few 0 points as well as 2 points. For the implementation component, this component gets a very high level of “0” point rate and a very low level of “2” point rate. This result shows that the implementation of wetland conservation is not recognized in most of the integrated wetland conservation plans. Wetland conservation is also lacking a long-term monitoring mechanism in those plans. For the other three components, the points are more discrete distributed, and some indicators get very high scores while some are not. For example, goals for ecosystem protection get 1.12 mean points ranked 5th place. In comparison, the indicator of “no net loss goal” only gets 0.04 points while ranked the last among all indicators, which leads the low score for the goals and objectives component. The final results show that wetland conservation usually appears at a broader umbrella of environment and ecosystem associated contents. Wetland conservation itself is not a direct recognition of these local plans. Those plans that did not have the national goals such as “no net loss” mentioned is not meet the lowest standard for wetland conservation integration. The indicator score differences are also reflected in .
Policy implications for promoting the integration of wetland conservation with local comprehensive plans
The results show that local governments in Nebraska have made efforts in wetland conservation. However, this progress has not always been reflected in local comprehensive plans. The results of this study have implications for improving the integration of wetland conservation into local comprehensive plans. In particular, this study shows that few plans integrate policy related issues; therefore, this component could be improved. Currently, the indicators that frequently have a score of 1 point could be relatively easily improved upon, as a score of “1” indicates an issue that has been indirectly acknowledged. For example, the indicator “water resources description” currently scores 1 point more often than it scores 2 points. If local comprehensive plans could directly develop policies to protect water resources related to wetland conservation, the integration of wetland conservation into local plans would be greatly improved.
Our findings also suggest that the integration of local comprehensive plans of wetland conservation could be improved in two methods. The first method is adding contents for those 0 point indicators. Many local comprehensive plans do not directly discuss the efforts of local governments, even if the local government has made some effort to conserve wetlands. This is reflected in a high frequency of 1-point scores for indicators. The second method is suggesting that if local comprehensive plans resulted in a change from 1-point indicators to 2-point indicators, the total scores of the plans would be significantly enhanced.
In order to improve the plans by the first method, local comprehensive plans need to incorporate more content about the current wetland status, wetland types and functionality, and local wetland maps and classification to the local comprehensive plans as factual basis. These elements are not commonly mentioned in the plans evaluated in this study. Adding the description of the federal policy “no net loss” or directly providing the definition of wetland are also examples to improve local comprehensive plans from those 1-point indicators to 2-point indicators.
The second method is to collaborate with wetland managers to specify the natural resources protection content to allow them to directly relate to wetland conservation. Many local comprehensive plans have integrated future land use and zoning with local environmental protection. These elements are not directly linked with wetland conservation. According to the related text in the local comprehensive plans, these efforts by local governments may protect local wetlands. The integration of wetland conservation into local comprehensive plans would be greatly improved by directly adding wetland conservation content into future land use chapters. Similarly, adding wetland conservation content into parks and open space chapters, as well as water resources sections of local plans could aid wetland conservation. Another example is the lack of conservation maps. Local comprehensive planners can add wetland locations into comprehensive land use maps as a method to improve the map relative score.
An excellent example is the comprehensive plan of the City of Lincoln and Lancaster County (LPlan 2040). This plan got a final score of 84.4% (0–100% scale), which means this plan get 2 points in almost every indicator. In other words, most of the indicator related contents are well addressed and described in this plan. The most direct example is two national policies, 404 clean water act and no net loss, which are discussed several times and linked with the local situation on both freshwater and saline wetlands in different plan sections. These two indicators are among the lowest scored indicators for other local comprehensive plans. By improving this part of the content can make a direct improvement reflected in the final score. Overall, by summarizing those local plans with high scores, we develop eight suggestions for improving wetland conservation in local integrated plans: (1) Add wetland maps in local plans; (2) Identify wetland conservation as a part of the natural system protection framework; (3) Regulate wetland conservation in land-use policies; (4) Include wetland conservation into land acquisition programs; (5) Provide guidance on best management practices dealing with wetland conservation; (6) Promote stakeholder collaborations for wetland conservation, such as joint approval procedures with state and federal agencies; (7) Provide education and outreach for developers, landowners, and residents to highlight the value of wetlands and the location of wetlands, and the activities dealing with wetlands; and (8) Take wetland conservation into the implementation mechanism, such as local financial support.
Conclusion
This study examined the integration of wetland conservation into local comprehensive plans. Counties in Nebraska have integrated wetland conservation into their local comprehensive plans more effectively than other two types of planning jurisdictions.
To address the first research question “How well do the cities, counties, and NRDs in Nebraska integrate wetland conservation into local comprehensive plans?” we demonstrated that local comprehensive plans in Nebraska do not pay enough direct attention toward wetland conservation, but wetland conservation in the U.S. was generally considered under the umbrella of environmental protection or natural resources conservation, as federal and state level wetland conservation plans, rules, policies are mostly coming from U.S. Environmental Protection Agency, U.S. Army Corps of Engineers, U.S. Fish and Wildlife Service, and U.S. Department of Agriculture – Natural Resources Conservation Service. The federal and state government guidelines for wetland conservation are not well integrated into local plans. There is also a wide range in the depth and quality of local wetland conservation plans. This study on local plans shows that different components of wetland conservation, focused on different tasks, are emphasized among different local plans. We developed a framework to categorize the wetland conservation content of local plans using indicators and sub-indicators. This framework will be useful not only for research, but also for organizing and developing local plans in the future.
To address the second research question “How can the integration of wetland conservation into local comprehensive plans be improved?” we reveal the massive gap in the integration of wetland conservation into local plans. Indicators with scores of 1 point indicate areas that can be quickly improved. We also considered the inaccuracy of evaluating a local government’s efforts to conserve wetlands solely based on wetland related indicators. Local governments contribute to wetland conservation, although the efforts are often part of other initiatives. Having this work explicitly addressed in local comprehensive plans would be advantageous. As the highest scored plan in this study, the City of Lincoln’s comprehensive plan can be a good model for other local comprehensive plans to improve their integration of wetland conservation.
This study represents the initial phase of research on the integration of wetland conservation into local comprehensive plans. We only focused on comprehensive plans in Nebraska. This study attempted to evaluate all the effective local comprehensive plans in Nebraska. The plans collected during this study were limited by accessibility issues and time limitations. We recommend caution in extrapolating results broadly. These limitations may create some ambiguity, which can be addressed in future studies using larger study areas and different sample selection strategies. The system developed in this study to evaluate plans is not perfect. Several plans with high scores may not actually have extensive wetland conservation content. In particular, several plans have a template-like paragraph that mentions many issues but does not seriously address these issues in the plan. In our scoring system, these kinds of plans have high scores, even though they do not strongly recognize wetland conservation.
Acknowledgments
This paper is supported by the U.S. Environmental Protection Agency’s Wetland Program Development Grants. The contents do not necessarily reflect the views and policies of the funding agencies and do not mention the trade names or commercial products that constitute endorsement or recommendation for use. The research team sincerely appreciates the valuable guidance and professional technical support from the U.S. Fish and Wildlife Service, the US Department of Agriculture-Natural Resources Conservation Service, the Rainwater Basin Joint Venture, and the Nebraska Game and Parks Commission. We really appreciate the anonymous reviewers for their precious time to carefully review the manuscript. Their valuable comments and constructive suggestions greatly help improve the quality of this paper.
Disclosure statement
No potential conflict of interest was reported by the author(s).
Additional information
Funding
References
- ASWM (Association of State Wetland Managers, Inc.). 2011. “WARPT: Wetlands-At-Risk Protection Tool.” Windham, ME: Association of State Wetland Managers, . Accessed 1 December 2017. https://www.aswm.org
- Berke, P., and D. Godschalk. 2009. “Searching for the Good Plan: A Meta-analysis of Plan Quality Studies.” Journal of Planning Literature 23 (3): 227–15. doi:10.1177/0885412208327014.
- Berke, P., D. Spurlock, G. Hess, and L. Band. 2013. “Local Comprehensive Plan Quality and Regional Ecosystem Protection: The Case of the Jordan Lake Watershed, North Carolina, USA.” Land Use Policy 31: 450–459. doi:10.1016/j.landusepol.2012.08.009.
- Berke, P. R., and S. P. French. 1994. “The Influence of State Planning Mandates on Local Plan Quality.” Journal of Planning Education and Research 13 (4): 237–250. doi:10.1177/0739456X9401300401.
- Brody, S. D. 2003. “Implementing the Principles of Ecosystem Management through Local Land Use Planning.” Population and Environment 24 (6): 511–540. doi:10.1023/A:1025078715216.
- Dahl, T. E. 1990. Wetlands Losses in the United States, 1780ʹs to 1980ʹs. Report to the Congress (No. PB-91-169284/XAB). St. Petersburg, FL (USA): National Wetlands Inventory.
- Dahl, T. E. 2011. Status and Trends of Wetlands in the Conterminous United States 2004–2009. Washington, DC: U.S. Department of Interior, Fish and Wildlife Service.
- Davenport, M. A., C. A. Bridges, J. C. Mangun, A. D. Carver, K. W. Williard, and E. O. Jones. 2010. “Building Local Community Commitment to Wetlands Restoration: A Case Study of the Cache River Wetlands in Southern Illinois, USA.” Environmental Management 45 (4): 711–722. doi:10.1007/s00267-010-9446-x.
- Davidson, N. C. 2014. “How Much Wetland Has the World Lost? Long-term and Recent Trends in Global Wetland Area.” Marine & Freshwater Research 65 (10): 934–941. doi:10.1071/MF14173.
- Dugan, P., and P. J. Dugan, Eds. 1990. Wetland Conservation: A Review of Current Issues and Required Action. Gland: IUCN.
- Finlayson, C. M. 2012. “Forty Years of Wetland Conservation and Wise Use.” Aquatic Conservation: Marine and Freshwater Ecosystems 22 (2): 139–143. doi:10.1002/aqc.2233.
- Finlayson, C. M., G. T. Davies, W. R. Moomaw, G. L. Chmura, S. M. Natali, J. E. Perry, N. Roulet, and A. E. Sutton-Grier. 2019. “The Second Warning to Humanity–providing a Context for Wetland Management and Policy.” Wetlands 39 (1): 1–5. doi:10.1007/s13157-018-1064-z.
- Fretwell, J. D. 1996. National Water Summary on Wetland Resources (Vol. 2425). Reston, VA, USA: US Government Printing Office.
- Gardner, R. C., S. Barchiesi, C. Beltrame, C. M. Finlayson, T. Galewski, I. Harrison, M. Paganini, et al. 2015. State of the World’s Wetlands and Their Services to People: A Compilation of Recent Analyses. Ramsar Briefing Note No. 7. Gland, Switzerland: Ramsar Convention Secretariat.
- Gillespie, J. 2018. “Wetland Conservation and Legal Layering: Managing Cambodia’s Great Lake.” The Geographical Journal 184 (1): 31–40. doi:10.1111/geoj.12216.
- Gürlük, S., and E. Rehber. 2006. “Evaluation of an Integrated Wetland Management Plan: Case of Uluabat (Apollonia) Lake, Turkey.” Wetlands 26 (1): 258–264. doi:10.1672/0277-5212(2006)26[258:EOAIWM]2.0.CO;2.
- Guyadeen, D. 2018. “Do Practicing Planners Value Plan Quality? Insights from a Survey of Planning Professionals in Ontario, Canada.” Journal of the American Planning Association 84 (1): 21–32. doi:10.1080/01944363.2017.1404486.
- Hu, S., Z. Niu, Y. Chen, L. Li, and H. Zhang. 2017. “Global Wetlands: Potential Distribution, Wetland Loss, and Status.” Science of the Total Environment 586: 319–327. doi:10.1016/j.scitotenv.2017.02.001.
- Jacob, C., and J. Dupras. 2021. “Institutional Bricolage and the Application of the No Net Loss Policy in Quebec: Can We Really Engender ‘Social Fit’for More Sustainable Land Use Planning?” Journal of Environmental Policy & Planning 23 (1): 114–129. doi:10.1080/1523908X.2020.1814129.
- Jia, H., H. Ma, and M. Wei. 2011. “Urban Wetland Planning: A Case Study in the Beijing Central Region.” Ecological Complexity 8 (2): 213–221. doi:10.1016/j.ecocom.2011.03.002.
- Kaiser, E. J., D. R. Godschalk, and F. S. Chapin. 1995. Urban Land Use Planning. Vol. 4. Urbana, IL: University of Illinois Press.
- Kingsford, R. T., A. Basset, and L. Jackson. 2016. “Wetlands: Conservation’s Poor Cousins.” Aquatic Conservation: Marine and Freshwater Ecosystems 26 (5): 892–916. doi:10.1002/aqc.2709.
- Kirwan, M. L., and J. P. Megonigal. 2013. “Tidal Wetland Stability in the Face of Human Impacts and Sea-level Rise.” Nature 504 (7478): 53–60. doi:10.1038/nature12856.
- Klemas, V. 2013. “Using Remote Sensing to Select and Monitor Wetland Restoration Sites: An Overview.” Journal of Coastal Research 29 (4): 958–970. doi:10.2112/JCOASTRES-D-12-00170.1.
- Krippendorff, K. 2011. “Computing Krippendorff’s Alpha-reliability.” Annenberg, PA. Accessed 1 December 2017. https://repository.upenn.edu/cgi/viewcontent.cgi?referer=https://link.springer.com/&httpsredir=1&article=1043&context=asc_papers
- Kusler, J. A. 2003. “A Guidebook for Local Governments: Wetlands and Watershed Management.” Berne, NY: Association of State Wetland Managers. Accessed 1 December 2017. https://www.csu.edu/cerc/researchreports/documents/GuideForLocalGovernmentsWetlandsWatershedManagement2003_000.pdf
- Kusler, J. A. 2006. “Common Questions: Local Government Wetland Protection Programs.” Berne, NY: Association of State Wetland Managers. Accessed 1 December 2017. https://www.aswm.org/pdf_lib/6_localgov_6_26_06.pdf
- LaGrange, T. 2015. “Wetland Program Plan for Nebraska.” Lincoln, NE: Nebraska Game and Parks Commission. Accessed 3 June 2019. https://outdoornebraska.gov/wp-content/uploads/2017/01/Wetland-Program-Plan_Nebraska_2015_Final.pdf
- LeGrange, T. 2005. “Guide to Nebraska’s Wetlands and Their Conservation Needs.” Nebraska Game and Parks Commission. Accessed 1 December 2017. https://outdoornebraska.gov/wp-content/uploads/2015/10/NebraskaWetlandsGuide_03182016.pdf
- Lyles, W., and M. Stevens. 2014. “Plan Quality Evaluation 1994–2012: Growth and Contributions, Limitations, and New Directions.” Journal of Planning Education and Research 34 (4): 433–450. doi:10.1177/0739456X14549752.
- Maltby, E. 1991. “Wetland Management Goals: Wise Use and Conservation.” Landscape and Urban Planning 20 (1–3): 9–18. doi:10.1016/0169-2046(91)90085-Z.
- Mitsch, W. J., and J. G. Gosselink. 2000. “The Value of Wetlands: Importance of Scale and Landscape Setting.” Ecological Economics 35 (1): 25–33. doi:10.1016/S0921-8009(00)00165-8.
- Nicholls, R. J. 2004. “Coastal Flooding and Wetland Loss in the 21st Century: Changes under the SRES Climate and Socio-economic Scenarios.” Global Environmental Change 14 (1): 69–86. doi:10.1016/j.gloenvcha.2003.10.007.
- Novitski, R. P., R. D. Smith, and J. D. Fretwell. 1996. “Wetland Functions, Values, and Assessment.” In National Summary on Wetland Resources. USGS Water Supply Paper 2425, edited by J. D. Fretwell, J. S. Williams, and P. J. Redman, 79–86. U.S. Dept. Interior, U.S: Geological Survey.
- Reis, V., V. Hermoso, S. K. Hamilton, D. Ward, E. Fluet-Chouinard, B. Lehner, and S. Linke. 2017. “A Global Assessment of Inland Wetland Conservation Status.” Bioscience 67 (6): 523–533. doi:10.1093/biosci/bix045.
- Scholz, G., J. Gordon, T. Huston, T. Keelan, B. Hanna, M. Shukert, O. Stahr, and R. Wozniak. 2002. “Nebraska Planning Handbook.” Accessed 10 January 2019. https://www.npza.org/docs/NebrPlanningHndbk.pdf
- Serran, J. N., and I. F. Creed. 2016. “New Mapping Techniques to Estimate the Preferential Loss of Small Wetlands on Prairie Landscapes.” Hydrological Processes 30 (3): 396–409. doi:10.1002/hyp.10582.
- Stevens, M. R., W. Lyles, and P. R. Berke. 2014. “Measuring and Reporting Intercoder Reliability in Plan Quality Evaluation Research.” Journal of Planning Education and Research 34 (1): 77–93. doi:10.1177/0739456X13513614.
- Tang, Z. 2008. “Integrating the Principles of Strategic Environmental Assessment into Local Comprehensive Land Use Planning.” Journal of Environmental Assessment Policy and Management 10 (2): 143–171. doi:10.1142/S1464333208003044.
- Tang, Z., J. Drahota, Q. Hu, and W. Jiang. 2018. “Examining Playa Wetland Contemporary Conditions in the Rainwater Basin, Nebraska.” Wetlands 38 (1): 25–36. doi:10.1007/s13157-017-0953-x.
- Tang, Z., X. Li, N. Zhao, R. Li, and E. F. Harvey. 2012. “Developing A Restorable Wetland Index for Rainwater Basin Wetlands in South-central Nebraska: A Multi-criteria Spatial Analysis.” Wetlands 32 (5): 975–984. doi:10.1007/s13157-012-0320-x.
- Tang, Z., Y. Li, Y. Gu, W. Jiang, Y. Xue, Q. Hu, T. LaGrange, A. Bishop, J. Drahota, and R. Li. 2016. “Assessing Nebraska Playa Wetland Inundation Status during 1985–2015 Using Landsat Data and Google Earth Engine.” Environmental Monitoring and Assessment 188 (12): 1–14. doi:10.1007/s10661-016-5664-x.
- Thomassey, G. 2007. “Protecting Michigan’s Wetlands: A Guide for Local Governments. Tip of the Mitt Watershed Council.” Accessed 3 June 2019. https://www.watershedcouncil.org/uploads/7/2/5/1/7251350/gapsanalysis-emmetco-web.pdf
- U.S. Fish and Wildlife Service (USFWS). 2006. “Status and Trends of Wetlands in the Conterminous United States 1998 to 2004.” Accessed 10 January 2019. https://www.fws.gov/wetlands/documents/Status-and-Trends-of-Wetlands-in-the-Conterminous-United-States-1998-to-2004.pdf
- U.S. Fish and Wildlife Service (USFWS). 2011. “Status and Trends of Wetlands in the Conterminous United States 2004 to 2009.” Accessed 10 January 2019. https://www.fws.gov/wetlands/Documents/Status-and-Trends-of-Wetlands-in-the-Conterminous-United-States-2004-to-2009.pdf
- USACE (Army Corps of Engineers). 1987. “Corps of Engineers Wetland Delineation Manual.” Technical Report Y-87-1 US Army Engineer Waterways Experiment Station Vicksburg, Mississippi
- USDA-NRCS (United States Department of Agriculture-Natural Resources Conservation Service). 2007. “Biology Technical Note.” Accessed 10 January 2019. https://www.nrcs.usda.gov/wps/portal/nrcs/in/people/employees/NRCS144P2_031093/
- USEPA (United States Environmental Protection Agency). 2016. “Wetland Functions and Values.” Accessed 10 January 2019. https://www.epa.gov/sites/production/files/201602/documents/wetlandfunctionsvalues.pdf
- Xu, T., B. Weng, D. Yan, K. Wang, X. Li, W. Bi, M. Li, X. Cheng, and Y. Liu. 2019. “Wetlands of International Importance: Status, Threats, and Future Protection.” International Journal of Environmental Research and Public Health 16 (10): 1818. doi:10.3390/ijerph16101818.
- Zhou, D., H. Zhang, and C. Liu. 2016. “Wetland Ecohydrology and Its Challenges.” Ecohydrology & Hydrobiology 16 (1): 26–32. doi:10.1016/j.ecohyd.2015.08.004.
- Zollitsch, B., J. Christie, and Association of State Wetland Managers. 2015. “Status and Trends Report on State Wetland Programs in the United States.” Windham, ME: Association of State Wetland Managers. Accessed 10 January 2019. https://www.epa.gov/nps/handbook-developing-watershed-plans-restore-and-protect-our-waters