
 ?Mathematical formulae have been encoded as MathML and are displayed in this HTML version using MathJax in order to improve their display. Uncheck the box to turn MathJax off. This feature requires Javascript. Click on a formula to zoom.
ABSTRACT
Many studies have shown that climatic and edaphic factors influence the variations in nitrogen isotopes (δ15N) in terrestrial ecosystems. However, the relative importance of co-varying climatic and edaphic controls on plant δ15N remains somewhat unclear. To address this issue, regional-scale plant (L. chinensis) and soil samples were collected along a longitudinal transect across the temperate grasslands in northern China. The influences of climatic and edaphic factors on the plant δ15N were disentangled using the variable importance in projection (VIP) approach. We found that the climatic and edaphic variables explained 52.4% and 31.2%, respectively, of the variation in plant δ15N. The mean annual precipitation (MAP), soil N, and mean annual temperature (MAT) were the most important variables, but the soil water content (SWC), aridity index (AI), and soil clay content were also important variables. The soil pH and soil C: N ratios were identified as unimportant variables. Furthermore, a high-performance model for simulating plant δ15N values was constructed based on the important variables (VIP > 0.8). Further investigations should focus on the effects of the interaction between the climatic and edaphic variables on the N cycles in the temperate grasslands to provide more reliable predictions of plant δ15N.
Introduction
Temperate grasslands are one of the most widely distributed ecosystems worldwide, and they play important roles in carbon (C) and nitrogen (N) sequestration and climate regulation (Conant et al. Citation2017; Zhou et al. Citation2020). Unfortunately, most of the world’s temperate grasslands, especially China’s semi-arid temperate grasslands, are currently being degraded by global warming and excessive human activities (An and Li Citation2015; Emadodin et al. Citation2021). Given changes in land use and the global climate, a better understanding of the spatial patterns of the ecosystem functions in semi-arid grasslands is urgently needed to enable sustainable management of these grasslands (Allan et al. Citation2015). Diverse lines of evidence suggest that ecosystem nitrogen (N) stoichiometry can serve as a focal indicator of ecosystem functions and nutrient limitations (Elser et al. Citation2007; LeBauer and Treseder Citation2008; Zhou et al. Citation2014). Therefore, elucidating the spatial pattern of the N cycling and the natural abundances of N isotopes (δ15N) in semi-arid grasslands is key for understanding ecosystem functions. It is well known that the variations in δ15N in ecosystems are controlled by the rates and isotopic compositions of the N inputs and outputs, as well as the internal N transformations occurring in the vegetation-soil systems. In general, in addition to biotic factors, climatic and edaphic factors, including temperature, precipitation, pH, soil C and N contents, and soil texture, can directly or indirectly affect the δ15N values of plants by affecting the N transformation and release (e.g., ammonification, nitrification, and denitrification) in ecosystems (Robinson Citation2001; Pardo et al. Citation2007; Craine et al. Citation2009; Liu and Wang Citation2009; Wu, Wang, Chen Citation2018; Zhao et al. Citation2020; Luo, Viscarra-Rossel, and Qian Citation2021). As a result, the δ15N signal of plant-soil systems has become an effective tool for understanding ecosystem N cycling, and it has been used as a proxy for climate and environment changes (Hobbie, Jumpponen, and Trappe Citation2005; Ann-Kathrin et al. Citation2011; Ariz et al. Citation2015; Craine et al. Citation2015a). However, the influences of various climatic and edaphic factors on plant δ15N are not fully understood, which limits the use of plant δ15N in inferring ecosystem N cycling and environmental changes at the regional and global scales.
To understand the factors controlling plant δ15N, numerous studies have been conducted to investigate the patterns of plant δ15N along environmental gradients. In most cases, it has been shown that plant δ15N values are negatively correlated with the mean annual precipitation (MAP) and positively correlated with the mean annual temperature (MAT) at the regional and global scales (Martinelli et al. Citation1999; Aranibar et al. Citation2004; Bai and Houlton Citation2009; Ma et al. Citation2012; Peri et al. Citation2012). Similar temperature/precipitation effects have also been found in studies conducted along altitude gradients (Mannel, Auerswald, and Schnyder Citation2007; Craine et al. Citation2009; Nel, Craine, and Cramer Citation2018). However, some studies have reported that plant δ15N values do not correlate with MAP and MAT along environmental gradients (Wang et al. Citation2014; Zhao et al. Citation2020). This indicates that although the δ15N -climate correlations for plants seem to be well established at different spatial scales, the climate-driven changes in the δ15N values of plants remain somewhat uncertain.
In addition to the influences of climatic factors, nonclimatic factors, such as plant types (species), edaphic variables, and land use changes (e.g., agriculture and grazing), may significantly affect plant δ15N (Yang et al. Citation2013; Craine et al. Citation2015b; Lv, Xu, and Gao Citation2021). For instance, in a natural ecosystem, the δ15N values differ considerably between plant species, i.e., by more than 3.2‰, e.g., between N2-fixing and non-N2-fixing plants, mycorrhizal and non-mycorrhizal plants, different photosynthetic plants, and plants of different genotypes (Hobbie, Jumpponen, and Trappe Citation2005; Kahmen, Wanek, and Buchman Citation2008). This means that if the δ15N values of multiple plant species are selected as a whole, the relationships between the plant δ15N and climatic and edaphic factors may be obscured, and incorrect results may even be obtained. Besides that, several researchers have also suggested that plant δ15N may be affected by edaphic factors, such as the soil N concentration, pH, and other soil variables (Menge et al. Citation2011; Yang et al. Citation2013; Craine et al. Citation2015a) because these variables can play important roles in controlling the N-cycling processes through their influences on microbial activity in terrestrial ecosystems (Butterbach-Bahl and Gundersen Citation2011; Tang et al. Citation2018). For example, soil water can promote mineralization and microbial nitrification when the soil is unsaturated and aerobic (Butterbach-Bahl and Gundersen Citation2011). The pH of the soil can affect internal N-cycling processes via its effects on microbial nitrification and denitrification, and it can control N loss by affecting NH3 volatilization (Peri et al. Citation2012; Mayor et al. Citation2014). The soil N content may regulate foliar δ15N values at different spatial scales (Craine et al. Citation2009). Furthermore, the soil texture has been demonstrated to influence N turnover by indirectly affecting other physicochemical properties of the soil (Kramer et al. Citation2003; Menge et al. Citation2011). Overall, previous studies conducted at different scales were very comprehensive and have greatly increased our understanding of the controls and patterns of plant δ15N in natural ecosystems. Nonetheless, our understanding of the patterns and controls on the δ15N values of plants is still limited to a certain extent due to the following two reasons. One limitation is our inadequate understanding of the extent to which individual soil variables regulate plants δ15N values because these soil variables jointly control the input and output of soil N and the overall isotopic fractionation through microbial decomposition (Craine et al. Citation2015b; Luo, Viscarra-Rossel, and Qian Citation2021). Additionally, previous studies have mainly focused on plant δ15N-climate relationships or the relationships between soil δ15N values and climatic variables (Wu, Wang, and Chen Citation2018; Zhao et al. Citation2020), and therefore, our understanding of the effects of edaphic factors on plant δ15N variations is less complete than that of the effects of climatic factors on plant δ15N variations along environmental gradients. Another limitation is that it is not very clear how co-varying climatic and edaphic factors independently influence the plant δ15N signatures of natural ecosystems. Luo et al. (Citation2015) reported that the climate not only directly but also indirectly (via its effects on soil variables) significantly affects plant δ15N values. Although many studies have been conducted to explore the impacts of various factors on plant δ15N at different scales, the relative effect of each variable on plant δ15N has seldom been separated from the overall effects of environmental variables. Due to the potential co-varying effects of climatic and edaphic factors on N isotopes and the complexity of N cycling in ecosystems (Luo, Viscarra-Rossel, and Qian Citation2021), we know little about the relative contributions of the various variables to the variations in plant δ15N values along environmental gradients. For example, the increase in plant δ15N with increasing MAT may also be caused by decreasing precipitation, and yet the degree to which variables can explain the variations in plant δ15N values is still uncertain due to the covariation of temperature and aridity. This is likely one of the major causes of the relatively low reliability of interpretations of ecosystem N cycles and environmental change based on plant δ15N values reported in previous studies. Consequently, it is imperative that we gain a better understanding of the factors controlling plant δ15N. In addition, most previous studies primarily used relatively simple bivariate regression or ordinary multiple regression to determine how climatic and edaphic variables influence plant δ15N values at different spatial scales. However, such analyses cannot separate the influences of climatic and edaphic variables on plant δ15N values on the regional scale due to the mutual correlations among the explanatory variables.
The goal of this study was to disentangle the relative importance of co-varying climate and soil factors in controlling the variance of plant δ15N at the regional scale. Based on a literature review, we hypothesize that distinct factors control the plant δ15N signature. (1) Climatic factors such as the MAP, MAT, and aridity index (AI) can exert stronger effects on plant δ15N than edaphic factors because the climate significantly affects the plant δ15N directly and indirectly by affecting soil variables. For example, soil N mineralization and nitrification are largely controlled by temperature and precipitation. In addition, (2) the model for predicting plant δ15N based on important explanatory variables has a higher reliability than that based on all of the explanatory variables since the reliability of the model is largely related to the relative equilibrium between the degrees of the importance of the independent variables. In this study, a framework of how climatic and edaphic factors influence plant δ15N was developed (). This framework is based on core theoretical assumptions. To test the above hypotheses, we collected plant (Leymus chinensis, a dominant perennial species with wide adaptability) and soil samples along a longitude transect across the temperate grasslands in northern China, and then, we determined the δ15N values and soil physicochemical properties of these samples. The variable importance in projection (VIP) method based on partial least squares (PLS) regression was used to analyze the contributions of the climatic and edaphic factors to the plant δ15N.
Figure 1. Conceptual framework of the climatic and edaphic factors influencing plant δ15N. The solid and dashed black arrows indicate positive and negative effects, respectively.
Materials and methods
Transect description
This study was conducted along an east-west transect across the temperate grasslands in Inner Mongolia, northern China (). The longitude of the transect ranged from 112°48′ to 121°58′E, and the latitude varied between 42°19′ and 43°98′N. The transect was predominantly characterized by a semi-arid and sub-humid continental monsoon climate, with a MAT of 1.71–7.10°C and a MAP of 154–446 mm. Along the entire transect, from east to west, the main vegetation types were temperate meadow grassland, typical temperate grassland, and temperate desert grassland, in which L. chinensis communities were widely and continuously distributed (Yang et al. Citation2007). The soils related to these three types of grassland were predominantly chernozem, chestnut soil, and eolian sand soil, which had the same substrate age and belonged to the Kastanozem group, according to the Food and Agriculture Organization soil classification system (Cheng et al. Citation2009; Gerasimova Citation2010; Luo et al. Citation2013). The pH values of the 0–20 cm soil layer varied between 6.2 and 8.5. With such climatic and edaphic gradients, this transect provides an ideal environment for exploring the variations in the plant δ15N values and their influencing factors.
Figure 2. Distribution of the sampling sites across the temperate grasslands in northern China.
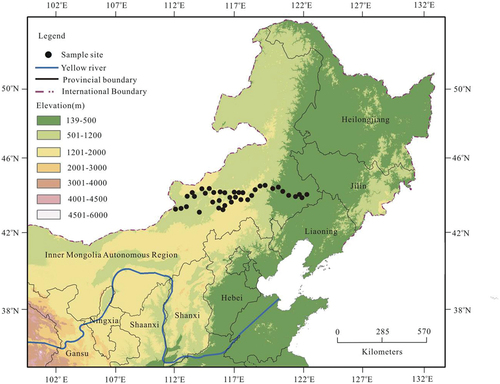
Sample collection
The 40 undisturbed sampling sites were selected 500–1000 m away from major roads along the transect across the temperate grasslands (). The longitude, latitude, and altitude of each sampling site were determined using a Global Positioning System (Thales, Arlington, USA). The detailed information about the sampling sites is summarized in . During the months of July and August in 2017, samples of a widely distributed plant (L. chinensis) and soil samples were collected from 40 sites along this transect. At each site, five 1 m × 1 m quadrats within an area of 10 m × 10 m were randomly established for soil and plant sampling. Within each quadrat, the aboveground parts of healthy L. chinensis individuals were harvested, and then, all of the harvested aboveground parts from each site were combined into one sample. All of the plant samples were air-dried and brought back to the laboratory for further treatment. During the sampling of the plants, three soil cores (2.5 cm diameter) were collected from each quadrat to a depth of 20 cm. A total of 15 soil cores were obtained from each site and were mixed thoroughly to create one composite sample. After removing the fine roots and other coarse materials from the soil samples, each composite sample was sieved through a 2.0 mm screen and divided into two parts. One part was stored in a thermal insulation box (at 4°C) until its physicochemical properties could be analyzed, and the other part was oven-dried at 65°C in preparation for isotopic analysis. Additionally, the soil water content (SWC) of the 0–20 cm depth interval was determined in each quadrat using a Digital Soil Moisture Meter (Soil tester-300), and then, the mean value of the five quadrats in each site was calculated.
Table 1. The general information about the sampling sites along the studied transect.
Laboratory measurements
The dried plant and soil samples were ground into a fine powder using a ball mill (NM200, Retsch, Haan, Germany), and then, the samples were stored in plastic bags. Following the method described by Harris, Horwath and Kesswl (Citation2001), the soil samples were washed using 150 ml of 0.5 M HCL to remove any carbonate before the soil organic carbon (SOC) content was analyzed. Another balled soil subsample without HCL treatment was used to analyze the total N (TN) concentration and N isotope ratios. The SOC and TN concentrations of the soil samples were determined using the Walkley-Black modified acid-dichromate ferrous sulfate titration method and the micro-Kjeldahl digestion method coupled with colorimetric determination, respectively. The soil C/N ratio was calculated as the quotient of the SOC and TN content. Approximately 3 mg of plant samples and 65 mg of soil samples were loaded into a capsule and analyzed to determine their δ15N values using a Finnigan DeltaPlusXP (Thermo Scientific, Waltham, MA, USA) coupled to an automatic elemental analyzer (Flash EA1112, Thermo Finnigan, Milan, Italy). The natural abundances of 15N and 14N (δ15N) are reported in per mil (‰) relative to atmospheric N2:
where Rsample is the (15N/14N) ratio of the sample, and Rstandard is the 15N/14N of atmospheric N2, which was used as a standard. The standard deviation of the repeated measurements was ±0.15‰ for the isotopic analysis.
In addition, the pH value of a subsample soil (10 g) with a dry soil-water ratio of 1:2 was measured using a pH meter (HI-9125, Hanna Instruments Inc., Woonsocket, RI). The clay component (< 2 μm) of another subsample was separated out using the ultrasonic energy method. The results of the particle size analysis are reported as the percentage by weight of the oven-dried soil.
Climate data for sample sites
The data for three climatic variables, including the MAT, MAP, and AI (the ratio of the potential evapotranspiration to the precipitation), for each sampling site, were obtained from the China Meteorological Data Service Center, Resource and Environment Science and Data Center, and from local weather stations. These climate data were the averages of observation data collected during a 30 year period. The data extraction was conducted using the spatial analysis tool in ArcGIS 10.2.
Statistical analyses
In this study, the VIP method was used to measure the degrees of importance of the climatic and edaphic controls on the plant δ15N and to identify the important controlling factors. The VIP method is a variable importance measurement technique based on PLS analysis. It combines multiple linear regression, principal component analysis, and correlation analysis, and it can eliminate potential collinearity among variables (Kano and Fujiwara Citation2013). It can be used to identify and screen independent variables with the most explanatory power for explaining the dependent variable based on their VIP scores and the absolute regression coefficient values of the PLS model. It also can reflect the relative importance of the independent variable to the dependent variable and can express the contributions of each independent variable to the dependent variable. The VIP value of the jth independent variable can be calculated as follows:
where k is the number of independent variables; and h is the total number of components; r is the correlation coefficient of the dependent variable (y) and the principal component () extracted from the relevant independent variables, which indicates the ability of
to explain y; and
is the weight of the jth independent variable in the ith principal component, which is usually determined according to the default settings of the software. As the ability of xj to explain y is conveyed through the principal component ti, the stronger the ability of ti to explain y, the greater the interpretability of xj to y, and the larger the VIP value. Thus, the VIP values were monitored as threshold indicators to determine the relative contributions of the individual independent variables. The results of previous studies suggest that the VIP threshold defining the most influential variables is between 0.83 and 1.21 (Mkhabela, Bullock, and Sapirstein Citation2018). In this study, if VIP
1.2, the variable was classified as one of the most important variables. If 0.8
VIP < 1.2, the variable was considered to be an important variable. These two types of variables should be retained in the PLS model. If VIP < 0.8, the variable was classified as unimportant and was excluded from the model. In addition, the relative effect was calculated based on the contribution (i.e., the VIP value) of each variable to the plant δ15N and its corresponding weight (i.e., the absolute value of the regression coefficient of each variable estimated using the PLS method). Then, the relative effect of each variable was scaled so that the sum of the influences of all of the variables was equal to 100. Furthermore, we also calculated the 95% confidence interval as the 2.5% and 97.5% quantiles of the relative influences via bootstrapping estimates, which serves as a measure of the uncertainty of the degrees of importance of the variables.
Additionally, to explore the relationships between the plant δ15N and the important climatic and soil variables, two PLS models were employed to model the plant δ15N as a function of the climatic and edaphic variables based on the same set of testing data. In the first model (PLS1), all of the climate and soil variables (excluding soil δ15N) mentioned earlier were used as the input, and the plant δ15N was the output. In the second model (PLS2), only the important variables with VIP values of > 0.8 were used as predictors of the plant δ15N. In addition, five accuracy indexes, namely, the cumulative interpretation rate in the X direction (R2X), the cumulative interpretation rate in the Y direction (R2Y), the cumulative prediction rate of the model (Q2), the mean square error (MSE), and the mean magnitude of the relative error (MMRE), were used as the prediction performance parameters. To accomplish this, the data samples were divided into two groups. The screening group contained 28 samples (marked with an asterisk in ) and was used to determine the importance of the variable and to screen the important variables. The testing group contained 12 samples (without an asterisk in ) and was mainly used to test the availability of the established prediction model. All of the statistical analyses were performed using the SIMCA-P 14.1 software (Sartorius-Umetric, Umeå, Sweden).
Results
Changes in plant δ15N and climatic and edaphic factors along the longitudinal transect
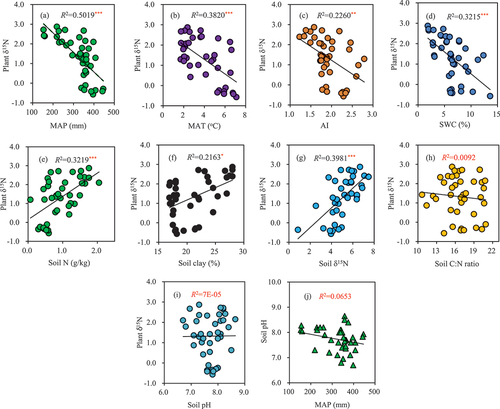
From west to east along the longitudinal transect, the plant δ15N, soil N concentration, soil clay content, and soil δ15N decreased ()); while the SWC, AI, MAP, and MAT increased ()). However, the soil C: N ratio and pH value did not exhibit an obvious trend along the transect ()). The linear regression and bivariate correlation analysis revealed that the plant δ15N was significantly negatively correlated with the MAP, MAT, AI, and SWC ()), and it was significantly positively correlated with the soil N content, soil clay content, and soil δ15N ()). In comparison, the plant δ15N was not correlated with the soil C: N ratio and soil pH ()). In addition, there was a negative linear correlation between the soil pH and MAP along the longitudinal transect, but this correlation was not significant ()).
Figure 3. Variations in the plant δ15N and climatic and edaphic factors along the longitudinal transect. *, **, and *** denote significance levels of P < 0.05, 0.01, and 0.001, respectively.
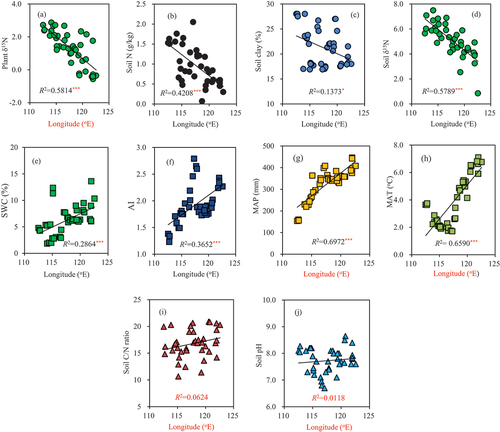
Figure 4. Correlations between the plant δ15N and the climatic and edaphic factors along the longitudinal transect. *, **, and *** denote significance levels of P < 0.05, 0.01, and 0.001, respectively.
Importance of climatic and edaphic variables
The PLS regression revealed that the three-latent variables explained 83.6% of the variations in the plant δ15N values, and 86.5% of the variability in the predictor variables. The VIP values () calculated based on the definition of the importance of the variable projection (EquationEq. (2(2)
(2) )) indicate that of the climatic factors, the MAP made the greatest contribution to the variability of the plant δ15N (VIP = 1.34), closely followed by the MAT (VIP = 1.23). Of the edaphic factors, the soil N content contributed the most significantly to the plant δ15N variation (VIP = 1.27), followed by the SWC (VIP = 1.03). According to the aforementioned criteria for determining the importance of a variable in explaining the variations in the plant δ15N in the temperate grasslands in northern China, the MAP, soil N concentration, and MAT were classified as the most important variables (VIP
1.2); while the SWC, AI, and soil clay content were classified as important variables (0.8
VIP < 1.2). The remaining two variables (soil pH and soil C: N ratio) were classified as unimportant variables (VIP < 0.8). For the same data, using one climate principal component that was selected according to the minimum requirement criterion (Worley and Powers Citation2016) as the predictor, the PLS model could explain 52.4% of the variations in the plant δ15N. When the first two soil principal components were included, an additional 31.2% of the variance of the plant δ15N could be explained (), of which the first principal component of the soil variables alone explained 27.6% of the variance of the plant δ15N. It should be noted that the fitted model in this study underestimated the high plant δ15N values and overestimated the low plant δ15N values (). This bias was probably due to the interferences of the unimportant independent variables in the model.
Figure 5. The performance of the PLS model considering the soil variables (green circles) and not considering the soil variables (red circles) when explaining the variations in the plant δ15N values. The black dashed line is the 1:1 line, and the green and red lines are the trend lines with and without the soil variables as predictors, respectively.
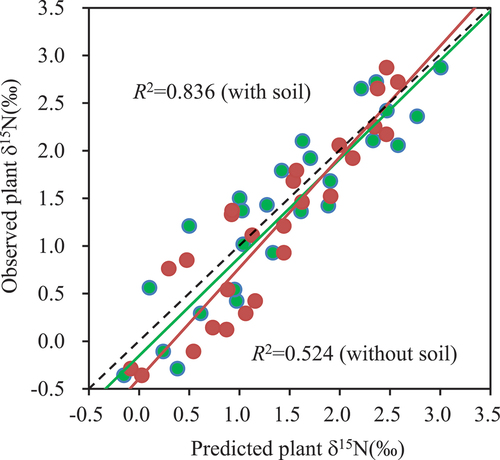
Table 2. Variable importance in projection (VIP) values and regression coefficients (RCs) for plant δ15N based on the PLS-VIP method.
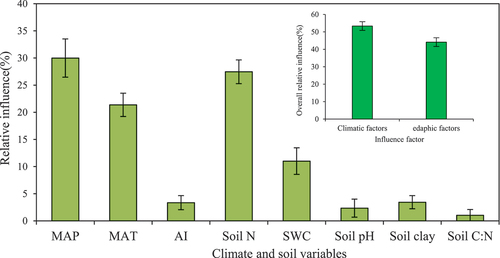
As is shown in , without considering the other factors, the overall relative effect of the climatic variables on the plant δ15N was significantly larger than that of the edaphic variables (54.72% vs. 45.29%). For a single variable, we found that the relative effect of the MAP was the largest among all of the variables, accounting for 29.99% of the overall influence. The soil N content was the second most important, accounting for 27.47% of the total influence of all of the variables, followed by the MAT (21.38%), SWC (11.01%), and soil clay content (3.44%). The relative influences of the remaining three variables (i.e., AI, soil pH, and soil C: N ratio) were marginal compared to those of the five variables mentioned above, and together these three variables accounted for less than 7.0% of the overall influence of all of the climatic and edaphic variables.
Figure 6. The relative influences of the climatic and edaphic variables on the plant δ15N.
Verification of the relationships between the plant δ15N and the important climate and soil variables
and show that model PLS2 had a better prediction than model PLS1. The predicted values of model PLS2 were closer to the observed values than those of model PLS1, with cumulative explained variances of R2X = 0.832, R2Y = 0.954, and Q2 = 0.872. In addition, we also found that the MSE and MMRE of model PLS2 were lower than those of model PLS1 (). These results demonstrate that model PLS2, which was constructed using the important independent variables, is more accurate than the conventional model PLS1 in terms of their prediction performances.
Figure 7. Actual and predicted values of the testing samples based on different models (unit: ‰).
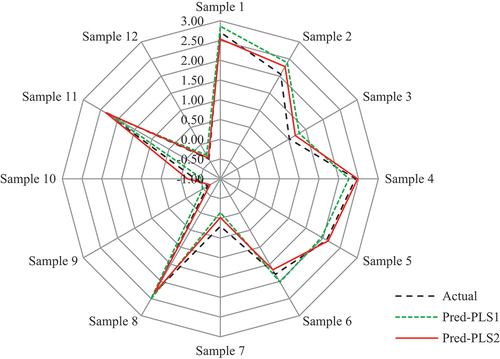
Table 3. Comparison of prediction accuracies of models PLS1 and PLS2 for testing samples.
Discussion
Importance of climatic controls on plant δ15N
Many studies have explored the influences of various climatic factors on the δ15N values of terrestrial plants on different spatial scales (Amundson et al. Citation2003; Cheng et al. Citation2009; Craine et al. Citation2015a). However, few scholars have paid particular attention to the relative importance of the effect of a climatic factor on the plant δ15N along an environmental gradient. In this study, the relative influences of the climatic variables accounted for approximately 54.72% of the total influence of all of the relevant variables on the plant δ15N, which demonstrates that the climatic factors exerted a significant control on the plant δ15N. This result supports the results of previous regional-scale studies, i.e., climate variables can explain much of the variations in plant δ15N (Yang et al. Citation2013; Craine et al. Citation2015b). In particular, the MAP was the most important climatic determinant of the plant δ15N in the temperate grasslands in northern China because it had the largest relative impact (). The strong negative effect of precipitation on the plant δ15N values () along the longitudinal transect is consistent with reports on global and other regional scales (Schulze et al. Citation1999; Brenner et al. Citation2001; Swap et al. Citation2004; Cheng et al. Citation2009; Craine et al. Citation2009; Liu et al. Citation2010; Ma et al. Citation2012). The above relationship can be explained by the indirect effect of precipitation on the soil δ15N and plant root development. First, precipitation can enrich soil N with 15N in temperate grassland ecosystems by influencing NH3 volatilization. Generally, precipitation will affect the leaching of alkaline cations in the soil, so it controls the pH value of the topsoil. According to our analysis, there was a negative correlation between the soil pH and the MAP along the transect ()). Due to this, soils in arid and semi-arid ecosystems usually have high pH values. It is well known that a higher pH value in the topsoil layer can significantly accelerate the volatilization of NH3, resulting in high soil δ15N values (Handley et al. Citation1999; Murphy and Bowman Citation2009; Craine et al. Citation2015b). Because of the dependence of plant δ15N on soil δ15N ()), the δ15N values of the plants decreased as the precipitation increased along the entire transect. Second, plant species in arid and semi-arid environments have deeper roots that can obtain deeper soil N resources, which are usually enriched in 15N.
In addition to the MAP, we found that the MAT was also an important climate variable controlling the δ15N values of the plant. However, it should be noted that in this study, the MAT had a negative impact on the plant δ15N () along the transect, which is contrary to previous findings that the plant δ15N is positively correlated with the MAT at the global scale (Martinelli et al. Citation1999; Amundson et al. Citation2003; Craine et al. Citation2009; Kang et al. Citation2011). Moreover, several studies have also shown that the plant δ15N is not linearly correlated with temperature (Wang et al. Citation2014; Craine et al. Citation2015b; Chen Citation2018). These conflicting results could be due to three reasons. First, as was previously above, in the temperate grassland ecosystems in northern China, precipitation is not only the most important limiting factor that determines plant production, N absorption, and assimilation, but it is also the most important factor controlling the variations in the plants δ15N values (Chen and Wang Citation2000; Wang et al. Citation2014). Although increasing the temperature can accelerate 14N loss via nitrobacteria and result in positive soil and plant δ15N values, due to the synchronization of rain and heat in the eastern part of the transect ()–(h)), the precipitation can contribute more negative δ15N values to the plants in this region, which may conceal the positive correlation between the plant δ15N and temperature to a certain extent (Liu and Wang Citation2009). Moreover, the decrease in the MAT along the western part of the transect ()) further intensifies the negative correlation between the plant δ15N and temperature along the entire transect. Consequently, the coupled effect of these two factors may lead to a negative correlation between the plant δ15N and MAT. Second, the negative correlation between the plant δ15N and temperature is likely related to the differences in the N deposition in the eastern and western parts of the transect. Yang et al. (Citation2007) reported that the eastern part of the transect has had a higher amount of N deposition than the western part in the past few decades. For example, the annual N deposition rate in Tongliao in the eastern part of the transect can be as high as 11 kg N ha−1 year−1, while the annual N deposition rate in Xilinhot in the western part of the transect is only 5 kg N ha−1 year−1. This intensified N deposition is likely to shift the N cycle into an unsteady state and to significantly change the pattern of the 15N abundance in the grassland ecosystem since the δ15N values of deposited N can vary from −10‰ to 5‰ (Handley et al. Citation1999). It has been reported that an increase in temperature can inhibit the absorption of N by L. chinensis in temperate grasslands and can significantly reduce the foliar N concentration, thus leading to a negative correlation between the plant δ15N and N deposition (Li Citation2015). Since the N deposition and temperature exhibited similar decreasing trends along the east-west transect in this study, the plant δ15N along this N deposition gradient may decrease with increasing MAT. An alternative explanation for the decrease in the plant δ15N with increasing temperature is that response of some parameters (e.g., nitrification and N loss) to elevated N deposition may be temporarily suppressed when the sampling sites along the N deposition gradient are not N saturated (Pardo et al. Citation2007). Although the exact reasons for the obvious negative correlation between the plant δ15N and MAT along the transect, which is not consistent with the results of other studies, are yet to be explored, the difference in the N deposition is likely one of the causes. Third, the relatively narrow temperature range (MAT: 1.71–7.10°C) along this transect, compared to those in previous studies, may cause this inconsistency. Shifts in the N cycling from organic or ammonium-dominated status to nitrate-dominated status have been hypothesized as a potential control of the plant and soil δ15N values (Amundson et al. Citation2003; Sun et al. Citation2010). Accordingly, it is possible that the relatively narrow range of the MAT along the studied transect is insufficient to cause a large shift in the N dynamics. This possibility is supported by the relationship between the variations in the plant δ15N and the MAP being stronger than that between the plant δ15N and the MAT ()–(b)).
Moreover, the inconsistency between the above results may also be related to the difference in the 15N abundances of the different plant species (Swap et al. Citation2004; Liu and Wang Citation2010). As far as we know, non-environmental variables, especially plant species, can substantially influence an ecosystem’s 15N abundance, and the differences between the δ15N values of plant species can be greater than 3.20‰ (Martinelli et al. Citation1999; Kahmen, Wanek, and Buchman Citation2008). The differences in the plant δ15N values of different plant species have been confirmed in the northeastern United States (Pardo et al. Citation2007) and the agro-pasture area in northern China (Chen Citation2018; Liu et al. Citation2018; Zhang, Chen, and Chen Citation2020). For example, in the farming-pasture ecotone in northern China, the δ15N of Asiatic plantain has been found to be positively correlated with temperature, while the δ15N of Artemisia absinthium has been found to be significantly negatively correlated with temperature (Chen Citation2018; Liu et al. Citation2018). In this study, we only sampled one main plant species that grew along the entire transect, which largely separated the effect of the plant species on the foliar 15N abundance from the influences of the climate and soil factors. However, in some previous regional-scale studies, the N isotopes of many plant species were studied as an integral part of the investigation (Bai and Houlton Citation2009, Citation2009; Ma et al. Citation2012). Therefore, the impact of interspecies differences may modify the unified and positive correlation between the plant δ15N and temperature and may even result in a negative correlation (Pardo et al. Citation2007; Chen Citation2018; Liu et al. Citation2018).
For the climate variable AI, although its VIP value was greater than 0.8, its relative impact was only 3.35% (), so it was less important in determining the plant δ15N. This may be due to the narrow range of AI values, that is, the AI only varied from 1.23 in the eastern part of the transect to 2.79 in the western part of the transect.
Importance of edaphic controls on plant δ15N
Soil factors may directly or indirectly affect dynamic N processes (e.g., the N input-output balance and N transformation) by influencing microbial activity and the accessibility of N to microbes and thereby the plant δ15N values (Menge et al. Citation2011; Wang et al. Citation2014). In this study, the overall relative effect of the edaphic variables on the plant δ15N was 45.29%, and the first two soil principal components explained 31.2% of the variance of the plant δ15N. This illustrates that the edaphic factors should be taken into account in explaining the variations in plant δ15N values. For example, the SWC, which was the second most important contributor of the edaphic factors () and accounted for 11.01% of the total explanatory variance (), exerted a significant effect on the soil aeration conditions, which affect the rates of N mineralization and NH3 volatilization, as well as the microbial decomposition of organic matter and thereby the soil and plant δ15N (Butterbach-Bahl and Gundersen Citation2011). We argue that the negative δ15N-SWC relationship was caused by two reasons. First, in this regional-scale study, the utilization efficiency of the soil N by plants may have increased with increasing soil moisture along the transect, which resulted in more 15N-depleted soil, thus causing the soil δ15N values to be lower. Because there was a close positive correlation between the plant δ15N and soil δ15N ()), the plant δ15N was negatively correlated with the SWC. However, in the relatively dry sites where the vegetation was thin, the net loss of N through NH3 volatilization was far more likely to occur, which led to enrichment of the soil N in 15N and an increase in the plant δ15N (Frank, Evans, and Tracy Citation2004; Chang et al. Citation2009). Second, the soil δ15N often increases due to decomposition of soil organic matter. As the SWC increases, the incomplete decomposition of plant litter may bring more enriched 14N organic matter into the soil N pool, thus causing more negative plant δ15N values (Bai and Houlton Citation2009; Liu and Wang Citation2009).
Compared with the SWC, the soil N content was a more important factor controlling the plant δ15N (), and its relative influence explained approximately 27.47% of the variations in the plant δ15N (). This indicates that the plant δ15N was more sensitive to changes in the soil N content than to changes in the other soil-related variables along the transect. The reason for this is that the plant δ15N is closely related to the TN content of the leaves, which is closely related to the soil N content (Craine et al. Citation2009; Yang et al. Citation2013). The positive and indirect effect of the soil N content on the plant δ15N may be related to climate-induced changes in the N availability for plant growth. In this study, precipitation was considered to be the most important factor regulating plant growth and the soil nutrient status (Hobbie, Macko, and Williams Citation2000; Falkengren-Grerup et al. Citation2004; Lü et al. Citation2012). Due to the decrease in precipitation from east to west along the transect ()), the microbial activity and soil N availability may have been greater in the warm and wet sites than in the cold and dry sites (Luo et al. Citation2015). Under high N availability conditions, isotopically depleted N is preferentially lost from the soil through NH3 volatilization, denitrification, and leaching, which leads to 15N enrichment in the soil and a subsequent increase in the plant δ15N.
The plant δ15N slightly increased as the soil clay content increased along the transect ()). Although the soil clay content was an important variable (VIP > 0.8), it was less important in determining the plant δ15N, and its relative effect was only 3.44% (). The increase in the plant δ15N with increasing clay content may have been driven by its indirect effects on the soil moisture and oxygen concentration, and the subsequent effects on the loss of gaseous N from the soil. Butterbach-Bahl and Gundersen (Citation2011) reported that the loss of gaseous N from fine-textured soils can be expected to be higher due to the more frequent stimulation of the predominantly anaerobic process of denitrification. Subsequently, this large gaseous N loss may lead to a larger δ15N value in fine-textured soils because of the strong potential effects on 15N/14N fractionation.
The soil pH and C/N ratio had insignificant effects on the plant 15N abundance compared with the other edaphic variables along the transect. Our analyses revealed that the soil pH and C/N ratio together only explained approximately 3.37% of the total variations in the plant δ15N (), and their VIP values were less than 0.8 (), which indicates that the soil pH and C/N ratio did not exert significant effects on the plant δ15N. This phenomenon may be due to the relatively uniform soil pH values and the fluctuating soil C/N ratios along the transect ()–(j)). Nevertheless, we cannot speculate that the lack of obvious trends in the plant δ15N values with the soil pH and C/N ratio ()–(i)) indicates that there was no significant variation in the N cycling because the soil pH values and C/N ratios along the transect were high enough for substantial gaseous N loss to occur via NH3 volatilization (Butterbach-Bahl and Gundersen Citation2011; Yang et al. Citation2013). Therefore, the soil C/N ratio and soil pH are still important drivers of the N cycle at the regional scale.
Limitations and conclusions
Nonetheless, there are still some limitations. First, some of the soil properties, especially the chemical variables such as the soil pH, may actively respond to external environmental changes. Treating such variables as constant may lead to a biased estimation of the variable’s importance if the variable exhibits marked temporal variation. Second, the transect selected in this study was relatively narrow (approximately 1200 km), and whether some relationships between the plant δ15N and explanatory variables are universal needs to be verified further. Third, although the edaphic factors seem to be individual controls on the plant δ15N, the climate may have an effect on those edaphic factors and thus on the plant δ15N. Therefore, to better understand the environmental factors controlling the plant δ15N dynamics, future research should expand the transect range and collect data from more sites to address the above discussed limitations at the regional scale. In addition, the effects of the interactions between the climatic and edaphic variables on the ecological N cycles in temperate grasslands should be investigated. This will be important for eliminating the uncertainty in the impacts of the environmental factors on the plant δ15N and providing more robust predictions based on the roles of the various factors in the plant δ15N dynamics.
In summary, we investigated the relative degrees of importance of the climatic and edaphic factors regulating the plant δ15N along a transect across the temperate grasslands in northern China. The results of this study have important implications for understanding the mechanisms by which the plant δ15N changes. We concluded that compared with the edaphic factors, the climatic factors investigated in this study explained more of the variation in the plant δ15N along the transect. In terms of the climatic factors, the MAP exerted a first-order control on the variability of the plant δ15N, followed by the MAT and AI. For the edaphic factors, the soil N content exerted the most significant control on the plant 15N abundance, followed by the SWC, soil clay content, soil pH, and C: N ratio. These findings provide important information about the responses of the ecosystem’s N cycle to climatic and edaphic changes in the temperate grasslands in northern China. Moreover, a high-performance model for predicting the plant δ15N was created using the important independent variables (VIP > 0.8).
Highlights
The relative importance of climatic and edaphic controls on plant δ15N was systematically studied across the temperate grasslands in northern China.
The influences of climatic and edaphic factors on the plant δ15N were disentangled using the VIP approach.
Compared with the edaphic factors, the climatic factors explained more of the variation in the plant δ15N along the transect.
The important information about the responses of the ecosystem’s N cycle to climatic and edaphic changes was provided in the temperate grasslands in northern China.
Declaration of conflict interest statement
The authors declare that they have no known competing financial interests or personal relationships that could have appeared to influence the work reported in this paper.
Acknowledgments
This work was supported by the Natural Science Foundation of Hunan Province (grant number 2020JJ4296). The authors would like to thank the editors and the anonymous reviewers for their valuable comments and suggestions on this paper. We also thank LetPub (www.letpub.com) for its linguistic assistance during the preparation of this manuscript.
Disclosure statement
No potential conflict of interest was reported by the author(s).
Correction Statement
This article has been corrected with minor changes. These changes do not impact the academic content of the article.
Additional information
Funding
References
- Allan, E., P. Manning, F. Alt, J. Binkenstein, S. Blaser, N. Blüthgen, S. Böhm, et al. 2015. “Land Use Intensification Alters Ecosystem Multifunctionality via Loss of Biodiversity and Changes to Functional Composition.” Ecology Letters 18 (8): 834–15. doi:10.1111/ele.12469.
- Amundson, R., A. T. Austin, E. A. G. Schuur, K. Yoo, V. Matzek, C. Kendal, A. Uebersax, D. Brenner, and W. T. Baisden. 2003. “Global Patterns of the Isotope Composition of Soil and Plant Nitrogen.” Global Biogeochemical Cycles 17 (1): 1031–1035. doi:10.1029/2002GB001903.
- An, H., and G. Q. Li. 2015. “Effects of Grazing on Carbon and Nitrogen in Plants and Soils in a Semi-arid Desert Grassland, China.” Journal of Arid Land 7 (3): 341–349. doi:10.1007/s40333-014-0049-x.
- Ann-Kathrin, S., Z. Michael, B. Björn, S. Gulyás, U. Hambach, S. B. Marković, P. Sümegi, and T. Scholten. 2011. “The Late Quaternary Loess Record of Tokaj, Hungary: Reconstructing Palaeoenvironment, Vegetation and Climate Using Stable C and N Isotopes and Biomarkers.” Quaternary International 240 (1–2): 52–61. doi:10.1016/j.quaint.2010.10.009.
- Aranibar, J. N., L. Otter, S. A. Macko, C. J. W. Feral, H. E. Epstein, P. R. Dowty, F. Eckardt, H. H. Shugart, and R. J. Swap. 2004. “Nitrogen Cycling in the Soil-plant System along a Precipitation Gradient in the Kalahari Sands.” Global Change Biology 10 (3): 359–373. doi:10.1111/j.1365-2486.2003.00698.x.
- Ariz, I., C. Cruz, T. Neves, J. J. Irigoyen, C. Garcia-Olaverri, S. Nogués, P. M. Aparicio-Tejo, and I. Aranjuelo. 2015. “Leaf δ15N as a Physiological Indicator of the Responsiveness of N2-fixing Alfalfa Plants to Elevated CO2 Temperature and Low Water Availability.”Frontiers in Plant Science 6: 1–10. doi:10.3389/fpls.2015.00574.
- Bai, E., and B. Z. Houlton. 2009. “Coupled Isotopic and Process-based Modeling of Gaseous Nitrogen Losses from Tropical Rain Forests.” Global Biogeochemical Cycles 23 (2): 269–277. doi:10.1029/2008GB003361.
- Brenner, D. L., R. Amundson, W. T. Baisden, C. Kendall, and J. Harden. 2001. “Soil N and 15N Variation with Time in a California Annual Grassland Ecosystem.” Geochimica et Cosmochimica Acta 65 (22): 4171–4186. doi:10.1016/S0016-7037(01)00699-8.
- Butterbach-Bahl, K., and P. Gundersen. 2011. “Nitrogen Processes in Terrestrial Ecosystems.” University of Reading 43: 99–125. doi:10.1017/CBO9780511976988.009.
- Chang, G. G., P. V. McCormick, S. Newman, and E. M. Elliott. 2009. “Isotopic Indicators of Environmental Change in a Subtropical Wetland.” Ecological Indicators 9 (5): 825–836. doi:10.1016/j.ecolind.2008.09.015.
- Chen, C. J. 2018. “The Effects of Environmental Factors and Leaf Mineral Elements on Plant or Soil Nitrogen Isotope Composition.” Doctoral Dissertation of China Agricultural University, In Chinese 94–100. Beijing: China Agricultural University Press.
- Chen, Z. Z., and S. P. Wang. 2000. Typical Grassland Ecosystems of China. Beijing: Science Press. In Chinese. 9–23.
- Cheng, W. X., Q. S. Chen, Y. Q. Xu, X. Han, and L. Li. 2009. “Climate and Ecosystem 15N Natural Abundance along a Transect of Inner Mongolian Grasslands: Contrasting Regional Patterns and Global Patterns.” Global Biogeochemical Cycles 23 (2): 1–11. doi:10.1029/2008GB003315.
- Conant, R. T., C. E. P. Cerri, B. B. Osborne, and K. Paustian. 2017. “Grassland Management Impacts on Soil Carbon Stocks: A New Synthesis.” Ecological Applications 27 (2): 662–668. doi:10.1002/eap.1473.
- Craine, J. M., E. N. J. Brookshire, M. D. Cramer, N. J. Hasselquist, K. Koba, E. Marin-Spiotta, and L. Wang. 2015a. “Ecological Interpretations of Nitrogen Isotope Ratios of Terrestrial Plants and Soils.” Plant Soil 396 (1–2): 1–26. doi:10.1007/s11104-015-2542-1.
- Craine, J. M., A. J. Elmore, M. P. M. Aidar, M. Bustamante, T. E. Dawson, E. A. Hobbie, A. Kahmen, et al. 2009. “Global Patterns of Foliar Nitrogen Isotopes and Their Relationships with Climate, Mycorrhizal Fungi, Foliar Nutrient Concentrations, and Nitrogen Availability.” New Phytologist 183 (4): 980–992. doi:10.1111/j.1469-8137.2009.02917.x.
- Craine, J. M., A. J. Elmore, L. Wang, L. Augusto, W. T. Baisden, E. N. J. Brookshire, and M. D. Cramer. 2015b. “Convergence of Soil Nitrogen Isotopes across Global Climate Gradients.” Scientific Reports 5 (1): 8280–8287. doi:10.1038/srep08280.
- Elser, J. J., M. E. S. Bracken, E. E. Cleland, D. S. Gruner, W. S. Harpole, H. Hillebrand, J. T. Ngai, E. W. Seabloom, J. B. Shurin, and J. E. Smith. 2007. “Global Analysis of Nitrogen and Phosphorus Limitation of Primary Producers in Freshwater Marine and Terrestrial Ecosystems.”Ecology Letters 10 (12): 1135–1142. doi:10.1111/j.1461-0248.2007.01113.x.
- Emadodin, I., D. E. F. Corral, T. Reinsch, K. Christof, and F. Taube. 2021. “Climate Change Effects on Temperate Grassland and Its Implication for Forage Production: A Case Study from Northern Germany.” Agriculture 11 (3): 232. doi:10.3390/agriculture11030232.
- Falkengren-Grerup, U., A. Michelsen, M. O. Olsson, C. Quarmby, and D. Sleep. 2004. “Plant Nitrate Use in Deciduous Woodland: The Relationship between Leaf N, N-15 Natural Abundance of Forbs and Soil N Mineralization.” Soil Biology & Biochemistry 36 (11): 1885–1891. doi:10.1016/j.soilbio.2004.05.009.
- Frank, D. A., R. D. Evans, and B. F. Tracy. 2004. “The Role of Ammonia Volatilization in Controlling the Natural 15 N Abundance of a Grazed Grassland.” Biogeochemistry 68 169–178. doi:10.1023/B:BIOG.0000025736.19381.91
- Gerasimova, M. I. 2010. “Chinese Soil Taxonomy: Between the American and the International Classification Systems.” Eurasian Soil Science 43 (8): 945–949. doi:10.1134/S1064229310080120.
- Handley, L. L., A. T. Austin, D. Robinson, C. M. Scrimgeour, J. A. Raven, T. H. E. Heaton, S. Schmidt, and G. R. Stewart. 1999. “The 15N Natural Abundance (δ15N) of Ecosystem Samples Reflects Measures of Water Availability.” Australian Journal of Plant Physiology 26: 185–199. doi:10.1071/PP98146.
- Harris, D., W. R. Horwath, and C. V. Kesswl. 2001. “Acid Fumigation of Soil to Remove Carbonates Prior to Total Organic Carbon or Carbon-13 Isotope Analysis.” Soil Science Society of America Journal 65 (6): 1853–1856. doi:10.2136/sssaj2001.1853.
- Hobbie, E. A., A. Jumpponen, and J. Trappe. 2005. “Foliar and Fungal 15N:14N Ratios Reflect Development of Mycorrhizae and Nitrogen Supply during Primary Succession: Testing Analytical Models.” Oecologia 146 (2): 258–268. doi:10.1007/s00442-005-0208-z.
- Hobbie, E. A., S. A. Macko, and M. Williams. 2000. “Correlations between Foliar δ15N and Nitrogen Concentrations May Indicate Plant-mycorrhizal Interactions.” Oecologia 122 (2): 273–283. doi:10.1007/PL00008856.
- Houlton, B. Z., D. M. Sigman, E. A. Schuur, and L. O. Hedin. 2007. “A Climate-driven Switch in Plant Nitrogen Acquisition within Tropical Forest Communities.” PNAS 104: 8902–8906. doi:10.1073/pnas.060993510421.
- Kahmen, A., W. Wanek, and N. Buchman. 2008. “Foliar δ15N Values Characterize Soil N Cycling and Reflect Nitrate or Ammonium Preference of Plants along a Temperate Grassland Gradient.” Oecologia 156 (4): 861–870. doi:10.1007/s00442-008-1133-8.
- Kang, H. Z., C. J. Liu, W. J. Yu, L. L. Wu, D. M. Chen, X. Sun, X. P. Ma, H. B. Hu, and X. L. Zhu. 2011. “Variation in Foliar δ15N among Oriental Oak (Quercus Variabilis) Stands over Eastern China: Patterns and Interactions.” Journal of Geochemical Exploration 110 (1): 8–14. doi:10.1016/j.gexplo.2011.02.002.
- Kano, M., and K. Fujiwara. 2013. “Virtual Sensing Technology in Process Industries: Trends and Challenges Revealed by Recent Industrial Applications.” Journal of Chemical Engineering of Japan 46 (1): 1–17. doi:10.1252/jcej.12we167.
- Kramer, M. G., P. Sollins, R. S. Sletten, and P. K. Swart. 2003. “N Isotope Fractionation and Measures of Organic Matter Alteration during Decomposition.” Ecology 84 (8): 2021–2025. doi:10.1890/02-3097.
- LeBauer, D. S., and K. K. Treseder. 2008. “Nitrogen Limitation of Net Primary Productivity in Terrestrial Ecosystems Is Globally Distributed.” Ecology 89 (2): 371–379. doi:10.1890/06-2057.1.
- Li, B. 2015. “Effects of Temperature Rise and Nitrogen Deposition on Physiological and Ecological Characteristics of Leymus Chinensis Population in Songnen Grassland.” Doctoral Dissertation of Northeast Normal University, In Chinese 80–83. Changchun: Northeast Normal University Press.
- Liu, W. G., and Z. Wang. 2009. “Nitrogen Isotopic Composition of Plant-soil in the Loess Plateau and Its Responding to Environmental Change.” Chinese Science Bulletin 54: 272–279. doi:10.1007/s11434-008-0442-y.
- Liu, X. Z., and G. A. Wang. 2010. “Measurements of Nitrogen Isotope Composition of Plants and Surface Soils along the Altitudinal Transect of the Eastern Slope of Mount Gongga in Southwest China.” Rapid Communications in Mass Spectrometry 24 (20): 3063–3071. doi:10.1002/rcm.4735.
- Liu, X. Z., G. A. Wang, J. Z. Li, and Q. Wang. 2010. “Nitrogen Isotope Composition Characteristics of Modern Plants and Their Variations along an Altitudinal Gradient in Dongling Mountain in Beijing.” Science in China Series D: Earth Sciences 53 (1): 128–140. doi:10.1007/s11430-009-0175-z.
- Liu, X. Z., Y. Zhang, Q. Su, Z. G. Li, T. Feng, and Y. Song. 2018. “Gradient Variation of δ15N Values in Herbs and Its Indication to Environmental Information in the Agro-pastoral Ecotone of North China.”Journal of University of Chinese Academy of Sciences 35 (6) 749–760 In Chinese
- Lü, X. T., D. L. Kong, Q. M. Pan, M. E. Simmons, and X. G. Han. 2012. “Nitrogen and Water Availability Interact to Affect Leaf Stoichiometry in a Semi-arid Grassland.” Oecologia 168 (2): 301–310. doi:10.1007/s00442-011-2097-7.
- Luo, W., J. E. James, X. T. Lü, Z. W. Wang, E. Bai, C. F. Yan, and C. Wang. 2015. “Plant Nutrients Do Not Co-vary with Soil Nutrients under Changing Climatic Conditions.” Global Biogeochemical Cycles 29 (8): 1298–1308. doi:10.1002/2015GB005089.
- Luo, W. T., Y. Jiang, X. T. Lü, X. Wang, M. H. Li, E. Bai, X. G. Han, Z. W. Xu, and B. Bond-Lamberty. 2013. “Patterns of Plant Biomass Allocation in Temperate Grasslands across a 2500-km Transect in Northern China.” Plos One 8 (8): e71749. doi:10.1371/journal.pone.0071749.
- Luo, Z. K., R. A. Viscarra-Rossel, and T. Qian. 2021. “Similar Importance of Edaphic and Climatic Factors for Controlling Soil Organic Carbon Stocks of the World.” Biogeosciences 18 (6): 2063–2073. doi:10.5194/bg-18-2063-2021.
- Lv, G. Y., X. B. Xu, and C. P. Gao. 2021. “Effects of Grazing on Total Nitrogen and Stable Nitrogen Isotopes of Plants and Soil in Different Types of Grasslands in Inner Mongolia.” Acta Prataculturae Sinica 30 (3): 208–214.In Chinese 10.11686/cyxb2020149
- Ma, J. Y., W. Sun, X. N. Liu, F. H. Chen, and -M.-M. Kytöviita. 2012. “Variation in the Stable Carbon and Nitrogen Isotope Composition of Plants and Soil along a Precipitation Gradient in Northern China.” Plos One 7 (12): e51894. doi:10.1371/journal.pone.0051894.
- Mannel, T. T., K. Auerswald, and H. Schnyder. 2007. “Altitudinal Gradients of Grassland Carbon and Nitrogen Isotope Composition are Recorded in the Hair of Grazers.” Global Ecology and Biogeography 16: 583–592. doi:10.1111/j.1466-8238.2007.00322x.
- Martinelli, L. A., M. C. Piccolo, A. R. Townsend, P. M. Vitousek, E. Cuevas, W. McDowell, G. P. Robertson, O. C. Santos, and K. Treseder. 1999. “Nitrogen Isotopic Composition of Leaves and Soil: Tropical versus Temperate Forests.” Biogeochemistry 46 (1–3): 45–65. doi:10.1007/BF01007573.
- Mayor, J. R., S. J. Wright, E. A. Schuur, M. E. Brooks, and B. L. Turner. 2014. “Stable Nitrogen Isotope Patterns of Trees and Soils Altered by Long-term Nitrogen and Phosphorus Addition to a Lowland Tropical Rainforest.” Biogeochemistry 119 (1–3): 293–306. doi:10.1007/s10533-014-9966-1.
- Menge, D. N. L., W. T. Baisden, S. J. Richardson, D. A. Peltzer, and M. M. Barbour. 2011. “Declining Foliar and Litter δ 15 N Diverge from Soil, Epiphyte and Input δ 15 N along a 120 000 yr Temperate Rainforest Chronosequence.” New Phytologist 190 (4): 941–952. doi:10.1111/j.1469-8137.2010.03640.x.
- Mkhabela, M. S., P. R. Bullock, and H. D. Sapirstein. 2018. “Characterizing the Most Critical Climatic Parameters that Impact the Quality of Spring-wheat (Triticum Aestivum L.) On the Canadian Prairies Using Partial Least Squares (PLS) Analysis.” Journal of Cereal Science 81: 44–51. doi:10.1016/j.jcs.2018.02.012.
- Murphy, B. P., and D. M. Bowman. 2009. ““The Carbon and Nitrogen Isotope Composition of Australian Grasses in Relation to Climate.” Functional Ecology 23 (6): 1040–1049. doi:10.1111/j.1365-2435.2009.01576.x.
- Nel, J. A., J. M. Craine, and M. D. Cramer. 2018. “Correspondence between δ13C and δ15N in Soils Suggests Coordinated Fractionation Processes for Soil C and N.” Plant and Soil 423 (1–2): 257–271. doi:10.1007/s11104-017-3500-x.
- Pardo, L. H., S. G. McNulty, J. L. Boggs, and S. Duke. 2007. “Regional Patterns in Foliar 15N across a Gradient of Nitrogen Deposition in the Northeastern US.” Environmental Pollution 149 (3): 293–302. doi:10.1016/j.envpol.2007.05.030.
- Peri, P. L., B. Ladd, D. A. Pepper, F. G. Perez, S. W. Laffan, and W. Amelung. 2012. “Carbon (δ13C) and Nitrogen (δ15N) Stable Isotope Composition in Plant and Soil in Southern Patagonia’s Native Forests.” Global Change Biology 18: 311–321.
- Robinson, D. 2001. “δ15N as an Integrator of the Nitrogen Cycle.” Trends in Ecology & Evolution 16 (3): 153–162. doi:10.1016/S0169-5347(00)02098-X.
- Schulze, E. D., G. D. Farquhar, J. M. Miller, and R. J. Williams. 1999. “Interpretation of Increased Foliar δ15N in Woody Species along a Rainfall Gradient in Northern Australia.” Australian Journal of Plant Physiology 26: 296–298.
- Sun, F. F., Y. W. Kuang, D. Z. Wen, and E. Q. Hou. 2010. “Long-term Tree Growth Rate, Water Use Efficiency, and Tree Ring Nitrogen Isotope Composition of Pinus massoniana L. In Response to Global Climate Change and Local Nitrogen Deposition in Southern China.” Journal of Soils & Sediments 10 (8): 1453–1465. doi:10.1007/s11368-010-0249-8.
- Swap, R. J., J. N. Aranibar, P. R. Dowty, S. A. Macko, and S. A. Macko. 2004. “Natural Abundance of 13 C and 15 N in C 3 and C 4 Vegetation of Southern Africa: Patterns and Implications.” Global Change Biology 10 (3): 350–358. doi:10.1111/j.1365-2486.2003.00702.x.
- Tang, Z. X., X. L. Sun, Z. K. Luo, N. P. He, and O. J. X. Sun. 2018. “Effects of Temperature, Soil Substrate, and Microbial Community on Carbon Mineralization across Three Climatically Contrasting Forest Sites.” Ecology and Evolution 8 (2): 879–891. doi:10.1002/ece3.3708.
- Wang, C., X. Wang, D. Liu, H. Wu, X. Lü, Y. Fang, W. Cheng, W. Luo, P. Jiang, and J. Shi. 2014. “Aridity Threshold in Controlling Ecosystem Nitrogen Cycling in Arid and Semi-arid Grasslands.” Nature Communications 5 (1): 4799–4805. doi:10.1038/ncomms5799.
- Worley, B., and R. Powers. 2016. “PCA as a Practical Indicator of OPLS-DA Model Reliability.” Current Metabolomics 4 (2): 97–103. doi:10.2174/2213235X04666160613122429.
- Wu, Y., B. Wang, and D. Chen. 2018. “Regional-scale Patterns of δ13C and δ15N Associated with Multiple Ecosystem Functions along an Aridity Gradient in Grassland Ecosystems.” Plant and Soil 432 (1–2): 107–118. doi:10.1007/s11104-018-3781-8.
- Yang, L. M., M. Han, G. S. Zhou, and J. D. Li. 2007. “The Changes in Water-use Efficiency and Stoma Density of Leymus Chinensis along Northeast China Transect.” Acta Ecological Sinica 27 (1): 16–23. doi:10.1016/S1872-2032(07)60006-7.
- Yang, Y. H., C. J. Ji, D. Robinson, B. Zhu, H. J. Fang, H. H. Shen, and J. Y. Fang. 2013. “Vegetation and Soil 15N Natural Abundance in Alpine Grasslands on the Tibetan Plateau: Patterns and Implications.” Ecosystems 16 (6): 1013–1024. doi:10.1007/s10021-013-9664-1.
- Zhang, Y. F., C. Y. Chen, and T. Chen. 2020. “δ15N Variations in Leaves and the Relation to Environmental Factors of Sabina Przewalskii and Picea Crassifolia.”Journal of Xuchang University 39 (2) 17–22 In Chinese
- Zhao, X., X. L. Xu, F. Wang, I. Greenberg, M. Liu, R. X. Che, L. Zhang, and X. Y. Cui. 2020. “Climatic, Edaphic and Biotic Controls over Soil δ13C and δ15N in Temperate Grasslands.” Forests 11 (4): 433. doi:10.3390/f11040433.
- Zhou, Y. C., Y. Ding, H. B. Li, X. Y. Xu, Y. H. Li, W. B. Zhang, and H. Lin. 2020. “The Effects of Short-term Grazing on Plant and Soil Carbon and Nitrogen Isotope Composition in a Temperate Grassland.” Journal of Arid Environments 179: 1–8. doi:10.1016/j.jaridenv.2020.104198.
- Zhou, L., M. H. Song, S. Q. Wang, J. W. Fan, J. Y. Liu, H. P. Zhong, G. R. Yu, et al. 2014. “Patterns of Soil 15N and Total N and Their Relationships with Environmental Factors on the Qinghai-Tibetan Plateau.” Pedosphere 24 (2): 232–242. doi:10.1016/S1002-0160(14)60009-6.