
 ?Mathematical formulae have been encoded as MathML and are displayed in this HTML version using MathJax in order to improve their display. Uncheck the box to turn MathJax off. This feature requires Javascript. Click on a formula to zoom.
ABSTRACT
The Earth’s water cycle involves energy exchange and mass movement in the hydrosphere and thus sustains the dynamic balance of global hydrologic cycle. All water cycle variables on the Earth are closely interconnected with each other through the process of energy and water circulation. Observing, understanding and predicting the storage, movement, and quality of water remains a grand challenge for contemporary water science and technology, especially for researches across different spatio-temporal scales. The remote sensing observing platform has a unique advantage in acquiring complex water information and has already greatly improved observing, understanding, and predicting ability of the water cycle. Methods of obtaining comprehensive water cycle data are also expanded by new remote sensing techniques, and the vast amount of data has become increasingly available and thus accelerated a new Era: the Remote Sensing Big Data Study of Global Water Cycle. The element inversion, time and space reconstruction, and scale conversion are three key scientific issues for remote sensing water cycle in such Era. Moreover, it also presents a huge opportunity of capitalizing the combinations of Remote Sensing and Big Data to advance and improve the global hydrology and water security research and development, and uncork the new bottlenecks.
1. Introduction
Research on water cycle at both global and regional scales involves all the elements of hydrology and meteorology, including precipitation, evapotranspiration, run-off, soil moisture, groundwater, and total water storage (TWS) at various spatio-temporal resolution (Tang et al., Citation2015). These elements have profound effects on human society and natural ecosystems in many aspects (Hegerl et al., Citation2015). In the context of warming climate, the global water cycle has a tendency of acceleration (Lugato et al., Citation2013). Studying the changes in water cycle and their consequences has become an increasingly important research field. Thus, challenges of observing and forecasting water storage, movement (fluxes), and quality can also be the opportunity for modern hydrology.
Remote sensing is developing rapidly in recent 20 years. Remote sensing of water cycle is the frontier of interdisciplinary research between remote sensing and hydrology. It aims at: (1) studying the theory, methodology, and technology of acquiring hydrological components via remote sensing; (2) combining remote sensing, and hydrological models into applications (Cui, Jia, Hu, & Zhou, Citation2015; Cui et al., Citation2016; Shi & Song, Citation2015; Trudel, Leconte, & Paniconi, Citation2014). Hydrological research in the twenty-first century aims to reveal the variation of water cycle and water balance based on new technologies such as remote sensing and geographic information system (Xu, Citation2010; Ye & Xia, Citation2002). Big Data techniques have benefited the science and technology industry, the business community, and government, which are characterized by “4-Vs”: Volume, Variety, Velocity, and Value (Manyika et al., Citation2011; Rathore et al., Citation2017).
Water is closely related to the national economy and the people’s livelihood. Water resources in China have uneven spatial and temporal distribution. The extremes of droughts and floods have been making the situation even worse. It is of great significance in water resources protecting and water cycle monitoring. Considering the complexity of the water cycle, remote sensing big data will be a promising tool in making valuable and essential contributions to studies in the water cycle, and serving the economy, ecology, and society.
2. Typical remotely sensed water cycle variables
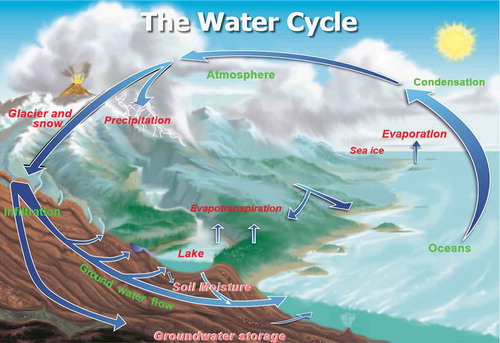
The water cycle, also known as the hydrologic cycle, describes the continuous movement of water on, above and below the surface of the Earth. The water cycle includes physical processes such as evaporation, condensation, precipitation, infiltration, surface run-off, and subsurface flow. Variables, including precipitation, evapotranspiration, soil moisture, water storage, lake, snow, glacier, and sea ice, as shown in , can be extracted, simulated, and retrieved using remote sensing techniques.
Figure 1. Water cycle and its variables. Typical remote sensing water cycle variables are denoted in red. (Figure adopted from https://water.usgs.gov/edu/watercycle.html).
2.1. Precipitation
Precipitation is one of the most important variables in hydrology. Although rain gauges and ground-based radars measure precipitation directly with relative high accuracy, they suffer from inherent limitations, such as sparse distribution and limited spatial coverage. Therefore, satellite remote sensing is the only practical way to achieve comprehensive global precipitation observations (Huffman et al., Citation2007; Huffman, Adler, Bolvin, & Nelkin, Citation2010; Tang et al., Citation2015).
Since launched in 1997, the Tropical Rainfall Measuring Mission (TRMM) satellite has provided valuable precipitation data for more than 17 years (Huffman et al., Citation2007, Citation2010). As the successor of TRMM, the Global Precipitation Measurement (GPM) core observatory, was launched in 2014 and improved precipitation measurements in mid- and high-latitudes during cold seasons, particularly for snowfall and light precipitation. Its spatial coverage will be extended to the polar regions in the future. Based on an algorithm named Integrated Multi-Satellite Retrievals for GPM (IMERG), the GPM system can integrate a group of satellites to produce regional rainfall and snowfall precipitation measurement with a temporal resolution of half-hour and global precipitation data with temporal resolution of 3-h (http://pmm.nasa.gov/GPM). The new generation of GPM data is expected to improve the monitoring and predicting accuracy of flood, drought, debris flow and snow disaster (Huffman et al., Citation2012).
2.2. Evapotranspiration
Evapotranspiration (ET), including evaporation (E), transpiration (T), and rainfall interception by vegetation (I), is one of the most important flux variables in the water cycle and plays an important role in monitoring consumptive water use (Cui, Citation2015; Long, Longuevergne, & Scanlon, Citation2014). Remote sensing provides an unprecedented opportunity to monitor spatio-temporal variability of ET using several basic inputs: (1) vegetation index: for example, Leaf Area Index (LAI) and Normalized Difference Vegetation Index (NDVI), (2) land surface temperature (LST), (3) albedo, (4) soil moisture, especially the microwave product, and (5) land cover, etc. These data are used in different resistance parameterization and energy balance schemes in the classical ET model (such as Penman-Monteith equation) or remote sensing based ET model (such as Priestley-Taylor equation) to provide regional ET estimates (Long et al., Citation2014; Wang & Dickinson, Citation2012). The global ET product of MODIS (MOD16) is based on the LAI data since 2000, with a spatial resolution of 1 km and a temporal resolution of 8 days (Mu, Heinsch, Zhao, & Running, Citation2007; Mu, Zhao, & Running, Citation2011; Vinukollu, Wood, Ferguson, & Fisher, Citation2011). NOAA provides global monthly ET dataset based on NDVI product derived from AVHRR data, with a spatial resolution of 8 km from 1983 to 2006 (Zhang, Kimball, Nemani, & Running, Citation2010). There are other ways to estimate regional ET based on higher resolution satellite data with infrared band, such as Landsat TM/ETM+/OLI, ASTER, etc., and the estimation is based on specific models such as SEBAL (Bastiaanssen et al., Citation1998), SEBS (Abouali, Timmermans, Castillo, & Su, Citation2013; Shoko, Dube, Sibanda, & Adelabu, Citation2015; Su, Citation2002), TSEB (Norman, Kustas, & Humes, Citation1995; Norman et al., Citation1995), etc.
2.3. Soil moisture
Soil moisture is a key factor controlling the interaction between land surface and the atmosphere. In diverse areas of Earth and environmental sciences, this state variable serves as an initial condition or a boundary condition in relevant hydrologic models (Entekhabi, Yueh, O’Neill, & Kellogg, Citation2014; Lievens et al., Citation2015). Meanwhile, since soil moisture can affect various processes, such as the surface run-off, soil drainage, vegetation evaporation, carbon absorption, and soil freezing-thawing, it is an important component of the water and energy balance (Yang, Long, & Shang, Citation2013).
Numerous soil moisture products with different spatial and temporal resolutions have been generated and released based on satellite data. For instance, NASA’s Soil Moisture Active Passive (SMAP) mission, launched in January, 2015, routinely provides global soil moisture basis by combining the advantage of an L-band radar and an L-band radiometer (Entekhabi et al., Citation2010), and provides daily soil moisture data with spatial resolution of 3 km using active microwave radiometer. Hence, this makes it widely paid attention to by scientists. Other soil moisture products such as SMOS (43 km spatial resolution), Aquarius (100 km spatial resolution)(Bindlish, Jackson, Cosh, Zhao, & O’Neill, Citation2015), ASCAT (25 km spatial resolution), and AMSR-E (25 km spatial resolution), SMAP (36 km and 9 km spatial resolution) (Bindlish et al., Citation2015; Das, Entekhabi, & Njoku, Citation2011; Entekhabi et al., Citation2010; Njoku, Jackson, Lakshmi, Chan, & Nghiem, Citation2003; Wagner et al., Citation2013; Wigneron, Waldteufel, Chanzy, Calvet, & Kerr, Citation2000). Since the retrieval of soil moisture uses L-band or C-band radiometer, the GNSS systems including the GPS (USA), Beidou Navigation System (China), GLONASS (Russia), and GALIEO (Europe) can be global available microwave signal source for soil moisture monitoring, collaborate with space borne GNSS-R radiometer or observation stations on the ground, which deserves further exploration in near future (Wan et al., Citation2015).
2.4. Water storage
Since launched in March, 2002, Gravity Recovery and Climate Experiment (GRACE) satellite has provided an unprecedented opportunity to capture the variability in the Earth’s gravity field that is induced primarily by changes in TWS including changes in surface water storage (SWS) (e.g. canopy, reservoirs, wetlands and lakes, rivers, and snow water equivalent), soil moisture storage (SMS), and groundwater storage (GWS) (Landerer & Swenson, Citation2012; Wang, Linage, Famiglietti, & Zender, Citation2011). By making accurate measurements of the distance between the two satellites using GPS and a microwave ranging system (accuracy is less than 10 microns), GRACE can retrieve the distribution and flow of mass within Earth gravity fields. It is also widely used in estimating profile soil moisture, estimating water balance components, monitoring drought and flood disaster and early warning, as well as quantitative assessment of drought impacts on water resources (Houborg, Rodell, Li, Reichle, & Zaitchik, Citation2012; Reager & Famiglietti, Citation2009; Swenson, Famiglietti, Basara, & Wahr, Citation2008; Thomas, Reager, Famiglietti, & Rodell, Citation2014; Tian et al., Citation2017; Vaghefi, Mousavi, Abbaspour, Srinivasan, & Yang, Citation2014; Zhao, Geruo, Velicogna, & Kimball, Citation2017).
2.5. Lake
As a part of the hydrosphere and the water cycle, lake is extremely sensitive to climate oscillation, making it an important information carrier in revealing regional response to global climate change. Remote sensing is a powerful tool to obtain sufficient and detailed information of lakes especially in a long-time series compared with traditional method such as field survey. The recognition and change detection of lakes or land surface waterbody is one of the primary tasks for land cover classification, and lake is a type of land cover that can be very accurately and rapidly recognised based on remote sensing. There are numerous global land cover datasets derived from remote sensing data that include global lakes or waterbodies, such as the IGBP-DISCover by USGS, the MODIS land cover products, GLC2000 from the European Commission Joint Research Centre (EC’s JRC), Glob-Cover2005 and Glob-Cover2009 from European Space Agency (ESA). Thematic maps of lakes and land surface waterbodies derived from multisource remote sensing data provide high-resolution and long-term monitoring of lakes change. Pekel, Cottam, Gorelick, and Belward (Citation2016) produced a high-resolution map of global surface water from 1984 to 2015 based on three million Landsat images, the waterbody was extracted using an expert system performed on the Google Earth Engine (GEE). Wan et al. (Citation2016) published a comprehensive data set of lakes over Tibetan Plateau in the past 60 years, utilizing ground survey data, and high-spatial resolution satellite images from the China-Brazil Earth Resources Satellite (CBERS) and China’s newly launched GaoFen-1 satellite. Pure water has strong absorption in visible, infrared and microwave bands, thus land surface waterbody can be easily classified in remote sensing data from wide varieties of remote sensors, and very high-resolution map of land surface waterbody is available (Chen et al., Citation2017; Jawak, Kulkarni, & Luis, Citation2015;Zhu, Li, Zhang, & Shen, Citation2015). However, distinguishing lakes from the other kinds of land surface waterbody, such as rivers, canals, man-made reservoirs, marsh, and paddy fields is still challenging and with great significance for water management (Huang, Xie, Fang, & Zhang, Citation2017;Khandelwal et al., Citation2017; Sghaier, Foucher, Lepage, & Dahmane, Citation2016). The evaluation of depth and volume of lakes or land surface waterbody using remote sensing methods also need further exploration in the future (Lu, Ouyang, Wu, Wei, & Tesemma, Citation2013; Zou et al., Citation2017).
2.6. Snow
Snow plays as an important role in global hydrological processes such as water availability, river run-off and groundwater recharge, especially in arid and semi-arid regions where snow melting is the main source of water supply (Dietz, Kuenzer, Gessner, & Dech, Citation2012). Remote sensing is the only practical way to achieve effective large-scale measurement of both snow cover and snow depth (snow water equivalent, SWE). Optical sensors are effective in detecting snow cover because of the high reflectivity of pure snow in visible wavelengths. Remote sensing data such as Landsat 1–3/MSS, Landsat 4–5/TM, Landsat 7/ETM+, Landsat 8/OLI, Terra & Aqua/MODIS, NOAA/AVHRR, GOES, SPOT/VEGETATION, ERS-2/ATRS-2, Envisat/AATSR & MERIS are main data sources available for global snow cover detection. The existing optical remote sensing data provides long-term monitoring of global snow cover since 1970s. Although optical remote sensing can provide estimates of snow cover with satisfying resolution, it suffers from cloud interference because clouds are easy to be misclassified as snow. Passive microwave remote sensors such as SMMR, SSM/I, AMSR-E are able to monitor SWE and snow cover with the existence of cloud, but their resolutions are too coarse. Active microwave sensors provide more accurate ways to detect snow cover, such as RADARSAT & RADARSAT2/SAR, Envisat/ASAR, JERS 1/SAR and TerraSAR-X (Dietz et al., Citation2012). In order to make full use of the different kinds of measurements, Wang and Xie (Wang & Xie, Citation2009) developed a new method based on an improved data processing and image fusion technique. Studies indicate that the merged algorithm performs much better than single algorithm. The remote sensed snow product is widely used in modelling snowmelt run-off, and reducing economic losses from disaster (Tekeli, Akyürek, Şorman, Şensoy, & Şorman, Citation2005; Wang, Xie, & Liang, Citation2008).
2.7. Glacier and sea ice
The cryosphere is the most sensitive region to global climate change. Various remote sensing instruments have been applied to monitor global glacier changes, in terms of the volume and mass of glacier (GRACE, ICESat), the length of ice tongue and ice cover (LandSat, SPOT, ASTER), and ice surface velocity (RADAR, InSAR).
Passive Microwave instruments, such as SSM/I, AMSR-E, and AMSR2, have provided polar sea ice product with relative accuracy since 1980s. The thickness of sea ice in the Arctic decreases significantly as sensed during the past four decades, however, the debates about the variation tendency of the Antarctic sea ice are still on-going in the scientific community. Based on sea ice measurement data, Xie et al. (Citation2011; Citation2013) proposed an empirical formula to convert the ICESat altimetry snow freeboard to sea ice thickness.
3. Remote sensing big data
Big data is a term that describes the large volume of data, either structured or unstructured, that inundates the regular pattern on a time series or regular observation basis. The mainstream description of big data is the “4-Vs” (Guo, Citation2017; Li, Citation2016; Li, Zhang, & Xia, Citation2014; Manyika et al., Citation2011; Rathore et al., Citation2017): (1) Volume: the quantity of generated and stored data. The volume size of data determines its potential value. (2) Variety: the type and nature of the data. This helps people who analyse it to effectively use the resulting insight. Data value was extracted from text, images, audio, and video using data fusion. (3) Velocity: the speed at which the data is generated and processed to meet the demands and challenges. (4) Value: the ultimate purpose of big data. The primary value of big data comes not from the raw data, but from the analysis process. Big data can help us to make better decisions and strategic actions.
3.1. What is remote sensing big data?
Remote sensing big data is the practice of theory, technology, and methodology of big data in the field of remote sensing. As to the volume of remote sensing data, it is generally known that the remote sensing systems have accumulated large amount of dataset since the first remote sensing satellite was launched. For example, the amount of data received by the NASA Earth observation data and information system (EOSDIS) increases by 4 TB per day (Zhu et al., Citation2016). It is also known that there is a variety of remote sensing data types, including panchromatic (Zhou, Civco, & Silander, Citation1998), multispectral (Berni, Zarcotejada, Suarez, & Fereres, Citation2009), hyperspectral (Melgani & Bruzzone, Citation2004), infrared (Kustas & Anderson, Citation2009), synthetic aperture radar (SAR) (Yang, Wang, & Lin, Citation2017) and Light Detection And Ranging (LiDAR) (Cui, Zhao, Fan, & Xu, Citation2011). As more and more remote sensors available, such satellites, airplanes, UAVs, balloon and high altitude platform stations, the time interval between acquisition of different remote sensing products for a particular region is shorten from yearly or monthly to daily or hourly, or even less. There is no doubt that remote sensing data is in an era with great velocity for data updating, producing and processing. However, remote sensing data is not simple accumulation of different datasets amounts, and the inner linkage of different data is more important. More and more researches are making full use of the large amount, multisource, and fast updating remote sensing datasets, and benefiting from the high value in mining information for military target, environmental status, hydrological, meteorological, agriculture, forest, urban, traffic etc. According to the “4Vs” of big data, the multi-source, multi-scale, high-dimensional, dynamic-state, isomer, and non-linear characteristics of today’s remote sensing data is absolutely big data (Li, Citation2016; Li et al., Citation2014).
It is important for us to consider these more concrete characteristics of remote sensing big data when using remote sensing to extract information and understand geo-processes. These characteristics are fundamental assumptions and priors when we analyse remote sensing big data. More characteristics can provide us more information. However, there is no doubt that most of the existing techniques and methods are too limited to solve all the problems of remote sensing big data due to its complexity. Since almost all algorithms and models have to consider the intrinsic and extrinsic characteristics of data, most of the fundamental theories, methods, and even applications now have to adapt to the great changes from remote sensing big data. It is both the opportunity and challenge for remote sensing communities.
3.2. The techniques of remote sensing big data
With the diversity of the observing methods and the growing categories, quantity, and observation frequency of remote sensing data, the ability of Earth observation (EO) system has reached an unprecedented level, indicating that a new era of big data in remote sensing is coming. New techniques are under development to meet the need of the big data application in remote sensing. A general workflow of remote sensing big data techniques is shown in , adopted from Hou et al. (Citation2017).
Figure 2. Workflow of remote sensing big data.
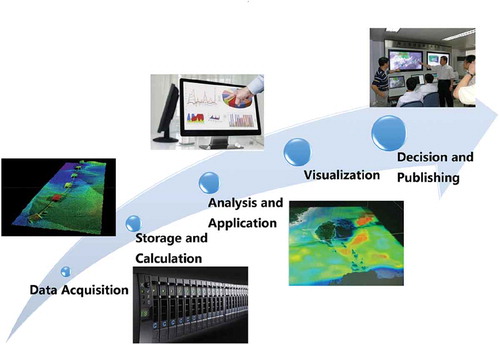
Data acquisition techniques are the most active field in remote sensing big data. Based on the existing projects of EO led by the government and scientific communities, EO data was accumulated with long-time series and high qualities. An increasing number of companies and economic agents are committed to their own remote sensing data acquisition projects to fulfil different applications. For example, The Planet Labs, Inc. developed a system to provide EO data with more than 175 satellites in orbit, and thus able to observe the entire Earth every single day.
Data storage and calculation techniques are important for remote sensing big data. Though most remote sensing data is structured, data from different sources vary in scales, resolutions, dimensions, dynamic-state, and isomer, which is a great challenge to data storage and management. The distributed storage and management based on metadata is the most popular technique for remote sensing big data storage. Distributed computation, parallel computing, and collaborative computing are developed in four levels including data level, technology level, service level, and producing level.
Analysis and application of remote sensing big data is based on the data storage and calculation techniques, such as the MongoDB and Hadoop framework. However, the traditional data analysis processes are designed based on specific data sources and serial analysis models, rather than on remote sensing data. The data analysis and application requires further cooperation between geographical scientists, GIS scientists, and data scientists.
The visualization, publishing, and decision-making based on remote sensing big data are also the hot topics in the near future.
3.3. Extracting water cycle variables using remote sensing big data
Remote sensing big data provides great potential to extract, simulate, and retrieve water cycle variables includes precipitation, evapotranspiration, soil moisture, water storage, lake, snow, glacier, and sea ice. Most of the previously mentioned variables are obtained using the existing remote sensing data. Moreover, multi-source and multi-temporal remote sensing data leads to a more accurate and timely observation. Driven by the distributed storage, management, and computation technique of remote sensing big data, the data mining and extraction of water cycle variables in large scale with high-resolution and better accuracy becomes possible. For example, Pekel et al. (Citation2016) built an expert system for high-resolution and long-time series mapping of global surface water based on the Google Earth Engine (GEE) and remote sensing big data.
4. Opportunities and challenges of remote sensing water cycle
One of the primary bottleneck faced by the global remote sensing water cycle research is the lack of enough observations, resulting in a limited scientific understanding in the critical processes of global change. Resolving these problems can further deepen the understanding of global water cycle, and also enhance the ability to cope with climate change. In the foreseeable future, efforts are needed to solve the following scientific issues for the remote sensing water cycle.
4.1. Improving the spatio-temporal resolution and continuity of remote sensing water cycle products
Current remote sensing water cycle products remain insufficient, due to the difficulty in retrieving some elements and the coarse spatio-temporal resolution for available dataset. For example, the spatial resolution of soil moisture is generally larger than km. Furthermore, remote sensing soil moisture only provides data every several days (Cui et al., Citation2016), and only available after 1978. Moreover, there is a large portion of missing data before 2007 especially.
The key points that must be highlighted for remote sensing water cycle in future can be described as follow: (1) more advanced remote sensing instruments need to be developed, such as for ET and run-off; (2) current algorithms for retrieving the water cycle variables need to be improved, more accuracy; (3) datasets covering all water cycle variables should be made available, such as the root zone soil moisture; (4) the uncertainties in remote sensing products must be quantified.
4.2. Improving the physical mechanism expression of remote sensing retrieval and forward model
Forward modelling simulation and model-based retrieval are two main directions of quantitative remote sensing. Nowadays there are still some uncertainties in many physical mechanisms to retrieving water cycle components using remote sensing. When applied to different regions at different scales, retrieval models become questionable as to whether the performance is robust. For different components, the retrieval accuracies are variable. Traditional in-situ observations are also needed to improve the products’ precision, such as the case of precipitation. In the future, strengthening the physical mechanism study between remote sensing and water cycle variables, and improving the expressions of remote sensing retrieval and forward models, are two important ways to improve accuracy and applicability of the remote sensing water cycle products.
4.3. Strengthening the observation in sensitive regions and phenomenon of rapid change in water cycle
In the context of climate change, global or regional water cycle is accelerating and the heterogeneous spatial and temporal distribution of water resources is strengthening. It is hence urgent to enhance the utilization of multi-source observations for water cycle, energy balance, marine environment, and the cryosphere, especially in the Arctic, the Antarctic, and the Tibetan Plateau (known as the Earth’s Third Pole and Asia’s water towers). Rivers originated from the Tibetan Plateau support the development of society and economy in the surrounding countries. However, the Tibetan Plateau is sensitive to climate change and human activities, making it necessary to obtain a comprehensive and long-term observation covering all water cycle components over the Tibetan Plateau.
Some disastrous rapid changing (such as atmosphere) and abrupt changing (such as ice cap collapse) phenomena are hard to accurately forecast due to heterogeneous distribution. Most parts of China are in mountainous and hilly regions, where flash floods are frequent caused by rainstorms and lead to a great deal of personnel and property losses. The combination of model prediction and remote sensing observations can help reduce the loss caused by such rapid and fierce disasters (Gourley et al., Citation2013).
4.4. Promoting coupling and synergy between observations of different platforms
The lack of effective mechanism to deal with collaborative interaction between the existing large numbers of Earth observing platforms is, as a matter of fact, holding back the progress of further research. Remote sensing retrieval of different water cycle variables is relatively isolated. Remote sensing observation from single platform or in one dimension rather than multiple platforms and multi-dimensional data cannot satisfy researchers’ demand. For example, the success of TRMM/GPM takes advantage of infrared and passive microwave data from multi-satellites and multi-sensors, as well as ground-based observations, to achieve the accurate retrieval of precipitation at global scale. Multi-Radar/Multi-Sensor system (MRMS) in the US uses automated algorithms to improve the spatial-temporal resolution (5 min, 1 km), which can quickly and intelligently integrate data streams from multiple radars, surface and upper air observations, lightning detection systems, satellite, and outputs of forecast models.
Overall, there are still no mature and effective comprehensive observation system, which can be built by synthesizing multi-source observations, such as satellites, buoys, and ground stations. Hence, a super observation network should be built by the government under large project plans. As a major party involved in global change, China has the responsibility to strengthen the global observation framework.
4.5. Developing and improving data assimilation, fusion, and big data analysis methodology
To obtain the data value using data mining and analysis, the ability to support model validation and major scientific issues research should be enhanced. Some hydrological analysis has been tried using satellite remote sensing big data and hydrological model (Ma, Sun, Yang, & Zhang, Citation2018). There are three complicated key processes on Earth system level that should be paid special attention to: (1) the synthetically response mechanism between the Earth’s three poles, (2) the feedback enhancement of black carbon accelerating sea ice melting, and (3) the water balance closure and change response over the Tibetan Plateau. All the three processes involve the analysis of heterogeneous data. At the same time, due to the special of different regions, the existing product is difficult to meet the needs of researches. High quality water cycle products are need through data assimilation and fusion method. Obviously, big data analysis methods will play an important role.
5. The future of remote sensing water cycle in the era of big data
In the era of remote sensing big data, three key issues should be resolved for water cycle: variable inversion, time and space reconstruction, and scale conversion. The analysis of water cycle data relies on the advanced technology of data processing, including distributed data storage and management framework, and big data mining methods such as machine learning. However, there are still many difficulties from big data to knowledge and we need a new guideline.
5.1. From scientific cognition to scientific theory
With the help of big data technology, the new cognition of remote sensing water cycle can not only stay in the stage of exploring associations between variables via statistical methods such as correlations, which just proves an experience and making us in the trap of empiricism easily. It should also transform from correlation discovery to causality discovery, which is consistent with the natural of science and has logical necessity. In the era of big data, new discoveries of water cycle should be valuable, based on the existing cognitive science.
5.2. The mutual reinforcement between correlation and causation
Social science is more of chaos, and therefore the researches on correlation finding among various problems and phenomena in the social sciences are more meaningful. For natural science, big data can also help us to find the correlation more comprehensively, identifying the causality, and finally improving the research level of water science. On the other hand, for new scientific issue, causality can reduce the search scope of the correlation finding, making the big data mining model more targeted, so as to improve the efficiency of the water cycle scientific discoveries.
5.3. Increasing the type and quantity of data continually
Although there are many types of remote sensing water cycle data, the direct observation data is still insufficient. We also lack adequate data with fine resolution in hot research areas. Therefore, the number of data types should be increased based on the further development of observation instruments. Especially at fine scale and over special small areas, it is important to improve the spatial resolution and shorten the satellite revisiting period, by further promoting the satellite launch plan.
6. Conclusion
Remote sensing big data provides a different point of view other than traditional approaches to comprehensively measurement of global water cycle. For all components of water cycle, many kinds of remote sensing products with different spatio-temporal resolution are available. Remote sensing has greatly enhanced the ability of human to observe the hydrosphere, and thus a vast amount of valuable global data has been accumulated, which also promoted the development and transformation of the water related academic research and development industries. The new era of global water cycle Big Data has arrived. This study presents a general summary of global remote sensing water cycle and remote sensing big data. The emerging research and development direction is also prospected for the future. Remote sensing of water cycle and remote sensing big data will remain the frontier and hot research area into the coming decades.
Correction Statement
This article has been republished with minor changes. These changes do not impact the academic content of the article.
Data availability statement
Data sharing is not applicable to this article as no new data were created or analysed in this study.
Disclosure statement
No potential conflict of interest was reported by the authors.
References
- Abouali, M., Timmermans, J., Castillo, J. E., & Su, B. Z. (2013). A high performance GPU implementation of surface energy balance system (SEBS) based on CUDA-C. Environmental Modelling & Software, 41(3), 134–138.
- Bastiaanssen, W. G. M., Pelgrum, H., Wang, J., Ma, Y., Moreno, J. F., Roerink, G. J., & Van der Wal, T. (1998). A remote sensing surface energy balance algorithm for land (SEBAL): Part 2: Validation. Journal of Hydrology, 212(1–4), 213–229.
- Berni, J., Zarcotejada, P. J., Suarez, L., & Fereres, E. (2009). Thermal and narrowband multispectral remote sensing for vegetation monitoring from an unmanned aerial vehicle. IEEE Transactions on Geoscience & Remote Sensing, 47, 722–738.
- Bindlish, R., Jackson, T., Cosh, M., Zhao, T., & O’Neill, P. (2015). Global soil moisture from the aquarius/SAC-D satellite: Description and initial assessment. IEEE Geoscience & Remote Sensing Letters, 12, 923–927.
- Chen, X., Li, J., Zhang, Y., Jiang, W., Tao, L., & Shen, W. (2017). Evidential fusion based technique for detecting landslide barrier lakes from cloud-covered remote sensing images. IEEE Journal of Selected Topics in Applied Earth Observations & Remote Sensing, PP(99), 1–16.
- Cui, Y. (2015). Estimation of evapotranspiration from soil-vegetation system using multi-source remote sensing data (in Chinese). A Dissertation Submitted to the University of Chinese Academy of Sciences, 1–20.
- Cui, Y., Jia, L., Hu, G., & Zhou, J. (2015). Mapping of interception loss of vegetation in the Heihe river basin of China using remote sensing observations. IEEE Geoscience and Remote Sensing Letters, 12, 23–27.
- Cui, Y., Long, D., Hong, Y., Zeng, C., Zhou, J., Han, Z., … Wan, W. (2016). Validation and reconstruction of FY-3B/MWRI soil moisture using an artificial neural network based on reconstructed MODIS optical products over the Tibetan Plateau. Journal Of Hydrology, 543, 242–254.
- Cui, Y. K., Zhao, K. G., Fan, W. J., & Xu, X. R. (2011). Retrieving crop fractional cover and LAI based on airborne Lidar data. Journal of Remote Sensing, 15, 1276–1288.
- Das, N. N., Entekhabi, D., & Njoku, E. G. (2011). An algorithm for merging SMAP radiometer and radar data for high-resolution soil-moisture retrieval. IEEE Transactions on Geoscience & Remote Sensing, 49, 1504–1512.
- Dietz, A. J., Kuenzer, C., Gessner, U., & Dech, S. (2012). Remote sensing of snow – A review of available methods. International Journal of Remote Sensing, 33(13), 4094–4134.
- Entekhabi, D., Njoku, E. G., Neill, P. E. O., Kellogg, K. H., Crow, W. T., Edelstein, W. N., … Johnson, J. (2010). The Soil Moisture Active Passive (SMAP) mission. Proceedings of the IEEE, 98, 704–716.
- Entekhabi, D., Yueh, S., O’Neill, P., & Kellogg, K. (2014). SMAP handbook. JPL Publication JPL, 400–1567.
- Gourley, J. J., Hong, Y., Flamig, Z. L., Arthur, A., Clark, R., Calianno, M., … Kirstetter, P.-E. (2013). A unified flash flood database across the United States. Bulletin of the American Meteorological Society, 94, 799–805.
- Guo, H. (2017). Big Earth data: A new frontier in Earth and information sciences. Big Earth Data, 1(1–2), 4–20.
- Hegerl, G. C., Black, E., Allan, R. P., Ingram, W. J., Polson, D., Trenberth, K. E., … Becker, A. (2015). Challenges in quantifying changes in the global water cycle. Bulletin of the American Meteorological Society, 96.
- Hou, X., Hong, Y., Zhang, J., Zhou, Y., Shi, X., Ren, L., … Cui, Y. (2017). Marine big data: Concept, applications and platform construction (in Chinese). Marine Science Bulletin, 36, 9.
- Houborg, R., Rodell, M., Li, B., Reichle, R., & Zaitchik, B. F. (2012). Drought indicators based on model‐assimilated gravity recovery and climate experiment (grace) terrestrial water storage observations. Water Resources Research, 48(7), 2515–2521.
- Huang, X., Xie, C., Fang, X., & Zhang, L. (2017). Combining pixel- and object-based machine learning for identification of water-body types from urban high-resolution remote-sensing imagery. IEEE Journal of Selected Topics in Applied Earth Observations & Remote Sensing, 8(5), 2097–2110.
- Huffman, G. J., Adler, R. F., Bolvin, D. T., Gu, G. J., Nelkin, E. J., Bowman, K. P., … Wolff, D. B. (2007). The TRMM multisatellite precipitation analysis (TMPA): Quasi-global, multiyear, combined-sensor precipitation estimates at fine scales. Journal of Hydrometeorology, 8, 38–55.
- Huffman, G. J., Adler, R. F., Bolvin, D. T., & Nelkin, E. J. (2010). The TRMM Multi-Satellite Precipitation Analysis (TMPA). Journal of Hydrometeorology, 8, 38.
- Huffman, G. J., Bolvin, D. T., Braithwaite, D., Hsu, K., Joyce, R., Kidd, C. … & Yoo, S. H. (2012). Developing the integrated multi-satellite retrievals for GPM (IMERG). Acta Paulista De Enfermagem, 25(1), 146–150.
- Jawak, S. D., Kulkarni, K., & Luis, A. J. (2015). A review on extraction of lakes from remotely sensed optical satellite data with a special focus on cryospheric lakes. Advances in Remote Sensing, 4, 196–213.
- Khandelwal, A., Karpatne, A., Marlier, M. E., Kim, J., Lettenmaier, D. P., & Kumar, V. (2017). An approach for global monitoring of surface water extent variations in reservoirs using MODIS data. Remote Sensing of Environment, 202, 113–128.
- Kustas, W., & Anderson, M. (2009). Advances in thermal infrared remote sensing for land surface modeling. Agricultural & Forest Meteorology, 149, 2071–2081.
- Landerer, F. W., & Swenson, S. C. (2012). Accuracy of scaled GRACE terrestrial water storage estimates. Water Resources Research, 48, 4531.
- Li, D. (2016). Towards geo-spatial information science in big data era. Acta Geodaetica Et Cartographica Sinica, 45, 379–384.
- Li, D., Zhang, L., & Xia, G. (2014). Automatic analysis and mining of remote sensing big data. Acta Geodaetica Et Cartographica Sinica, 43, 1211–1216.
- Lievens, H., Tomer, S. K., Bitar, A. A., Lannoy, G. J. M. D., Drusch, M., Dumedah, G., … Pan, M. (2015). SMOS soil moisture assimilation for improved hydrologic simulation in the Murray Darling Basin, Australia. Remote Sensing of Environment, 168, 146–162.
- Long, D., Longuevergne, L., & Scanlon, B. R. (2014). Uncertainty in evapotranspiration from land surface modeling, remote sensing, and GRACE satellites. Water Resources Research, 50, 1131–1151.
- Lu, S., Ouyang, N., Wu, B., Wei, Y., & Tesemma, Z. (2013). Lake water volume calculation with time series remote-sensing images. International Journal for Remote Sensing, 34(22), 7962–7973.
- Lugato, E., Alberti, G., Gioli, B., Kaplan, J. O., Peressotti, A., & Miglietta, F. (2013). Long-term pan evaporation observations as a resource to understand the water cycle trend: Case studies from Australia. International Association of Scientific Hydrology Bulletin, 58, 1287–1296.
- Ma, J., Sun, W., Yang, G., & Zhang, D. (2018). Hydrological analysis using satellite remote sensing big data and CREST model. IEEE Access, PP, 1.
- Manyika, J., Chui, M., Brown, B., Bughin, J., Dobbs, R., Roxburgh, C., & Byers, A. H. (2011). Big data: The next frontier for innovation, competition, and productivity. Analytics, 27–37.
- Melgani, F., & Bruzzone, L. (2004). Classification of hyperspectral remote sensing images with support vector machines. IEEE Transactions on Geoscience and Remote Sensing, 42, 1778–1790.
- Mu, Q., Heinsch, F. A., Zhao, M., & Running, S. W. (2007). Development of a global evapotranspiration algorithm based on MODIS and global meteorology data. Remote Sensing of Environment, 111, 519–536.
- Mu, Q. Z., Zhao, M. S., & Running, S. W. (2011). Improvements to a MODIS global terrestrial evapotranspiration algorithm. Remote Sensing of Environment, 115, 1781–1800.
- Njoku, E. G., Jackson, T. J., Lakshmi, V., Chan, T. K., & Nghiem, S. V. (2003). Soil moisture retrieval from AMSR-E. Geoscience and Remote Sensing, IEEE Transactions On, 41, 215–229.
- Norman, J. M., Kustas, W. P., & Humes, K. S. (1995). Source approach for estimating soil and vegetation energy fluxes in observations of directional radiometric surface-temperature. Agricultural and Forest Meteorology, 77, 263–293.
- Pekel, J.-F., Cottam, A., Gorelick, N., & Belward, A. S. (2016). High-resolution mapping of global surface water and its long-term changes. Nature, 540, 418.
- Rathore, M. M. U., Paul, A., Ahmad, A., Chen, B. W., Huang, B., & Ji, W. (2017). Real-time big data analytical architecture for remote sensing application. IEEE Journal of Selected Topics in Applied Earth Observations & Remote Sensing, 8, 4610–4621.
- Reager, J. T., & Famiglietti, J. S. (2009). Global terrestrial water storage capacity and flood potential using grace. Radiology, 36(23), 195–215.
- Sghaier, M. O., Foucher, S., Lepage, R., & Dahmane, M. (2016). Combination of texture and shape analysis for a rapid rivers extraction from high resolution SAR images. Geoscience and Remote Sensing Symposium, 673–676. IEEE.
- Shi, Y., & Song, L. (2015). Spatial downscaling of monthly TRMM precipitation based on EVI and other geospatial variables over the Tibetan Plateau from 2001 to 2012. Mountain Research & Development, 35.
- Shoko, C., Dube, T., Sibanda, M., & Adelabu, S. (2015). Applying the surface energy balance system (SEBS) remote sensing model to estimate spatial variations in evapotranspiration in Southern Zimbabwe. Transactions of the South African Philosophical Society, 70(1), 47–55.
- Su, Z. (2002). The Surface Energy Balance System (SEBS) for estimation of turbulent heat fluxes. Hydrology and Earth System Sciences, 6, 85–99.
- Swenson, S., Famiglietti, J., Basara, J., & Wahr, J. (2008). Estimating profile soil moisture and groundwater variations using GRACE and Oklahoma Mesonet soil moisture data. Water Resources Research, 44, 568–569.
- Tang, G., Long, D., Wan, W., & Al, E. (2015). An overview and outlook of global water remote sensing technology and applications (in Chinese). Scientia Sinica Technical, 45, 11.
- Tang, G., Zeng, Z., Long, D., Guo, X., Yong, B., Zhang, W., & Hong, Y. (2015). Statistical and hydrological comparisons between TRMM and GPM level-3 products over a midlatitude basin: Is day-1 IMERG a good successor for TMPA 3B42V7? Journal of Hydrometeorology, 17, 121–137.
- Tekeli, A. E., Akyürek, Z., Şorman, A. A., Şensoy, A., & Şorman, A. Ü. (2005). Using MODIS snow cover maps in modeling snowmelt runoff process in the eastern part of Turkey. Remote Sensing of Environment, 97, 216–230.
- Thomas, A. C., Reager, J. T., Famiglietti, J. S., & Rodell, M. (2014). A grace‐based water storage deficit approach for hydrological drought characterization. Geophysical Research Letters, 41(5), 1537–1545.
- Tian, S., Tregoning, P., Renzullo, L. J., Dijk, A. I. J. M. V., Walker, J. P., Pauwels, V. R. N., & Allgeyer, S. (2017). Improved water balance component estimates through joint assimilation of GRACE water storage and SMOS soil moisture retrievals. Water Resources Research, 53, 1820–1840.
- Trudel, M., Leconte, R., & Paniconi, C. (2014). Analysis of the hydrological response of a distributed physically-based model using post-assimilation (EnKF) diagnostics of streamflow and in situ soil moisture observations. Journal of Hydrology, 514, 192–201.
- Vaghefi, S. A., Mousavi, S. J., Abbaspour, K. C., Srinivasan, R., & Yang, H. (2014). Analyses of the impact of climate change on water resources components, drought and wheat yield in semiarid regions: Karkheh River Basin in Iran. Hydrological Processes, 28, 2018–2032.
- Vinukollu, R. K., Wood, E. F., Ferguson, C. R., & Fisher, J. B. (2011). Global estimates of evapotranspiration for climate studies using multi-sensor remote sensing data: Evaluation of three process-based approaches. Remote Sensing of Environment, 115(3), 801–823.
- Wagner, W., Hahn, S., Kidd, R., Melzer, T., Bartalis, Z., Hasenauer, S., … Rubel, F. (2013). The ASCAT soil moisture product: A review of its specifications, validation results, and emerging applications. Meteorologische Zeitschrift, 22, 5–33.
- Wan, W., Bai, W., Zhao, L., Long, D., Sun, Y., Meng, X., … & Hong, Y. (2015). Initial results of China’s GNSS-r airborne campaign: Soil moisture retrievals. Science Bulletin, 60(10), 964–971.
- Wan, W., Long, D., Hong, Y., Ma, Y., Yuan, Y., Xiao, P., … Gu, X. (2016). A lake data set for the Tibetan Plateau from the 1960s, 2005, and 2014. Scientific Data, 3.
- Wang, K., & Dickinson, R. E. (2012). A review of global terrestrial evapotranspiration: Observation, modeling, climatology, and climatic variability. Reviews Of Geophysics, 50, RG2005.
- Wang, X., Linage, C. D., Famiglietti, J., & Zender, C. S. (2011). Gravity Recovery and Climate Experiment (GRACE) detection of water storage changes in the Three Gorges Reservoir of China and comparison with in situ measurements. Water Resources Research, 47, 1091–1096.
- Wang, X., & Xie, H. (2009). New methods for studying the spatiotemporal variation of snow cover based on combination products of MODIS Terra and Aqua. Journal of Hydrology, 371, 192–200.
- Wang, X., Xie, H., & Liang, T. (2008). Evaluation of MODIS snow cover and cloud mask and its application in Northern Xinjiang, China. Remote Sensing of Environment, 112, 1497–1513.
- Wigneron, J. P., Waldteufel, P., Chanzy, A., Calvet, J. C., & Kerr, Y. (2000). Two-dimensional microwave interferometer retrieval capabilities over land surfaces (SMOS Mission). Remote Sensing of Environment, 73, 270–282.
- Xie, H., Ackley, S., Yi, D., Zwally, H., Wagner, P., Weissling, B., … Ye, K. (2011). Sea-ice thickness distribution of the Bellingshausen Sea from surface measurements and ICESat altimetry. Deep Sea Research Part II: Topical Studies in Oceanography, 58, 1039–1051.
- Xie, H., Tekeli, A. E., Ackley, S. F., Yi, D., & Zwally, H. J. (2013). Sea ice thickness estimations from ICESat Altimetry over the Bellingshausen and Amundsen Seas, 2003–2009. Journal of Geophysical Research: Oceans, 118, 2438–2453.
- Xu, Z. (2010). Hydrological model: Review and prospect (in Chinese). Journal of Beijing Normal University (Natural Science), 46, 12.
- Yang, J., Wang, J., & Lin, R. (2017). The first quantitative remote sensing of ocean internal waves by Chinese GF-3 SAR satellite. Acta Oceanologica Sinica, 36, 118.
- Yang, Y., Long, D., & Shang, S. (2013). Remote estimation of terrestrial evapotranspiration without using meteorological data. Geophysical Research Letters, 40, 3026–3030.
- Ye, S., & Xia, J. (2002). Retrospect and prospect of hydrology science research (in Chinese). Advances in Water Science, 13, 12.
- Zhang, K., Kimball, J. S., Nemani, R. R., & Running, S. W. (2010). A continuous satellite‐derived global record of land surface evapotranspiration from 1983 to 2006. Water Resources Research, 46(9), 109–118.
- Zhao, M., Geruo, A., Velicogna, I., & Kimball, J. S. (2017). A global gridded dataset of GRACE drought severity index for 2002–14: Comparison with PDSI and SPEI and a case study of the Australia millennium drought. Journal of Hydrometeorology, 18, 2117–2129.
- Zhou, J., Civco, D. L., & Silander, J. A. (1998). A wavelet transform method to merge Landsat TM and SPOT panchromatic data. International Journal of Remote Sensing, 19, 743–757.
- Zhu, H., Li, C., Zhang, L., & Shen, J. (2015). River channel extraction from SAR images by combining gray and morphological features. Circuits Systems & Signal Processing, 34(7), 1–16.
- Zhu, J., Shi, Q., Chen, F., Shi, X., Dong, Z., & Qin, Q. (2016). Research status and development trends of remote sensing big data. Journal of Image and Graphics, 21, 15.
- Zou, Z., Dong, J., Menarguez, M. A., Xiao, X., Qin, Y., Doughty, R. B., … & Hambright, K. D. (2017). Continued decrease of open surface water body area in Oklahoma during 1984–2015. Science of the Total Environment, 595, 451–460.