
 ?Mathematical formulae have been encoded as MathML and are displayed in this HTML version using MathJax in order to improve their display. Uncheck the box to turn MathJax off. This feature requires Javascript. Click on a formula to zoom.
ABSTRACT
The South Asia has high variability in geographical features, climate, and landscapes. With the rapid economic development and population growth, the increased pressure on natural resources, land degradation, water crisis, and climate change become the common concerns for the countries in the region. To get a deep and general idea about the land and water natural resources and environment in South Asia, a knowledge database was constructed based on the climatic condition, land use/cover, water resources, water disasters, and geohazards. The results presented a scientific insight regarding the spatio-temporal changing pattern of the eco-environmental components in this region. Risk assessments were performed for the floods, droughts, and geohazards which occurred with a high frequency. In general, the big knowledge database established in this study would be helpful to aid the development of future policies and programs (like the Belt and Road Initiative) for environmental issues adaptation in the region, including initiatives for regional cooperation and capacity building in natural resources and environment management.
1. Introduction
The South Asia is often attributed as the Indian subcontinent consisting of eight countries in South Asia (Afghanistan, Bangladesh, Bhutan, India, Maldives, Nepal, Pakistan, and Sri Lanka), which are considered to be part of a large, self-contained landmass. Based on physical geographical features, the entire self-contained landmass is primarily fragmented into two arbitrary features: the first is the division from the rest of the Asian continent by the Himalayas, Karakorum, and Hindu Kush mountain ranges and the second one is the Indian Plate, which extends most of the subcontinent above sea level. The geographic region is bounded on the north by the Himalayas extending 2400 km from the Brahmaputra River to the Karakorum mountains, on the west by the Arabian Sea, on the east by the Bay of Bengal.
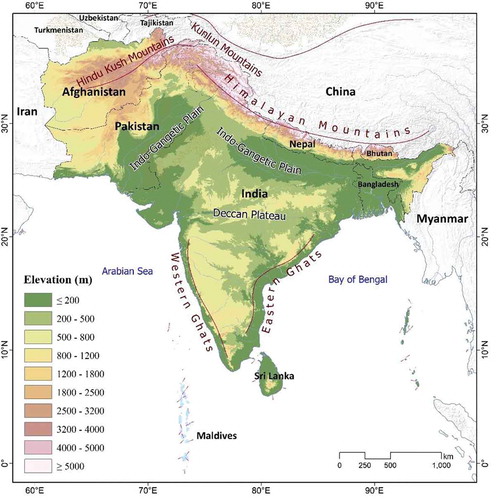
In general, the South Asia covers about 5.03 million km2, which occupies only 3% of the global land area. However, it is home to about one fourth of the world’s population (around 1.8 billion). According to the topographic map of South Asia (), South Asia is made up of three topographic regions: the Himalaya, Karakorum, and Hindu Kush mountain ranges and their southern slopes, the Indo-Gangetic plain, and the Deccan Plateau. The Hindu Kush Himalayas has 14 mountains peaks over 8000 m above sea level. The Indo-Gangetic Plain created by the Indus, Ganges, and Brahmaputra Rivers and their many tributaries as they flow from the Himalayas to the sea. The Thar Desert located in the northwestern India and eastern Pakistan, and the Deccan Plateau in the middle and south of India.
Figure 1. Location of South Asia with its elevation profiling – A 30 m spatial resolution Shuttle Radar Topographic Mission, Digital Elevation Model Data was used to prepared elevation profiles.
The climate in South Asia varies considerably with the dry subtropical continental climate in the northern Indian edge and northern Pakistani uplands, the equatorial climate in the far south of India and southwest Sri Lanka, the hot subtropical climate in northwest India, the hot tropical climate in Bangladesh, the tropical semi-arid climate in the center and the Alpine climate in the Himalayas (Pant & Kumar, Citation1997). Generally, the average air temperature in the south of the South Asia is about 25°C, while the average value in the north part ranges from 5°C to 10°C with some areas lower than 0°C. The amount of annual rainfall also changes greatly from lower than 400 mm in the northwest to higher than 800 mm in the northeast.
In this region, the climate variations are not only influenced by the changing latitude and altitude, but also by factors such as proximity to the sea coast and the seasonal impact of the monsoons (Turner & Annamalai, Citation2012). The winter rainfall is usually from September to March, while the summer monsoon is usually from June to September and accounts for 70–90% of the annual precipitation. This nonuniform distribution of rainfall induces the water resources to have significant spatial and temporal variability. The South Asia region covers diverse geographical landscapes, such as glaciers, rainforests, valleys, deserts, and grasslands. However, the imbalance distribution of precipitation, the rapid population growth and urbanization, the fast-economic development demand, and the impacts from climate change bring increasing pressure to the natural environment of the South Asia (Auffhammer, Ramanathan, & Vincent, Citation2012; Sheikh et al., Citation2015).
Environmental problems, such as land degradation, water scarcity and degradation, deforestation and biodiversity loss, air pollution, and frequent natural disaster, have become the main challenges for South Asian countries (Atapattu & Kodituwakku Citation2009; Biemans et al., Citation2013; Rasul, Citation2014). Take the water problem as an example, according to the reports from the UN Economic and Social Commission for Asia and the Pacific (UNESCAP), the availability of renewable water varies widely among the eight countries but experiences a big decrease over the last two decades with the maximum decrease in Afghanistan and Bhutan (more than 50%). Behind the water scarcity, it is the obvious increase in the frequency of large and extreme floods in this region. The analysis study conducted by Kale (Citation2014) indicated that an increasing trend in the total damages from floods during 1951–2011. A clear evidence can be concluded that the flood-generating extreme rainfall even became more frequently and human interventions enlarged the destruction.
Apart from the key eco-environmental issues, the importance of the South Asia region cannot neglect, especially for the belt and road initiative proposed by China (Liu, Citation2015), which is a key point to rebuild the twenty-first century Maritime Silk Road and economic corridor among the South Asian countries (Wu, Citation2016). For sustainable growth in the South Asian countries, tremendous opportunities exist to promote the long-term social and economic management and development (Wu, Citation2016). With this brief background, over the entire South Asia region, in this paper a geo-spatial database on scientific knowledge of the eco-environment was established to gain general and quantitative understanding about the key issues and challenges. The compiled and established geo-spatial database will be helpful for South Asia countries to make right, timely and cost-effective decisions in response to the eco-environmental changes. Beside that the geo-spatial catalog will be benefited for the development of the Belt and Road Initiative.
2. Methodology
2.1. Database compilation and construction
Generally, a comprehensive scientific knowledge information system majorly consists on the basic geo-spatial data and products. In the South Asia region, to overcome the limitation of sparsely field observations, we have compiled and constructed geo-spatial datasets and products from various ways: research papers, public reports, open access datasets, and estimations or simulations from supplementary studies.
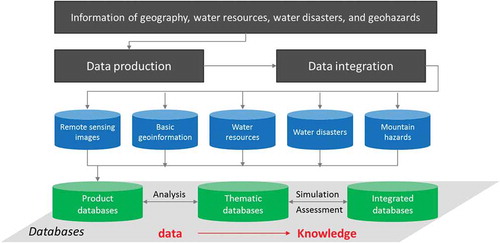
For this research, based on geographic background, water resources, water disasters, and geohazards, we have generated different products databases. With these product databases, the information was integrated and analyzed to generate thematic databases, which were finally applied to models through simulation or assessment to get the integrated databases. In conclusion, the generic flowchart () presents the process from raw data to scientific knowledge. Overall, there are three major functions: data management and organization, information process and application, and data analysis & assessment.
Figure 2. Flowchart of data to knowledge database construction.
2.2. Key elements estimation methods
2.2.1. Water resources elements
To effectively understand the situation of the water resources in South Asia, we used Soil Conservation Service (SCS) model, developed by the United State Soil Conservation Service in 1972, widely used for water resources management, urban storm water modeling and runoff estimation (Liu & Li., Citation2008; Sharma & Singh, Citation1992; Tessema, Lyon, Setegn, & Ulla, Citation2014).
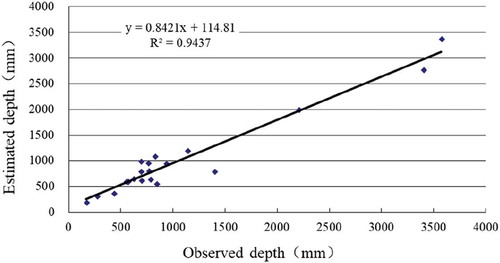
Based on limited observations from meteorological and hydrological stations in South Asia, the SCS model was driven by monthly precipitation and near surface air temperature provided by the climatic research unit of the University of East Anglia (http://www.cru.uea.ac.uk/data), vegetation data from the Moderate Resolution Imaging Spectroradiometer (MODIS) Normalized Difference Vegetation Index product, and soil data from the Harmonized World Soil Database global soil database to simulate the surface runoff of South Asia. The simulation results were validated with the runoff observations from the hydrological stations () collected from the major rivers in the South Asia. A good agreement was observed between the simulation and the observation values with the coefficient of determination (R2) of 0.9437 and the relative error of 16.24% (). It represents the good ability of the method for runoff simulation. With the estimated surface runoff depth, the surface water resources can be assessed with the precipitation and potential evapotranspiration data.
Table 1. Information of hydrological stations used in the validation.
Figure 3. Comparison between the estimated runoff depth by SCS model and the observations from hydrological stations.
2.2.2. Water disaster vulnerability assessment
In recent years, natural disasters (e.g. floods, Earth Quakes, Droughts, Landslides, etc.) have been frequent, resulting in tremendous loss of lives, livelihoods, and properties in the South Asia. Countries like Bangladesh, India, Nepal, and Pakistan exhibit a high level of vulnerability as demonstrated by their lack of coping capacities and adaptive capacities. In the region, there is a typical drought-flood cycle due to the impact from the changing monsoon climate.
To effectively assess the vulnerability of flood and drought in the South Asia, the analytic hierarchy process (AHP) method was applied to build assessment models by using multi-criteria (Zahedi, Citation1986). shows the indicators of the flood and drought risk assessment. The priorities of indicators were determined based on available data and experts’ opinions, while the weights of the indicators were calculated using their importance scales. Based on experts’ opinions, literature review and our calculations, for flood risk assessment, the most important indicators are flooding intensity, flooding frequency, and river network. Comparatively, the drought vulnerability is highly connected with the drought index, precipitation, and temperature. The assessment values (E) of the flood and drought risk were calculated by multiplying the standard values (Ai) and their weights (wi). It can be expressed as below:
Table 2. Indicators for the flood and drought risk assessment.
2.2.3. Geohazard investigation and inventory
Geohazards are natural or human-induced disruptions of the earth surface that may trigger landslides, debris flows, sinkholes, or earthquakes are threats to communities and extensive damage to infrastructure. South Asia is one of the most earthquake-prone regions in the world. Six out of the eight countries in South Asia are located within the seismically active the Hindu Kush Himalayas belt. The seismic ground shaking and associated hazards, such as seismically triggered landslides and debris flows threaten the stability of transportation networks in South Asia.
To get a general idea about the geohazards in South Asia, we selected the most frequent geohazards in South Asia (landslide and debris flow) and identified their geolocations. Visual interpretation was conducted by using high resolution remote sensing data (such as google earth images) combined with topographic maps to get the location, size, and type of each geohazard. Debris flows can be divided into four types according to their occurrence mechanism: rainfall debris flows, rainfall-glacial debris flows, glacial lake outburst debris flows, and freeze-thaw debris flows (Yang, Zhu, Qian, & Hou, Citation2016). The evidence of past geohazards is often masked by vegetation growth which can cover the surface rapidly due to their relatively humid climate in most of this region, sometimes within a few years, making them difficult to identify using high resolution remote sensing data. Therefore, we have identified and included on the inventory maps only the larger and more recent landslides or debris flows.
2.2.4. Geohazard risk assessment
For regional geohazard prevention and risk management, risk assessments of geohazards such as landslides and debris flows have significant meaning. As shown in , the process of the geohazard risk assessment includes following steps: analyzing the geologic and topographic conditions, investigating the occurred geohazards, selecting related hazard factors, and determining their weights to build model for status assessment and prediction assessment.
Figure 4. Flowchart of geohazard risk assessment.
According to the proposed process, we built the assessment criteria system for landslide and debris flow. For landslide and debris flow, lists the indicators used in the geohazard risk assessment model. The Shuttle Radar Topography Mission (SRTM) digital elevation data was selected to extract topographic factors to assist the assessment. In addition, the geologic map was used to get the necessary geologic information of the South Asia region. For the final assessment model, it was constructed based on the AHP method, which was used to determine the weights of the indicators based on their importance on geohazard occurrence and get the final assessment result according to Equation (1).
Table 3. Indicators for the risk assessment of landslide and debris flow.
3. Geographic knowledge about South Asia
3.1. Climatic conditions in South Asia
3.1.1. Air temperature condition
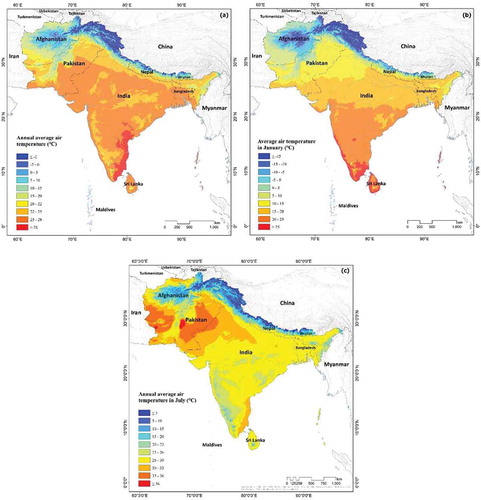
shows the annual average air temperature, air temperature in January, and air temperature in July in South Asia during the last 30 years. The high mountain areas in the north and the plateau in the northwest generally have low air temperature as compared to other parts of the subcontinent. In most parts of the South Asia, the annual average air temperature is above 20°C ()). For the air temperature in January (close to the monthly minimum temperature), the latitude and elevation effects are clearly presented in the map ()). The south part of the region has the highest temperature (above 25°C). While the air temperature in July (close to the monthly maximum temperature) is generally around 30°C with the maximum values occurring majorly in the Indus river basin. The Thar Desert located around the border between India and Pakistan and the desert area close to Iran have the highest temperature (more than 33°C) ()).
Figure 5. Annual average air temperature condition in South Asia. (a) Annual average air temperature; (b) annual average air temperature in January; (c) annual average air temperature in July.
(Source: Worldclim v 1.4, http://www.worldclim.org/current).
3.1.2. Precipitation and drought degree
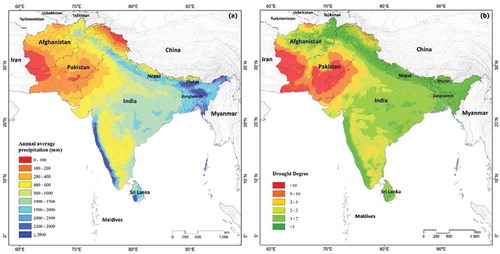
The spatio-temporal distribution of precipitation in the South Asia is highly impacted by the south-western monsoon climate. The high elevation of the Himalayan Mountains concentrates most of the monsoonal rainfall and forces the southwesterly monsoon (rain-bearing) winds to give up most of their moisture before crossing the range northward. The result is heavy precipitation (both rain and snow) on the south slopes varying from 1500 mm in the western Himalayas to more than 3000 mm in the eastern Himalayas (). An increasing trend in rainfall is found from southwest to northeast direction. Meanwhile, heavy rainfall is observed in the western coast of the India due to the effect of the Western Ghats Mountains. It is recorded that more than 3000 mm rainfall in many places of the South Asia. Comparatively, the drought degree has an inverse pattern as to the annual average precipitation. The desert area in the northwestern part is the driest place of the region with the annual precipitation lower than 200 mm. Meanwhile, the rain shadow region of the Western Ghats Mountains also has relative dry condition than other places.
Figure 6. Annual average precipitation (a) and drought degree (b) in South Asia during the last 30 years.
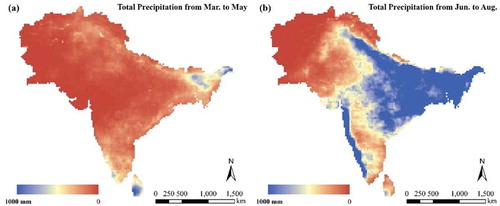
In addition to the imbalance distribution of precipitation in the South Asia, the temporal variability is also significant. As an example, we have taken the TRMM precipitation product in 2008 () in the pre-monsoon season (from March to May), the precipitation is mainly distributed at the northern and eastern part of the Indo-Gangetic Plain and the southern site. Less rainfall is observed in the central area (the Deccan Plateau) and the northwestern area. However, during the monsoon season (June–August), the precipitation over the subcontinent has a significant increase with the maximum of more than 2000 mm (see )). In the monsoon, the Deccan Plateau also has plentiful rainfall (more than 500 mm). However, the rain shadow effect is clearly observed, which confirms the drought degree map shown in ). In the South Asia region, only the northwestern area (Afghanistan and part of Pakistan) have less precipitation.
Figure 7. Total precipitation of (a) dry season (March–May) and (b) monsoon season (June–August) acquired from TRMM precipitation product in 2008 (Li, Zhao, & Deng, Citation2015).
3.2. Land cover
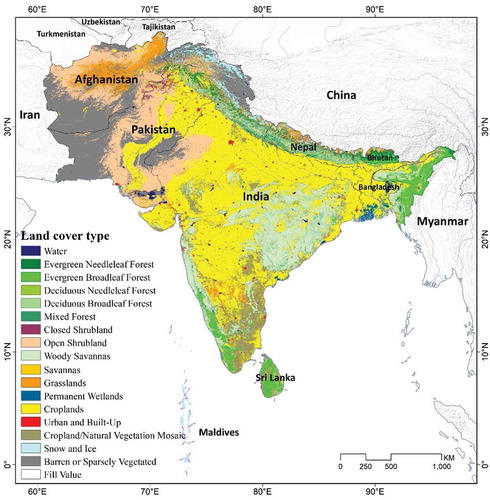
The major land cover types in South Asia are cropland, forest land, grassland, and barren land. According to the land cover map acquired from the MODIS land cover product (MCD12Q1) shown in , large part of South Asia is covered by cropland, including the Indo-Gangetic Plain and a large part of the Deccan Plateau. The areas in the northwest are chiefly covered by grassland and open shrublands, with barren or sparsely vegetated sections. The forests are mostly located along the mountain ranges in the north of the South Asia region. Base on the land cover and land use pattern in South Asia, it is the fact that this region is still predominantly rural. Agriculture plays a central role in South Asian economies, lives, and livelihoods (Atapattu and Kodituwakku Citation2009). Over 70% of its population live in rural areas, the majority of them make their living by dependency on the natural resources that surround them, including land, freshwater, coastal fisheries, and etc. (Stabinsky, Citation2014).
Figure 8. Land cover types in South Asia in 2008.
Source: MODIS 250 m land cover product MCD12Q1.
3.3. Water resource
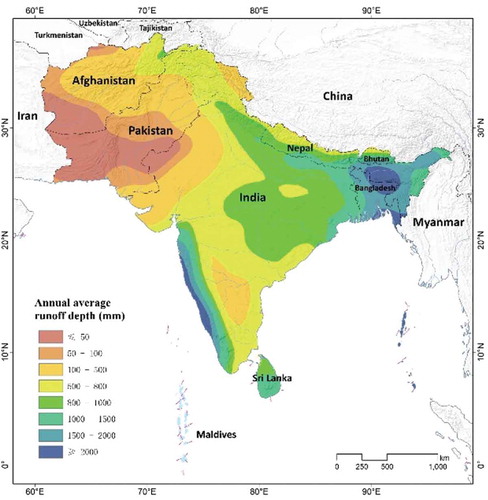
Under the support of the information from the annual average precipitation and potential evapotranspiration of the South Asia, the annual average runoff depth was estimated with the SCS model (). From east to west, a decreasing trend for the annual average runoff depth was record. The highest value (more than 2000 mm) observed in the northeast of India and the north of Bangladesh, and the lowest values are located in the south of Pakistan and Afghanistan. The spatial pattern is highly correlated with the surface evapotranspiration estimation results derived by Zhao, Li, and Deng (Citation2014) and Li et al. (Citation2015). It partly indicates the influence of surface runoff on regional water resource distribution and it will definitely influence the available water resources for each person under the background of huge and unevenly distributed population.
Figure 9. The annual average runoff depth in South Asia.
3.4. Distribution of mountain geohazards
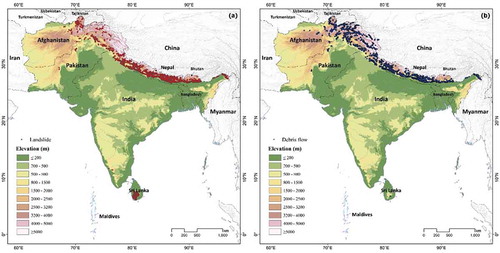
Based on the geohazard investigation method, about 13,439 landslides and 4053 debris flows were identified over the South Asia region. shows the spatial distribution of landslides and debris flows. From the spatial distribution, it can be learned that the occurrences of the geohazards are highly correlated with the topographic conditions. Landslides and debris flows are mainly distributed along the Hindu Kush Himalaya range, meanwhile Sri Lanka also suffers from the geohazards.
Figure 10. Spatial distribution of landslides (a) and debris flows (b).
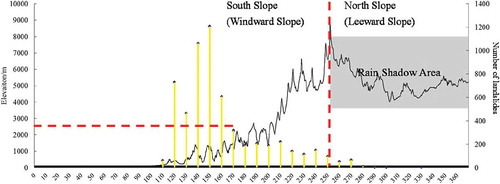
The landslide distribution related to topography in the central Himalaya as shown in , where landslides mainly occur at the south face of the high mountain ranges. The Siwalik hills, an intermittent outermost range of foothills extending across the Himalayan region through Pakistan, India, Nepal, and Bhutan with summits ranging from 1500 to 2000 m asl, occurs most of landslides in these areas. This is partly because of the crumbly texture of its pedology and partly because of the intensity of the regional rainfall. The correlation analysis between the occurrence of landslides and local rainfall characteristics conducted by Dahal and Hasegawa (Citation2008) well indicated the spatial distribution of the landslides in central Himalayan region and described regional aspects of rainfall thresholds for landslides. In contrast, the rain shadow of the high mountain range has few landslides.
Figure 11. Topographically distribution of landslides along the central Himalayas (Zhang et al., Citation2016). Note: The yellow bars represent the number of landslides.
4. View of key eco-environmental issues
4.1. Water scarcity
The depletion of water resources due to climate change or the mismanagement of water resources by the concerned countries has become a looming crisis and a threat to the lives and the livelihoods of the people of the South Asia (Biemans et al., Citation2013). Meanwhile, the precipitation is unevenly distributed throughout the South Asia with the rainfall events varying significantly from year to year and month to month. A study reveals, in the last 60 years, extreme precipitation and the number of dry spells have been increasing (Singh, Tsiang, Rajaratnam, & Diffenbaugh, Citation2014). The extremes of rainfall and dry season cause severe drought and flood disasters which gravely threaten the agricultural production, economic development and social security of the countries in South Asia (Auffhammer et al., Citation2012; Mirza, Citation2011).
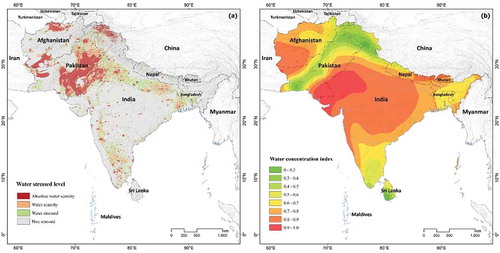
Based on the per capita water availability, the water conditions in the South Asia are categorized according to the Falkenmark Water Stress Indicator as: no stress, stress, scarcity, and absolute scarcity. The index thresholds 1700, 1000, and 500 m3 per capita per year are used to define the water stressed, scarce, and absolute scarce areas, respectively (Falkenmark, Citation1989). ) shows the water stress map of the South Asia. In the water availability map, the severe water shortage areas are the Indo-Gangetic plain, the west edge of the Deccan Plateau, and part of the desert areas in Afghanistan. In addition, the water resources distribution concentration index in most parts of the South Asia has a relatively high value, especially for the central part ()). This pattern also indicates that the imbalance distribution of water resources, which is the key character of water resources in the South Asia and worsens the water scarcity problem in this region.
Figure 12. (a) Water resource stress map and (b) concentration index map of the South Asia.
In addition to the analysis at the subcontinent scale, the water stress comparison at the country scale is reflected by the water use intensity listed in . Pakistan has the highest water use intensity (82.36%). It suggests that Pakistan has the serious problem in water resource shortage. However, with the rapid increase in population, this problem will be more and more serious. In contrast, the situation of water scarcity is better for other countries. However, the water use intensities in India and Afghanistan also keep to relatively high values (40.12% and 31.34%).
Table 4. Country level water use intensity in the South Asia.
4.2. Transboundary rivers induced water resource conflict
In the South Asia region, the uttermost sources of water are the Himalayas which consist on various river systems including three major transboundary basins: Indus, Ganges, and Brahmaputra. The Indus basin connects China, Afghanistan, Pakistan, and India, while the Brahmaputra and the Ganga connect China, Bhutan, India, Nepal, and Bangladesh. Therefore, the transboundary water security has become an important issue in the South Asia.
In order to compare the differences among countries regarding their dependences on external water resources, the dependency ratio is used to indicate the part of the water resources originating outside the country. It can be expressed as:
where IRWR = internal renewable water resources; IWR = total volume of incoming water resources from neighboring countries.
In , we have listed the estimated IRWR, IWR, and the dependency ratio of each country in South Asia. It is clear that Pakistan and Bangladesh are of the highest dependency ratio (91.4% and 82.8%) to the external water resources from neighboring countries. India and Afghanistan also have a high percentage (above 30%). shows the good agreement can be found between our estimations and the reported values from the Food and Agriculture Organization (FAO) (Nations, The Food and Agriculture Organization of the United, Citation2010). The high dependency indirectly reflects the transboundary river issue and imposes a potential threat to water resource conflict in the South Asia.
Table 5. Water resources dependency ratio in the South Asia.
Figure 13. Scatter plot between the estimated dependency ratio and the values provided by FAO.
4.3. Soil degradation
Generally, the land resources in the South Asia can be categorized into three parts: the high Himalayas, the Indo-Gangetic Plain, and the Deccan Plateau, similar to the topographical definition of the region. Among ecoregions, variability exists in terms of topography, climate and ecosystem, soil types. The predominant soils are Alfisols and Vertisols for the semi-arid, Inceptisols and Entisols for the alluvial plains, Aridisols for the deserts, and Ultisols for the humid climates (Lal, Citation2006).
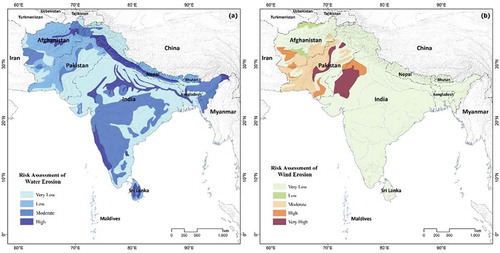
In recent 20 years, it has been reported, the South Asia are prone to soil degradation and desertification (Acharya & Kafle, Citation2009; Young, Citation1994). The major processes of soil degradation in this region are water erosion, wind erosion, nutrient depletion, salinization, and water logging. The FAO report published in 1994 clearly shows the extent of the degradation in the South Asia (Young, Citation1994). It also indicated that water erosion and wind erosion are the most serious degradation process in the South Asia.
According to the statistics, the water erosion threated soil area in the South Asia is almost 55 million ha, and about 25% is cropland or grassland. ) shows the spatial distribution map of water erosion in the South Asia. Most serious eroded areas are the low mountain area along the north mountain range and the plain along the Ganges river. Comparatively, the wind erosion areas are only distributed at the desert areas of India, Pakistan, and Afghanistan ()).
Figure 14. Intensity map of (a) water erosion and (b) wind erosion in the South Asia.
4.4. Increasing threats from water disasters
It is well known that the Himalayan ecosystem sustains a large number of people living in the floodplains of the main rivers. The Himalaya mountain belt and the monsoon climate block the water vapor transfer and causes intense rainfall, which often leads to flooding in the downstream areas and the occurrences of geohazards including landslide and debris flow. In addition, during the dry season, droughts are frequently occurred in the South Asia. The hardest hitting countries are India, Afghanistan, and Pakistan. The worst drought in this century happened in India in July, 2000, which has affected about 130 million people, nearly 15% of its entire population. But the situation is more critical in Afghanistan and Pakistan, where millions of people are at risk but with fewer resources.
4.4.1. Drought
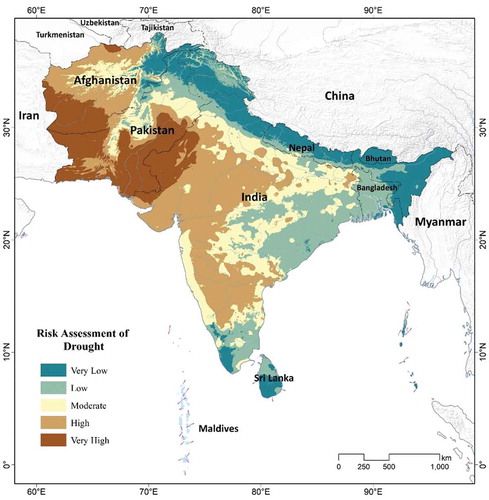
In the South Asia, drought occurs frequently in arid and semi-arid regions. From early 2000 onwards, severe droughts affected vast areas of the South Asia, including western India, and southern and central Pakistan. The South Asian region has been among the perennially drought-prone regions of the world. India, Pakistan and Sri Lanka have reported droughts at least once in every 3 years in the past five decades, while Bangladesh and Nepal also suffer from frequent droughts. Severe droughts mostly occur in the pre-monsoon and post-monsoon. The pre-monsoon drought occasionally extend throughout the monsoon period due to late onset of monsoon and weak monsoon activities (Chowdhury, Citation2003; Singh et al., Citation2014; Ummenhofer, D’Arrigo, Anchukaitis, Buckley, & Cook, Citation2013). shows the drought risk assessment result based on the proposed assessment method. The map indicates, the west and southwest part of the South Asia have extremely high drought risk, including the Indus plain, the Thar desert, and the Baluchistan Plateau. In addition, the western part of the Deccan Plateau also has high drought risk.
Figure 15. Drought risk assessment in the South Asia.
4.4.2. Flood
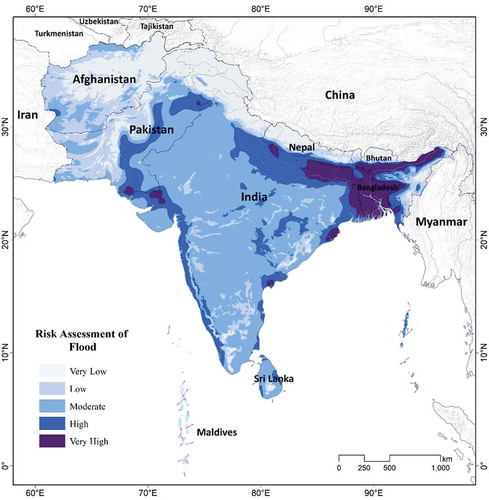
Flooding is the most frequently occurring disaster in the South Asia. Except Bhutan and Maldives, all countries in this region are subject to considerable and partly extreme flood risk, and Pakistan is the country with the most serious impacts from floods. In 2010 and 2011, there are two subsequent devastating unprecedented flood events occurred in Pakistan affecting over 29 million people (Gaurav, Sinha, & Panda, Citation2011; Sayama, Ozawa, Kawakami, Nabesaka, & Fukami, Citation2012). According to Pakistan government data, the 2010 Pakistan floods directly affected about 20 million people, mostly by destruction of property, livelihood, and infrastructure, with a death toll of close to 2000 people. The impacts from floods on India are also very significant. About 20 million people are affected annually, and floods in the Indo-Gangetic-Brahmaputra plains are an annual feature. In addition, over 12% of Indian land is prone to floods (Deeptha, Sathyanathan, Dinesh, & Harshit Kumar, Citation2017).
illustrates the flood risk assessment result of the whole region. The most dangerous places for flood occurrence are the Indo-Gangetic-Brahmaputra plains, especially the downstream of the Ganges river and Brahmaputra river. In addition, the west coast of India also has a high dangerous level due to its plenty rainfall. Pakistan, India, and Bangladesh are the three countries highly prone to floods. Floods in the South Asia are mainly driven by the unique hydro meteorological and monsoonal influences in the region. As known, there are two monsoonal windows in the South Asia, the southwest monsoon in the summer months and the northeast monsoon in the winter months. The southwest monsoon generally prevails from June to September and accounts for nearly 70–80% of the rainfall of the year. The significant spatial and temporal variations in rainfall throughout the region are the main reasons. In addition, owing to the global warming impacts, melting of glaciers in the Hindu Kush Himalayas region may give rise to increase in flash floods in the mountainous regions and those places located at the foothills.
Figure 16. Flood risk assessment in South Asia.
4.5. High geohazard risk along the Hindu Kush Himalayas region
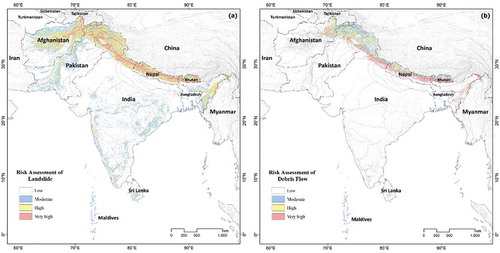
Based on the investigated geohazards, two risk assessment models were constructed for landslide and debris flow by considering the factors from topography, geology, human activities, triggering factors such as precipitation and earthquake. shows the risk assessment results, and the highest risk areas are the high mountain region in the north. Nepal and Bhutan are the two countries seriously impacted ()). The results are coincided with the trend analysis about landslide occurrence in Nepal conducted by Petley et al. (Citation2007). Landslides represent a major constraint on local development. Comparatively, the affected area of landslide is relatively larger than that of debris flow. Eastern Ghats and Western Ghats ranges in India and the Sulaiman and Saged koh Ranges in the west of Pakistan also have medium risk in landslide hazards ()).
Figure 17. Geohazard risk assessment in the South Asia: (a) Landslide and (b) debris flow.
5. Conclusions and perspectives
By briefly analyzing the situation of the eco-environment in the South Asia, this study brought an important insight about the key issues related to land and water resources and environment in this region. Common eco-environmental problems are rising with the big demand from economic development and intensive human activities, such as land degradation, water scarcity, and mountain geohazards. Due to the limitation of data, some environmental issues or natural disasters such as deforestation, biodiversity loss, air pollution, earthquake, heatwaves, and cyclone-flooding are not discussed in current study. However, the knowledge database established in this study not only provided the necessary databases related to the general geographic situation and spatial patterns of the major surface elements, but also presented an important geo-spatial view about the risks connecting to water resources and some important natural disasters in this region.
Under the background of global climate change, the South Asia region is becoming more and more vulnerable as compared to any other regions due to its huge population and poverty (Auffhammer et al., Citation2012; Jerry, Tim, Andre, & Tim, Citation2012). Abnormal monsoon patterns and more frequent and intense storms have aggravated the impacts from natural disasters (like flood and drought) and climate change in recent years (Singh et al., Citation2014; Turner & Annamalai, Citation2012). In addition, the mountain ecosystems of the South Asia, which are highly vulnerable to fragmentation, particularly sensitive to climate changes due to the short distances in which climatically different climate zones and microhabitats occur.
Therefore, continuous effects should be payed to conduct prudent management of its fragile and excessively exploited ecosystems. Meanwhile, sound governance in each South Asian country, peace and cooperation with neighbors, and an enabling global context are the essential prerequisites of a sustainable, prosperous future for this region. Currently, many efforts have been focused on this region. The South Asia Water Initiative is a multi-donor trust fund managed by the World Bank established in 2009. It focuses on the river basins of the major rivers in South Asia, to support countries to improve and deepen transboundary dialog, enhance the river basin and water resources knowledge, strengthen water institutions, and support investments that lead to sustainable, fair and inclusive development. There is also the South Asia Disaster Risk Management Programme, an initiative of the World Bank and the United Nations International Strategy for Disaster Reduction, which aims to prepare a simplified quantitative risk assessment to determine the social and economic loss potential and likelihood of occurrence of the different hazards at country and regional level.
In addition, some social organizations are also established to cope with eco-environmental issues. For example, Climate Action Network South Asia is a coalition of 149 civil society organizations from the eight South Asian countries promoting equity and sustainable development in the design and development of an effective global strategy to reduce greenhouse gas emissions and ensure its implementation. Besides the above-mentioned activities, there are many others not included here. The regional cooperation between the countries in the South Asia is also crucial, urgent, and necessary to the future of this region. As a major source of many big transboundary rivers in the South Asia, China plays an important role to promote regional water resource sharing, management, and cooperation under the belt and road initiative (Guo et al., Citation2017; Lappalainen et al., Citation2018). As an expectable prospect, the Belt and Road Initiative proposed by China may bring the big opportunity for this area to resolve such eco-environmental issues through the closer international cooperation and deeper social development than before, like building the China-Pakistan Economic Corridor (CPEC) and Bangladesh-China-India-Myanmar Economic Corridor (BCIM) or even the potential China-Nepal-India Economic Corridor (CNIEC).
Data availablilty statement
The data referred to in this paper is not publicly available at the current time.
Disclosure statement
No potential conflict of interest was reported by the authors.
Additional information
Funding
References
- Acharya, A. K., & Kafle, N. (2009). Land degradation issues in Nepal and its management through agroforestry. Journal of Agriculture and Environment, 10, 133–143.
- Atapattu, S. S., & Kodituwakku, D. C. (2009). Agriculture in South Asia and its implications on downstream health and sustainability: A review. Agricultural Water Management, 96(3), 361–373.
- Auffhammer, M., Ramanathan, V., & Vincent, J. R. (2012). Climate change, the monsoon, and rice yield in India. Climatic Change, 111(2), 411–424.
- Biemans, H., Speelman, L. H., Ludwig, F., Moors, E. J., Wiltshire, A. J., Kumar, P., … Kabat, P. (2013). Future water resources for food production in five South Asian river basins and potential for adaptation—A modeling study. Science of the Total Environment, 468–469(Supplement), S117–S31.
- Chowdhury, M. R. (2003). The El Niño-Southern Oscillation (ENSO) and seasonal flooding – Bangladesh. Theoretical and Applied Climatology, 76(1), 105–124.
- Dahal, R. K., & Hasegawa, S. (2008). Representative rainfall thresholds for landslides in the Nepal Himalaya. Geomorphology, 100(3), 429–443.
- Deeptha, V. T., Sathyanathan, R., Dinesh, R., & Harshit Kumar, L. (2017). Natural disaster management in India with focus on floods and cyclones. IOP Conference Series: Earth and Environmental Science, 80(1), 012054.
- Falkenmark, M. (1989). The massive water scarcity now threatening Africa – why isn’t it being addressed? Ambio, 18(2), 112–118.
- Gaurav, K., Sinha, R., & Panda, P. K. (2011). The Indus flood of 2010 in Pakistan: A perspective analysis using remote sensing data. Natural Hazards, 59(3), 1815.
- Guo, H., Qiu, Y., Massimo, M., Chen, F., Zhang, L., Ishwaran, N., … Liang, D. (2017). DBAR: International Science Program for sustainable development of the belt and road region using Big Earth Data. Bulletin of Chinese Academy of Sciences, 32(Z1), 2–9.
- Jerry, K., Tim, H., Andre, D., & Tim, W. (2012). Climate change impacts on crop productivity in Africa and South Asia. Environmental Research Letters, 7(3), 034032.
- Kale, V. S. (2014). Is flooding in South Asia getting worse and more frequent? Singapore Journal of Tropical Geography, 35(2), 161–178.
- Lal, R., Peterson, G., Unger, P., Payne, W. (2006). Dryland farming in South Asia. In Dryland agriculture (pp. 527–576). Madison, WI: American Society of Agronomy, Crop Science Society of America, Soil Science Society of America.
- Lappalainen, H. K., Kulmala, M., Kujansuu, J., Petäjä, T., Mahura, A., de Leeuw, G., … Huadong, Guo. (2018). The Silk Road agenda of the Pan-Eurasian Experiment (PEEX) program. Big Earth Data, 2(1), 8–35.
- Li, A., Zhao, W., & Deng, W. (2015). A quantitative inspection on spatio-temporal variation of remote sensing-based estimates of land surface evapotranspiration in South Asia. Remote Sensing, 7(4), 4726–4752.
- Liu, W. (2015). Scientific understanding of the belt and road initiative of China and related research themes. Progress in Geography, 34(5), 538–544.
- Liu, X., & Li., J. (2008). Application of SCS model in estimation of runoff from small watershed in Loess Plateau of China. Chinese Geographical Science, 18(3), 235.
- Mirza, M. M. Q. (2011). Climate change, flooding in South Asia and implications. Regional Environmental Change, 11(1), 95–107.
- Nations, The Food and Agriculture Organization of the United. 2010. “Total renewable water resources.” In. Viale delle Terme di Caracalla 00153 Rome, Italy.
- Pant, G. B., & Kumar, K. Rupa. (1997). Climates of south Asia. Chichester, UK: John Wiley & Sons, ISBN 0-471-94948-5.
- Petley, D. N., Hearn, G. J., Hart, A., Rosser, N. J., Dunning, S. A., Oven, K., & Mitchell, W. A. (2007). Trends in landslide occurrence in Nepal. Natural Hazards, 43(1), 23–44.
- Rasul, G. (2014). Food, water, and energy security in South Asia: A nexus perspective from the Hindu Kush Himalayan region. Environmental Science & Policy, 39, 35–48.
- Sayama, T., Ozawa, G., Kawakami, T., Nabesaka, S., & Fukami, K. (2012). Rainfall–Runoff–Inundation analysis of the 2010 Pakistan flood in the Kabul River basin. Hydrological Sciences Journal, 57(2), 298–312.
- Sharma, K. D., & Singh, S. (1992). Runoff estimation using Landsat thematic mapper data and the SCS model. Hydrological Sciences Journal, 37(1), 39–52.
- Sheikh, M. M., Manzoor, N., Ashraf, J., Adnan, M., Collins, D., Hameed, S., Manton, M. J., … Shrestha, M. L. (2015). Trends in extreme daily rainfall and temperature indices over South Asia. International Journal of Climatology, 35(7), 1625–1637.
- Singh, D., Tsiang, M., Rajaratnam, B., & Diffenbaugh, N. S. (2014). Observed changes in extreme wet and dry spells during the South Asian summer monsoon season. Nature Climate Change, 4(6), 456–461.
- Stabinsky, D. 2014. “Defining Role of Agriculture in South Asia.” In. Dhaka, Bangladesh.
- Tessema, S. M., Lyon, S. W., Setegn, S. G., & Ulla, M. (2014). Effects of different retention parameter estimation methods on the prediction of surface runoff using the SCS curve number method. Water Resources Management, 28(10), 3241–3254.
- Turner, A. G., & Annamalai, H. (2012). Climate change and the South Asian summer monsoon. Nature Climate Change, 2(8), 587.
- Ummenhofer, C. C., D’Arrigo, R. D., Anchukaitis, K. J., Buckley, B. M., & Cook, E. R. (2013). Links between Indo-Pacific climate variability and drought in the Monsoon Asia Drought Atlas. Climate Dynamics, 40(5), 1319–1334.
- Wu, Z. (2016). South Asia and the belt and road initiative: opportunities, challenges, and prospect. In China’s belt and road initiatives and its neighboring diplomacy (pp. 177–202), Edited By Zhang, J. World Scientific, ISBN: 978-981-3140-20-2.
- Yang, Z., Zhu, Y., Qian, S., & Hou, K. (2016). Types and space distribution characteristics of debris flow disasters along China-Pakistan Highway. The Electronic Journal of Geotechnical Engineering, 21, 191–2000.
- Young, A. 1994. “Land degradation in South Asia: Its severity, causes and effects upon the people.” In World soil resource, 100. Rome, Italy.
- Zahedi, F. (1986). The analytic hierarchy process—A survey of the method and its applications. Interfaces, 16(4), 96–108.
- Zhang, J. Q., Liu, R. K., Deng, W., Khanal, N. R., Gurung, D. R., Sri Ramachandra Murthy, M., & Wahid, S. (2016). Characteristics of landslide in Koshi River Basin, Central Himalaya. Journal of Mountain Science, 13(10), 1711–1722.
- Zhao, W., Li, A., & Deng, W. (2014). Surface energy fluxes estimation over the South Asia subcontinent through assimilating MODIS/TERRA satellite data with In Situ observations and GLDAS product by SEBS model. IEEE Journal of Selected Topics in Applied Earth Observations and Remote Sensing, 7(9), 3704–3712.