
ABSTRACT
In recent days, discrimination diagrams have been widely used for tracing the tectonic settings and origins of basalts from orogenic belts. However, conventional discrimination diagrams are not accurate enough. Here, we reported six new discrimination diagrams obtained from the global database using data mining methods. For most individual diagrams, island arc basalt can be nearly 100% was identified, whereas ocean island basalt and mid-ocean ridge basalt can be discriminated from each other with less than 10% of overlap, under a confidence coefficient of 85%. Using the six new discrimination diagrams together, basalts of different origins can be efficiently identified.
1. Introduction
Basalt is one of the most popular rock types, covering over 70% of the Earth’s surface. It forms in mid-ocean ridges, island arcs, ocean islands, rifting valleys, and back-arc basins. During plate subduction and collision, basalts are often entrained in orogenic belts. It has been a fashion to reveal the tectonic settings of basalts using discrimination diagrams since the 1970s.
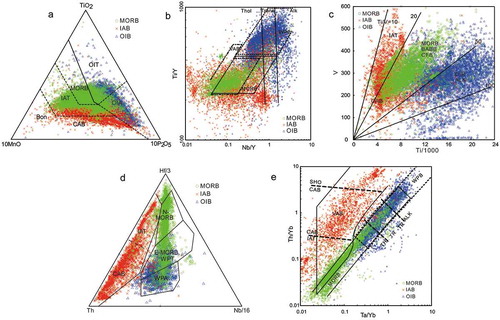
Basalt discrimination diagrams are based on mantle heterogeneities. Namely, the geochemical characteristics of basalts are controlled by their mantle source and consequent magma evolution, whereas mantle sources reflect the tectonic settings. Therefore, the major and trace elements compositions of basalts reflect the tectonic settings. Most of the conventional discrimination diagrams were constructed in the 1970–1980s, using samples with known tectonic settings (Capedri et al., Citation1980; Glassley, Citation1974; Harris, Pearce, & Tindle, Citation1986; Pearce, Citation1982; Pearce, Citation1984; Pearce & Cann, Citation1973; Pearce, Gorman, & Birkett, Citation1977; Pearce & Norry, Citation1979; Wood, Citation1979; Wood, Citation1980). shows that most of the early discrimination diagrams are invalid, except those diagrams related to Ta and Th, which still have a good discriminant effect on distinguishing island arc from non-island arc (Jiao et al., Citation2018; Liu et al., Citation2017). These diagrams have made major contributions to studies on plate tectonics and orogenic belts, with thousands of citations. Due to the advantages of solid theory and expression, discrimination diagrams soon became popular all over the world. However, the discrimination diagrams have been challenged by many researchers (Li, Arndt, Tang, & Ripley, Citation2015). Although, in this case, there are still some scholars working tirelessly to put forward some new discrimination diagrams (e.g. Agrawal, Guevara, & Verma, Citation2008; Saccani, Citation2015; Vermeesch, Citation2006, Citation2013; Verma et al., Citation2013), it is still difficult to solve the dilemma. Recently, many scholars have tried to use the big data method (machine learning, neural network, and artificial intelligence, etc.) to carry out this research and have achieved positive results(Jiao et al., Citation2018; Liu, Zhu, & Zhou, Citation2018; Wang & Zou, Citation2018; Zhou et al., Citation2018a, Citation2018b; Zhang & Zhou, Citation2017, Citation2018; Zhang, Ye, Wang, & Du, Citation2018). It appears that using the big data method, starting with the correlation relation, can make the discrimination diagrams out of the bottleneck and enter into a new stage.
Figure 1. Some classical basalt tectonic environment discrimination maps commonly used in the literature (according to Liu et al., Citation2017). (a) TiO2-MnO-P2O5(Mullen, Citation1983); (b) Ti/Y-Nb/Y (Pearce, 1982); (c) V-Ti (Shervais, Citation1982); (d) Ta-Th-Nb(Ta) (Wood, Citation1980); (e) Th/Yb-Ta/Yb (Pearce, 1982).
For this reason, we studied global mid-ocean ridge basalt (MORB), ocean island basalt (OIB), and island arc basalt (IAB) data from Geochemistry of Rocks of the Oceans and Continents (GEOROC) and PetDB database, using data mining methods. Based on these methods, six new highly efficient discrimination diagrams have been obtained.
2. Methods
All of the experimental data were obtained from two geological databases, namely GEOROC and PetDB, and have been screened before taken into experiment. First, the data of intrusive rocks have been filtered out. The concentration of SiO2 in volcanic rocks is limited to 45–54%. Second, in order to eliminate the impact of interaction between mantle plume and mid-ocean ridge, all the samples from an ocean island that is overlapped with a spreading ridge were deleted according to their longitude and latitude information. The island arc is included in the convergent margin tectonic setting, so in order to pick the island arc samples out we reviewed all the 1709 literatures related to convergent margins and removed 309 of them that do not belong to island arc which belong to back-arc basin, rift, ocean island, ocean plateau, active continental margins, and continental crust. Finally, 10,930 island arc data were selected from 100,195 convergent margin samples in the whole GEOROC database.
(1) Draw the confidence ellipse
The confidence ellipse is also known as error ellipse, which is a geometric representation of the difference between the value and expectation of the point or mean function. By the use of linear algebra knowledge, the covariance matrix of the data point is calculated, and the eigenvalues and eigenvectors of the matrix can be used to determine the axial length and direction of the confidence ellipse while the ellipse center is obtained by the mean value of all data. Then, the confidence ellipse can be drawn when the confidence interval is given.
(2) Calculate the overlap rate
The overlap rate indicates the overlapped degree between two data regions (confidence ellipses) and usually calculated by the Monte Carlo method. A sufficient number of data points (shown as x, y) are randomly generated within the range of coordinate system, and the location of the points are determined by the confidence ellipse equation (inner or out of the ellipse), then the overlap rate between the ellipses can be calculated by counting the overlapped points.
(3) Choose the best coordinate combination
According to the overlap rate of the confidence ellipse, the best coordinate combination can be selected from all the possible coordinate systems.
(4) Use support vector machine (SVM) to evaluate the discrimination diagrams
SVM is a kind of supervised machine learning method, which is widely used in statistical classification and regression analysis. By using the SVM module of the Scikit-Learn library to train the selected combination, the prediction accuracy would finally be given to evaluate the quality of the discriminant diagrams.
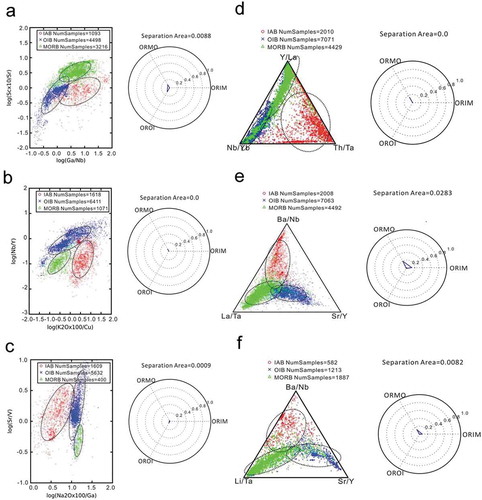
In the present study, 4 main elements and 34 trace elements were chosen to conduct statistical analysis, and more than 400,000 coordinate combinations were obtained. Then, we drew confidence ellipses in accordance with 85% of confidence interval among all the above combinations. After that, the overlap rate of confidence ellipses was calculated using Monte Carlo randomly obtained points system. Then, the best discriminant diagrams were selected from all possible coordinate combinations according to their minimal overlap rates ().
Figure 2. Discrimination diagrams for tectonic settings of basalts. (a) Sc × 10/Sr vs. Ga/Nb; (b) Nb/Y vs. K2O × 100/Cu; (c) Sr/V vs. Na2O × 100/Ga; (d) Y/La-Nb/Yb-Th/Ta; (e) Ba/Nb-La/Ta-Sr/Y; (f) Ba/Nb-Li/Ta-Sr/Y.
3. Results
In a Sc × 10/Sr vs. Ga/Nb diagram, IABs and MORBs are totally separated, whereas there are about 10% of overlap between OIBs and IABs, OIBs and MORBs, under a confidence of 85% ()). In a Nb/Y vs. K2O × 100/Cu diagram ()), IABs can be totally discriminated from OIBs and MORBs, whereas there is less 5% of overlap between MORBs and OIBs.
In a logarithm diagram of Sr/V vs. Na2O × 100/Ga ()), IABs, MORBs, and OIBs can be discriminated from each other, with no overlap between OIBs and IABs, and less than 5% of overlap for MORBs vs. OIBs and IABs, respectively.
In a Y/La-Nb/Yb-Th/Ta ternary chart ()), MORBs are concentrated toward Y/La, OIBs toward Nb/Yb, whereas IABs toward Th/Ta. IABs is well discriminated from MORBs and OIBs, whereas there is less than 20% of overlap between MORBs and OIBs. The ternary charts of Ba/Nb-La/Ta-Sr/Y ()) and Ba/Nb-Li/Ta-Sr/Y ()) are essentially the same except La/Ta and Li/Ta are used, respectively. IABs have higher Ba/Nb, OIBs have higher La/Ta and Li/Ta, and MORBs have higher Sr/Y. These two discrimination diagrams are not very efficient, with 20% of overlap between MORBs and OIBs.
4. Discussion
Tectonic settings discrimination diagrams were developed based on geochemistry and plate tectonic theory. It depends heavily on analytical techniques of trace elements, petrogenesis of basalts, and has been widely used in petrological studies. The construction of discrimination diagrams, however, requires high quality data of samples with clear tectonic settings. Conventional discrimination diagrams for tectonic settings of basalts were based on plate tectonic theory. According to plate tectonic theory, MORBs come from the depleted mantle, whereas OIBs come from the enriched lower mantle, and IABs come from depleted upper mantle (Pearce et al., Citation1984; Wilson, Citation1989). The current data compilation shows that MORB can be a bit more enriched, suggesting that the upper mantle is not totally depleted. The trace elements compositions of MORB vary dramatically, indicating that the MORB source is not homogenous and MORB magmas experienced magma chamber processes at shallow depths (Sun, Nesbitt, & Sharaskin, Citation1979; Wilson, Citation1989; Zindler & Hart, Citation1986). OIB is generally originated from the lower mantle, based on mantle plume hypothesis (Davies & Bunge, Citation2006; Morgan, Citation1972; White, Citation2010). Others suggested that OIB comes from the upper mantle (Anderson, Citation2000; Ballmer, van Hunen, Ito, Bianco, & Tackley, Citation2009; Meibom & Anderson, Citation2004). In fact, the mantle sources of OIB are highly heterogeneous, implying multiple origins, including enriched lower mantle, primitive mantle, ancient recycled oceanic crust (basalt + sediments), depleted asthenospheric mantle (MORB source), depleted oceanic lithosphere, recycled subcontinental lithosphere, and recycled seamounts, etc. (Castillo, Citation2015; Day, Pearson, Macpherson, Lowry, & Carracedo, Citation2009; Jackson et al., Citation2007; Niu & O’Hara, Citation2003; Niu, Citation2009; Zindler & Hart, Citation1986).
The discrimination diagrams provided in this contribution are more efficient than conventional diagrams. First of all, the discrimination diagrams recommended in this paper are different from the previous discrimination diagrams. We use global data, including altered samples, so it is more universal. Second, under 85% confidence elliptic background (a few inaccurate data are filtered out), the discrimination efficiency is significantly improved. It involves elements that were not popularly used, e.g. Sc, Sr, Ga, and Nb which are used in ). Sc is incompatible in olivine, plagioclase, and spinel, but is compatible in pyroxene, amphibole, and garnet. During partial melting, all the sources of MORB, OIB, and IAB are dominated by olivine and pyroxene. Nevertheless, MORB melting occurs mostly in the spinel stability field, whereas OIB may form in the presence of garnet. Consequently, OIB has lower Sc/Sr ratios. IAB has amphibole in the source, with influences from garnet (eclogite), therefore, IAB also has lower Sc/Sr compared to MORB. The high values of MORB are partially due to the depleted mantle source, which has lower incompatible element, Sr, and reasonable compatible element, Sc. In addition, Sc is compatible in garnet, therefore, the presence of garnet in OIB and IAB sources and the absence of garnet in MORB sources lead to depletion of Sc in OIB and IAB compared to MORB.
The most dramatic difference of IAB compared to MORB and OIB during fractional crystallization is the water-rich magmas of IAB. High water contents lower the solidus line of plagioclase and increase that of amphibole, so that amphibole crystalizes earlier than plagioclase (Alonso-Perez, Müntener, & Ulmer, Citation2009). Strontium is compatible in plagioclase, but is moderately incompatible in amphibole, and is highly incompatible in other minerals. Gallium is similar to Al, belonging to IIIA group in the Periodic Table. Gallium is compatible in plagioclase, amphibole, and magnetite, but moderately incompatible in other minerals. Niobium is a highly incompatible element in the mantle, but is highly compatible in rutile during plate subduction (Xiao et al., Citation2006), which plausibly explains the typical Nb, Ta negative anomalies in IAB.
As for the Nb/Y vs. K2O × 100/Cu diagram ()), OIB has high Nb/Y because it is enriched in Nb with low Y due to garnet in the source, such that it is discriminated from IABs and MORBs. IABs are strongly depleted in Nb and Y, and thus IABs and MORBs have similar Nb/Y. OIBs have a higher Nb/Y, because garnet enrichment in the source rock is Nb, and Y is lower, which distinguishes it from IABs and MORBs. IABs are enriched in K2O, because of addition of continental materials through plate subduction. The average K2O content of IABs is 2.93 wt%, which is much higher than that of OIBs and MORBs (0.86 and 0.2 wt%, respectively). Copper is a moderately incompatible chalcophile element (Lee et al., Citation2012; Sun, Arculus, Bennett, Eggins, & Binns, Citation2003b; Sun, Arculus, Kamenetsky, & Binns, Citation2004; Sun, Bennett, Eggins, Arculus, & Perfit, Citation2003a). Copper concentrations in MORBs and IABs are comparable, ranging from 87 to 123 ppm. Therefore, IABs can be clearly distinguished from MORBs in ).
As for the Sr/V vs. Na2O × 100/Ga diagram ()), Sr is incompatible and is high in IABs and OIBs (with average values of about 470 and 480 ppm). High Sr concentration in IABs is likely due to late crystallization of plagioclase suppressed by high water contents (Alonso-Perez et al., Citation2009), whereas the high Sr in OIBs reflects an enriched mantle source. MORBs are depleted in incompatible elements, such that have low Sr (about 138 ppm in average). Vanadium is a transition element. Its concentration does not vary much among the three major basalts (269–302 ppm). Thus, Sr/V can efficiently separating MORBs from OIBs and IABs. IABs have low Na2O (1.12 wt% in average), whereas MORBs and OIBs have higher Na2O (2.68 and 2.86 wt% in average). In contrast, Ga concentrations of the three basalts do not vary much. Namely, IABs and MORBs have very different Na2O/Ga ratios. Therefore, MORBs, OIBs, and IABs can be clearly distinguished from each other in a Sr/V vs. Na2O × 100/Ga diagram.
In the Y/La-Nb/Y-Th/Ta diagram ()), OIBs are enriched in Y so its Y/La ratio is lower than MORBs, such that MORBs are concentrated toward Y/La. OIBs are enriched in Nb and depleted in Yb, so it has high Nb/Yb. And IABs are depleted in Ta which leads to its high Th/Ta ratio and concentrated toward Th/Ta. Therefore, IABs can be clearly distinguished from OIBs and MORBs in this ternary diagram.
Diagrams Ba/Nb-La/Ta-Sr/Y ()) and Ba/Nb-Li/Ta-Sr/Y ()) are based on similar principle. IABs are enriched in Ba due to their high mobility during plate subduction, but it is depleted in Nb because Nb is the least mobile element during plate subduction, retained by rutile (Xiao et al., Citation2006). Therefore, IABs are characterized by high Ba/Nb. As a result of source characteristics, OIBs are enriched in Nb, with the highest Nb concentrations among all rock types. OIBs have the lowest La/Ta (Li/Ta) and MORBs have the lowest Sr/Y. Therefore, MORBs, OIBs, and IABs concentrated in three corners in the two ternary diagrams.
Basalt discrimination diagrams started in the 1970s and rapidly became popular during the development of plate tectonics, which promoted studies on the tectonic environment, petrogenesis of basalts, and geodynamics. As a result of dramatic progress in analytical techniques, more and more data have been accumulated. Many of these discrimination diagrams often provide wrong results, and these have been challenged and even discarded. Some of the geoscientists even proposed that no discrimination diagrams should be used. Although many new discrimination diagrams have been published (e.g. Saccani, Citation2015; Vermeesch, Citation2006, Citation2013), the situation did not change much. Conventional methods (e.g. sampling survey, empirical models, etc.) have difficulties to deal with Big Data.
In this contribution, we find much better discrimination diagrams using data mining method to deal with the whole dataset so far available to us. The whole dataset contains data analyzed in different laboratories, at different time, using different methods and instruments, which cannot be compared directly. To solve this problem, we filtered the data using 85% of confidence coefficient and then established several reliable tectonic environmental discrimination diagrams for basalt ().
Many of the criteria (e.g. Sc/Sr, Ga/Nb, K2O/Cu, Sr/V, and Na2O/Ga) have not been popularly used in basalts discrimination diagrams yet, which needs further studies to reveal the reason behind.
According to the research in this paper, we recommend Sc × 10/Sr vs. Ga/Nb, Nb/Y vs. K2O × 100/Cu, and Sr/V vs. Na2O × 100/Ga three diagrams as new basalt tectonic environment discrimination diagrams (). In this figure, the black thin solid line represents the discriminant effect almost 100% (under the 85% confidence ellipse condition), while the coarse gray dashed lines are better than 90%.
Figure 3. Sc × 10/Sr vs. Ga/Nb,Nb/Y vs. K2O × 100/Cu and Sr/V vs. Na2O × 100/Ga tectonic environment discrimination diagrams for basalt.
Big data methods differ from traditional methods, and big data have three important technical orientations: focus on the whole data not on sampling data; focus on the correlativity not on causal relationship; focus on efficiency not on precision. Previous research has been done well because of the limitations of academic thought, analytical techniques, and laboratory conditions, but it is clear that there are some deficiencies in the current perspective. Earlier research was largely sampling data or a typical research approach, and we started out with full data to extract the best results. The entire data are disorganized (including data from different periods, different methods, different labs, and different analytical techniques). We believe that more than 85% confidence data can screen out many inaccurate, poor quality, poor laboratory conditions, alteration changes, large deviations from the average data, making the results more credible. Based on this, the tectonic environmental discrimination diagrams of basalt ( and ) should be credible and adaptable.
5. Conclusions
1. The results show that most of the earlier basalt tectonic environmental discrimination diagrams are not applicable, especially the major elements discrimination diagrams. It is difficult to adapt to the situation of a large amount of data because the discrimination diagrams based on sampled data and typical regional data have some limitations.
2. In this paper, using the global data, the tectonic environmental discrimination diagrams of basalt have been better effect than the previous discrimination diagrams. The efficiency of the above discrimination diagrams, in the modern analytical technology conditions, for the IAB identification is almost all effective. The distinction between MORB and OIB still have some overlap, the reason for overlap may be the existence of the mixed situation of MORB and OIB. The detailed explanation also needs further research.
3. The interpretation of the results of this paper is preliminary and we are not very satisfied ourselves. Why does the relationship between some element pairs proposed in this paper (such as Sc/Sr, Ga/Nb, K/Cu, Sr/V, Na/Ga, etc.) produce better discrimination effect of the tectonic environment? What are the reasons? It is difficult to explain. We welcome the academic review of our results, reevaluation of the abovementioned discrimination diagrams or better discrimination diagrams, in order to promote the progress of basalt geochemical research.
Data availability
The data referred to in this paper is not publicly available at the current time.
Acknowledgments
The data used in this distribution of three different tectonic settings are taken from GEOROC and PetDB databases. We must show our thanks to database collectors for their decades of hard work. And we need to thank academician Shu Sun, Fuyuan Wu, Rixiang Zhu, Mingguo Zhai, researcher Xianhua Li, Erqi Wang from Institute of Geology and Geophysics, Chinese Academy of Science, academician Yigang Xu from Guangzhou Institute of Geochemistry, Chinese Academy of Sciences, professor Meifu Zhou from University of Hong Kong and professor Jinrong Wang from Lanzhou University for their strong support to this research. Meanwhile, we thank graduate student Jing Yang from Lanzhou University for assistance with data filtering.
Disclosure statement
No potential conflict of interest was reported by the authors.
Additional information
Funding
References
- Agrawal, S., Guevara, M., & Verma, S.P., (2008). Tectonic discrimination of basic and ultrabasic volcanic rocks through log-transformed ratios of immobile trace elements. International Geology Review, 50, 1057e1079.
- Alonso-Perez, R., Müntener, O., & Ulmer, P. (2009). Igneous garnet and amphibole fractionation in the roots of island arcs: Experimental constraints on andesitic liquids. Contributions to Mineralogy and Petrology, 157, 541–558.
- Anderson, D. L. (2000). The thermal state of the upper mantle; No role for mantle plumes. Geophysical Research Letters, 27, 3623–3626.
- Ballmer, M. D., van Hunen, J., Ito, G., Bianco, T. A., & Tackley, P. J. (2009). Intraplate volcanism with complex age-distance patterns: A case for small-scale sublithospheric convection. Geochemistry, Geophysics, Geosystems, 10, Q06015.
- Capedri, S., Venturelli, G., Bocchi, G., Dostal, J., Garuti, G., & Rossi, A. (1980). The geochemistry and petrogenesis of an ophiolitic sequence from Pindos, Greece. Contributions to Mineralogy and Petrology, 74, 189–200.
- Castillo, P. R. (2015). The recycling of marine carbonates and sources of HIMU and FOZO ocean island basalts. Lithos, 216–217, 254–263.
- Davies, J. H., & Bunge, H. P. (2006). Are splash plumes the origin of minor hotspots? Geology, 34, 349.
- Day, J. M. D., Pearson, D. G., Macpherson, C. G., Lowry, D., & Carracedo, J.-C. (2009). Pyroxenite-rich mantle formed by recycled oceanic lithosphere: Oxygen-osmium isotope evidence from Canary Island lavas. Geology, 37, 555–558.
- Glassley, W. (1974). Geochemistry and tectonics of the crescent volcanic rocks, Olympic Peninsula, Washington. Geological Society of America Bulletin, 85, 785.
- Harris, N. B. W., Pearce, J. A., & Tindle, A. G. (1986). Geochemical characteristics of collision-zone magmatism. Geological Society, London, Special Publications, 19, 67–81.
- Jackson, M. G., Hart, S. R., Koppers, A. A., Staudigel, H., Konter, J., Blusztajn, J., … Russell, J. A. (2007). The return of subducted continental crust in Samoan lavas. Nature, 448, 684–687.
- Jiao, S. T., Zhou, Y. Z., Zhang, Q., Jin, W. J., Liu, Y. P., & Wang, J. (2018). Study on intelligent discrimination of tectonic settings based on global gabbro data from GEOROC. Acta Petrologica Sinica, 34(12), 3189–3194.
- Lee, C. T., Luffi, P., Chin, E. J., Bouchet, R., Dasgupta, R., Morton, D. M., … Jin, D. (2012). Copper systematics in arc magmas and implications for crust-mantle differentiation. Science, 336, 64–68.
- Li, C., Arndt, N. T., Tang, Q., & Ripley, E. M. (2015). Trace element indiscrimination diagrams. Lithos, 232, 76–83.
- Liu, X. L., Zhang, Q., Li, W. C., Yang, F. C., Zhao, Y., Li, Z., … Du, X. L. (2017). Applicability of large-ion lithophile and high field strength element basalt discrimination diagrams. International Journal of Digital Earth, 1–9.
- Liu, Y. P., Zhu, L. X., & Zhou, Y. Z. (2018). Application of convolutional neural network in prospecting prediction of ore deposits––Taking the Zhaojikou Pb-Zn Ore Deposit in Anhui province as a case. Acta Petrologica Sinica, 34(11), in press.
- Meibom, A., & Anderson, D. L. (2004). The statistical upper mantle assemblage. Earth and Planetary Science Letters, 217, 123–139.
- Morgan, W. J. (1972). Plate motions and deep mantle convection. Nature, 132, 7–22.
- Mullen, E. D. (1983). MnO/TiO2 /P2O5: A minor element discriminant for basaltic rocks of oceanic environments and its implications for petrogenesis. Earth & Planetary Science Letters, 62, 53–62.
- Niu, Y., & O’Hara, M. J. (2003). Origin of ocean island basalts: A new perspective from petrology, geochemistry, and mineral physics considerations. Journal of Geophysical Research: Solid Earth, 108(B4), 2209–2227.
- Niu, Y., & O’Hara, M. J. (2009). MORB mantle hosts the missing Eu (Sr, Nb, Ta and Ti) in the continental crust: New perspectives on crustal growth, crust–Mantle differentiation and chemical structure of oceanic upper mantle. Lithos, 112, 1–17.
- Pearce, J. A. (1982). Trace element characteristics of lavas from destructive plate boundaries. Andesites, 528–548
- Pearce, J. A., & Cann, J. R. (1973). Tectonic setting of basic volcanic rocks determined using trace element analyses. Earth and Planetary Science Letters, 19, 290–300.
- Pearce, J. A., Lippard, S. J., & Roberts, S. (1984). Characteristics and tectonic significance of supra-subduction zone ophiolites. Geological Society, London, Special Publications, 16, 77–94.
- Pearce, J. A., & Norry, M. J. (1979). Petrogenetic implications of Ti, Zr, Y, and Nb variations in volcanic rocks. Contributions to Mineralogy and Petrology, 69, 33–47.
- Pearce, T. H., Gorman, B. E., & Birkett, T. C. (1977). The relationship between major element chemistry and tectonic environment of basic and intermediate volcanic rocks. Earth and Planetary Science Letters, 36, 121–132.
- Saccani, E. (2015). A new method of discriminating different types of post-archean ophiolitic basalts and their tectonic significance using Th-Nb and Ce-Dy-Yb systematics. Geoscience Frontiers, 6, 481–501.
- Shervais, J. W. (1982). Ti-V plots and the petrogenesis of modern and ophiolitic lavas. Earth and Planetary Science Letters, 59, 101–118.
- Sun, -S.-S., Nesbitt, R. W., & Sharaskin, A. Y. (1979). Geochemical characteristics of mid-ocean ridge basalts. Earth and Planetary Science Letters, 44, 119–138.
- Sun, W., Arculus, R. J., Kamenetsky, V. S., & Binns, R. A. (2004). Release of gold-bearing fluids in convergent margin magmas prompted by magnetite crystallization. Nature, 431, 975–978.
- Sun, W., Bennett, V. C., Eggins, S. M., Arculus, R. J., & Perfit, M. R. (2003a). Rhenium systematics in submarine MORB and back-arc basin glasses: Laser ablation ICP-MS results. Chemical Geology, 196, 259–281.
- Sun, W. D., Arculus, R. J., Bennett, V. C., Eggins, S. M., & Binns, R. A. (2003b). Evidence for rhenium enrichment in the mantle wedge from submarine arc-like volcanic glasses (Papua New Guinea). Geology, 31, 845–848.
- Vermeesch, P. (2006). Tectonic discrimination of basalts with classification trees. Geochimica et Cosmochimica Acta, 70(7), 1839–1848.
- Vermeesch, P. (2013). Tectonic discrimination diagrams revisited. Geochemistry, Geophysics, Geosystems, 74, 466-480.
- Wang, Y. F., & Zou, A. Q. (2018). Regularization and optimization methods for micro pore structure analysis of shale based on neutral networks. Acta Petrologica Sinica, 34(2), 281–288.
- White, W. M. (2010). Oceanic island basalts and mantle plumes: The geochemical perspective. Annual Review of Earth and Planetary Sciences, 38, 133–160.
- Wilson, M. (1989). Igneous petrogenesis. Journal of Geology, 1–465.
- Wood, D. A. (1980). The application of a Th, Hf, Ta diagram to problems of tectonomagmatic classification and to establishing the nature of crustal contamination of basaltic lavas of the British tertiary volcanic province. Earth & Planetary Science Letters, 50, 11–30.
- Wood, D. A., Joron, J.-L., & Treuil, M. (1979). A re-appraisal of the use of trace elements to classify and discriminate between magma series erupted in different tectonic settings. Earth and Planetary Science Letters, 45, 326–336.
- Xiao, W. J., Windley, B. F., Yan, Q. R., Qin, K. Z., Chen, H. L., Yuan, C., … Sun, S. (2006). Shrimp zircon age of the Aermantai ophiolite in the north Xinjiang area, China and its tectonic implications. Acta Geological Sinica, 80, 32–37.
- Zhang, Q., & Zhou, Y. Z. (2017). Big data will lead to a profound revolution in the field of geological science. Chinese Journal of Geology, 52(3), 637–648.
- Zhang, Q., & Zhou, Y. Z. (2018). Big data helps geology develop rapidly. Acta Petrologica Sinica, 34(11), 3167–3172.
- Zhang, X. Y., Ye, P., Wang, S., & Du, M. (2018). Geological entity recognition method based on deep belief networks. Acta Petrologica Sinica, 34(2), 343–351.
- Zhou, Y. Z., Chen, S., Zhang, Q., Xiao, F., Wang, S. G., Liu, Y. P., & Jiao, S. T. (2018a). Advances and prospects of big data and mathematical geoscience. Acta Petrologica Sinica, 34(2), 255–263.
- Zhou, Y. Z., Zhang, L. J., Zhang, A. D., & Wang, J. (2018b). Big data mining & machine learning in geoscience (pp. 1–269). Guangzhou: Sun Yat-sen University Press.
- Zindler, A., & Hart, S. (1986). Chemical geodynamics. Annual Review of Earth and Planetary Sciences, 14, 493–571.