
ABSTRACT
The quantitative classification of granite and their metallogenetic relations have never been discussed. The Q-system clustering analysis and discriminant analysis methods were alternately used to quantitatively analyze the 11 oxide data in granite samples from the West Qinling area of Gansu Province, and then to construct the quantitative classification series models of granite (oxide). The granites samples are divided into three categories and eight sub-categories. The classification of granites is biased toward prospecting. According to the spatial correlation between eight types of granites and copper deposits, lead and zinc deposits, gold deposits, etc. (within 3 km of the intrusion) in the West Qinling area in Gansu Province, the “metallogenic related intrusions” are sought, and the prospecting target areas are defined. Furthermore, they provide reliable basis for regional geological prospecting.
1. Research background
There are more than 20 classification schemes for granite classification (Zhang, Wang, Xiong, & Li, Citation2008), such as type I, type S, type M, type A, collision type, volcanic arc type, mid-ocean ridge type, intraplate type, Haixi type, Caledon type, Andes type, modified type, remelting type, syntectic type and Adakite type, Himalayan type, Guangxi type, Zheming type, and Nanling type (Barbalin, Citation1999; Bonin, Citation1990; Chappell & White, Citation1974, Citation1992; Collins, Beams, White, & Chappell, Citation1980; Eby, Citation1990; Ishihara, Citation1977; Maniar & Piccoli, Citation1989; Pitcher, Citation1983; Whalen, Currie, & Chappell, Citation1987; Zhang et al., Citation2008). These classification schemes mainly focus on the chemical components, some focus on the structural environments of granite formation, some focus on the classification of pressure relations, and others focus on the comprehensive factors (such as composition, source, and environment). However, there was little report on the quantitative classification of granite. Compared with the traditional qualitative geological research, quantitative classification is guided by the idea of big data (data-intensive), taking the existing rich geological information as the research object and using multivariate statistical analysis as the method (Liu, Li et al., Citation2018a; Liu, Li et al., Citation2018b; Zhang & Zhou, Citation2017; Zhou & Chen, Citation2018). Quantitatively identify the correlation between results and variables to achieve analysis and prediction (Luo, Zhang, & Peng, Citation2005; Luo et al., Citation2018; Wang et al., Citation2018). In addition, the quantitative classification of granite adopts the full data model, which extracts the valuable data from the whole data, pays close attention to the correlation between granite and mineralization, dilutes the causal relationship, and attaches great importance to the efficiency and result problems.
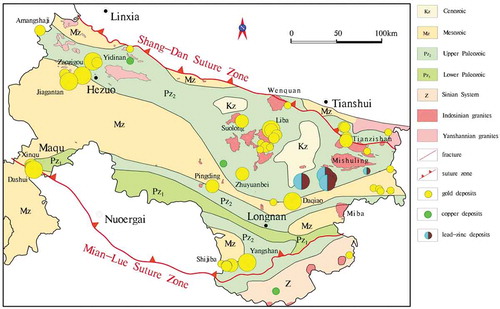
The West Qinling orogenic belt in Gansu Province is located between the Yangtze Craton and the Qaidam-Qianlian Orogenic Belt (). The intrusive activity of granitic magma is very frequent and the intrusion of collisional granite magma is the dominant factor in the formation of gold deposits in this area (Han, Liu, Dong, & Ouyang, Citation2008; Jin, Zhang, He, & Jia, Citation2005; Liang, Citation2008; Qiu, Gong, Lu, & Liu, Citation2008; Yin & Zhao, Citation2006; Zhang et al., Citation2007). The geological data formed by the long-term accumulation of granite in the West Qinling orogenic belt are characterized by multi-dimension, temporality and spatiality, correlation and nonlinearity. In this paper, the quantitatively classification of granites in the West Qinling area are conducted to discuss their relationship with the spatial distribution of gold deposits, copper deposits, lead–zinc deposits, and other deposits, and further to determine the ore-forming related intrusion, and mark the prospecting target areas, which has great significance for effective metallogenic prediction and optimization of the prospecting target area, based on ideas, methods of the geological big data and the data-driven model by big data applications.
Figure 1. The distribution diagram of magmatic rocks and significance deposits in the West Qinling area (after Yang et al., Citation2012).
2. Research methods
According to the data-driven model, using multivariate statistical analysis methods, to make classification and simulation (modeling) and excavating the implicit correlation between data, the metallogenic prediction and optimization of the prospecting target area can be made. In order to ensure the reliability of the statistical results, we need to filter the data first.
Data source: The data of major elements collected from 538 magmatic rocks, 333 gold deposits, of which 260 are above the ore site, and 73 are mineralization sites, 129 lead–zinc deposits, including 90 points above the mine site and 39 mineralization points, and 140 copper deposits in the West Qinling area of Gansu Province.
Data selection: In order to eliminate the effects of strong alteration and carbonation, samples with SiO2 <66%, H2O >7%, and CO2 >7% are removed. Meantime, the samples with extra high values which are 1–2 orders of magnitude higher than the average value are rejected, so as not to affect the calculation of the average value. After that, a total of 146 qualified granite bodies and 196 sets of main elements were selected.
According to the spatial distribution relationship between granite bodies and deposits (points) in West Qinling area, it is stipulated that the deposit within 3 km from the edge of the granite intrusion is the most favorable area for metallogenesis, those within 3–5 km is the general area for metallogenesis, and those are far away from more than 5 km has less correlation with the granitic intrusions. In this study, the most favorable area was selected as the preferred area for prospecting target area.
Selecting the major oxides of SiO2, TiO2, A12O3, Fe2O3, FeO, MnO, MgO, CaO, Na2O, K2O and P2O5, etc. Take the large contribution for classification as the main categorical variables for quantitative classification and serial modeling, and to dig the implicit correlation among data.
3. Quantitative classification of granites in the West Qinling area, Gansu Province
3.1. Granite quantitative model
More than 20 kinds of granite classification methods have been determined under the traditional logical thinking method. There is no classification method based on big data ideas, methods, and techniques so far. The statistics of granite oxide parameters in the West Qinling area of Gansu Province () show that the larger the standard deviation, the more intense the change in granites. The large standard deviation is an important classification index. According to the classification of two-dimensional projections such as the predecessor “TAS classification diagram”, they are no longer suited to the needs of contemporary research due to the one-sidedness of the results. To more realistically reflect the spatial correlation between granites and deposits in the region, it is necessary to establish a true and reasonable classification method for granites in this area.
Table 1. Statistical parameters table of the major oxide from granites in the West Qinling in Gansu Province, China.
According to the existing geological data, 11 major oxides of SiO2, TiO2, A12O3, Fe2O3, FeO, MnO, MgO, CaO, Na2O, K2O, and P2O5 are selected as the variables to form a granite classification database (full sample, full variable). First, the Q-type system clustering analysis is performed on the database (the intra-group connection is used as the clustering method, and the correlation is the calculation model) (Zhao, Wei, & Jin, Citation1990). In the Q-type clustering pedigree map, the samples with obvious classification are selected as Class I samples, and the other samples are Class II samples (Luo et al., Citation2005; Luo, Hou, Zhang, Peng, & Niu, Citation2006; Luo et al., Citation2018; Wang et al., Citation2018). Two types of discriminant analysis are made for the new database of I and II samples. The quantitative classification model of Class I granite in the West Qinling area of Gansu province is constructed. With R0 = 2.48 as the critical value, the sample with R0 ≥ 2.48 would be identified as Class I granite, and the Q-type system cluster analysis would be performed again for the samples with R0 < 2.48. The quantitative classification model of Class II and III granites would be used to construct a series of quantitative classification models of granites (oxide) in the West Qinling area of Gansu Province and the relationship between each classification lineage ().
Figure 2. Quantitative classification model of granites in West Qinling.
At present, the granites in the West Qinling area are only divided into three categories and eight sub-categories. The quantitative classification model can further divide the classification model of the next level according to its own needs, until the samples are not clearly classified in the cluster analysis of the Q-type system. Because the quantitative classification series model is based on the content of various oxides in granite samples in the West Qinling area, it has certain limitations. The classification of granite in other areas may be inaccurate. The quantitative classification model of granites in different areas (orogenic belts) should be constructed according to the demand. In order to more accurately study the correlation between granite and other geological events and products (ore deposits), such quantitative classification will be more practical.
3.2. Application of granite quantitative model
The R0 of the granite sample is calculated according to the formula in the quantitative model, and the classification can only start from the first model, and then enter the next judgment model according to the judgment condition of R0, and cannot directly judge the quantitative model. If R0 = 2.48 is the critical value, the sample with R0 ≥ 2.48 is determined as Class I granite, and the sample with R0 < 2.48 enters the second model. If the sample of R0 ≥ 0.23 enters the right model for classification, the sample with R0 < 2.48 is classified into the left model, and so on. The classification of the final sample can be determined according to the R0 threshold of different models.
The calculation formula of the R0 for granite sample in each model: R0 = constant + ∑ content of granite oxide × coefficient corresponding to each oxide content in the model
4. Main characteristics of quantitative classification of granite
The difference between Class I granite, Class II granite, and Class III granite is positively correlated with the content of MgO and Fe2O3, and negatively correlated with the content of CaO and P2O5. The content of MgO and Fe2O3 has a great contribution to the classification, accounting for 90.23%. Class I granite has higher iron–magnesium material than other Classes, and is relatively basic in granite (), which is classified into plagioclase granite and granodiorite in mineralogy classification.
Table 2. Quantitative classification results of granites(oxides) in the West Qinling in Gansu Province, China.
Note: The oxide content of the above classification is the average of each category.
The Class II and Class III granites are also classified mainly based on the oxide contents of MgO, TiO2, FeO, Fe2O3, Al2O3, MnO, Na2O, etc. Among them, the contents of MgO, TiO2, FeO, and Fe2O3 have the largest contribution rate to the classification, accounting for 91.97%. The Class II granites are negatively correlated with MgO, TiO2, and FeO, and positively correlated with Fe2O3, whereas the Class III granites are positively correlated with MgO, TiO2, and FeO, and negatively correlated with Fe2O3, indicating that the iron–magnesium materials in the Class III granites are lower than those in Class I granite, but higher than those in Class II granite.
Class II granite, the most acidic granite, can be divided into three types of granite (II1, II2, II3), and Class II3 granite can be further divided into two types (II31, II32) granite. The classification of Class II1 granite is positively correlated with CaO and Fe2O3, and negatively correlated with FeO and MnO. The classification of Class II2 and Class II3 is reversed, and negatively correlated with CaO and Fe2O3, and positively correlated with FeO and MnO. These granitoids are classified into plagioclase granite, granite porphyry, (plaque-like) plaque monzonitic granite, and tonalite. The other classifications of Class II2 and Class II3 granites are negatively correlated with Al2O3, P2O5, Na2O, and SiO2, and positively correlated with TiO2. The Class II3 is negatively correlated with TiO2 and positively correlated with Al2O3, P2O5, Na2O, and SiO2. Correlation, the Class II2 granite mineralogy, is classified into monzonitic granite, but it is acidic. The other classifications of Class II31 and Class II32 granites are negatively correlated with TiO2, P2O5, MgO, MnO, and SiO2, and positively correlated with Fe2O3. Class II32 granites are inversely related to TiO2, P2O5, MgO, MnO, and SiO2 and negatively correlated with Fe2O3. The mineralogical classification of Class II31 granite is classified into granite, and the mineralogical classification of Class II32 granite is classified into granite porphyry, monzonitic granite, and syenogranite.
For Class III granites, the SiO2 content is between Class I and Class II granites, which can be divided into two types (III1, III2) granites, and Class III2 can be further divided into two types (III21, III22) granite. The classification difference between Class III1 and Class III2 granites is the positive correlation with P2O5, MgO, Fe2O3, and CaO in Class III1 granite and the negative correlation with P2O5, MgO, Fe2O3, and CaO in Class III2 granite. The Class III1 granite is classified into quartz diorite, a small number of granodiorite, dioritic porphyrite. The classification difference between Class III21 and Class III22 granites is positively correlated with FeO, P2O5, TiO2, and K2O, and negatively correlated with Fe2O3. The Class III22 granites are negatively correlated with FeO, P2O5, TiO2, and K2O, and positively correlated with Fe2O3. The mineralogical classification is classified into the monzonitic granite, but the Class III21 granite is relatively acidic compared to the Class III22 granite.
5. Statistical analysis of correlation between quantitative classification and main ore-forming spatial distribution
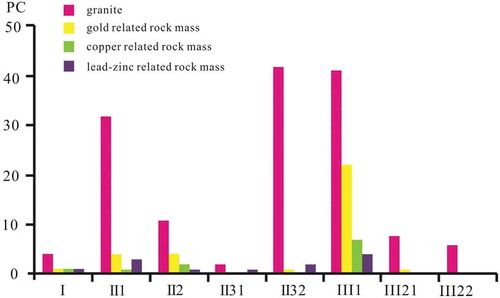
According to the spatial distribution relationship between granite bodies and various deposits in the West Qinling area, different types of granite bodies with gold deposits, copper deposits, lead–zinc deposits distributed and within or within 3 km of the rock mass are collectively referred to as “metallogenesis related rock mass”. The statistical analysis of the correlation between the quantitative classification results of granites and the spatial distribution of deposits () shows that different minerals and granite classifications have unique mineralization correlations ().
There are disagreements with different sub-categories in five intrusions (the samples are classified into different sub-categories) based on the classification methods. According to the number of samples, the intrusions with classification disagreements are classified to the type with more samples. The statistical results of quantitative classification of granites show that the West Qinling granites are mainly distributed in three types: Class II1 (32, accounting for 21.91%), Class II32 (42, accounting for 28.77%), and Class III1 (41, accounting for 28.08%). And others categories accounted for 21.19%.
Some of the same ore deposits are located within 3 km of the boundary of two or more rock masses, so the numbers of statistical deposits are greater than the actual number of deposits, but it does not affect the determination and statistics for ore-forming related rocks masses. The gold-bearing ore-related intrusions are mainly distributed in the Class II1, II2, and III1, and the ore deposits distribution are densely distributed. There is a great prospecting potential within 3 km of the granite body. There are little spatial correlations between the Class II3, III22 granites, and gold deposits, between the Class II32, II31, III21, III22 granites, and copper deposits, and between the Class III21, III22 granites, and lead–zinc deposits. The rock mass is mainly distributed in the Class III1 granites for copper deposits and the Class II1, III1 for lead–zinc deposits. In general, the gold, copper, and lead–zinc deposits have intimately spatial correlation with Class III1 granite, and it is looking for Class III1 granite and its surrounding area has a large prospecting space (). Therefore, quantitative classification can more accurately study the classification of granites and their spatial correlation with the deposit.
Although the above statistical results are not perfect due to the fact that some of the samples are not collected from granites in the West Qinling, it can generally provide a certain prospecting direction for further prospecting in the West Qinling area.
Taking 22 attributes such as rock mass tectonic belt, quantitative classification, qualitative classification, formation age, rock alteration and mineralization characteristics as variables, combined with geology, geophysical exploration, geochemical exploration, remote sensing and other information, according to Q-type hierarchical cluster analysis (using clustering within the group as a clustering method and correlation as a computational model), ideas and methods can be used to construct a quantitative prediction model for the Au, Cu, Pb, and Zn target areas in the West Qinling area of Gansu Province, which can be quickly and accurately delineated prospecting target areas.
Table 3. Quantitative classification results of granites with ore deposits spatial correlation statistical analysis.
Figure 3. Quantitative classification model of granites and ore-forming granites in West Qinling.
6. Conclusions
The modeling ideas and methods of the “granular (oxide) quantitative classification series model in the West Qinling area of “Gansu Province” are not perfect and need further improvement. The sub-classes of granite quantitative classification can be further modeled to divide the smaller classification, and the model itself is established only based on the granite data in the West Qinling, which has certain limitations. Different regions should build different quantitative classification models of granites according to the practical demand, and strive to be more accurate study of the correlation between granite and other geological events with their products (ore deposits), which will make such quantitative classification more practical and meaningful.
Quantitative classification series models are controlled by multiple variables of different combinations. The quantitative classification results are preferably controlled by the test data, so it is crucial to ensure the authenticity of the original data and improve the representativeness of the samples.
Quantitative classification is more accurate in studying the classification of granite and their spatial correlation with the deposit. The classification results of granite in West Qinling are biased toward the classification of ore deposits, mainly concentrated in the three types of Class II1, II2, and III1 granites. In general, gold deposits with Class II1, II2, and III1 granites, copper deposits with Class III1 granites, and lead–zinc deposits with Class II1 and III1 granites have close spatial correlation.
Data availability statement
The data used in this study is the 1:200,000 regional geological survey and scientific research data of the West Qinling Mountains. The data is attributed to the Big Data Center of the Gansu Geological Survey.
Acknowledgments
This work was supported by Mineral Resources Compensation Project of Gansu Province, and Basic Geological Survey Project of Gansu Province.
Disclosure statement
No potential conflict of interest was reported by the authors.
Additional information
Funding
References
- Barbalin, B. (1999). A review of the relationships between granitoid types, their origins and their geodynaments. Lithos, 46, 605–626.
- Bonin, B. (1990). From orogenic to anorogenic settings: Evolution of granitoid suites after a major ougenesis. Geological Journal, 25, 261–270.
- Chappell, B. W., & White, A. J. R. (1974). Two contrasting granite types. Pacific Geology, 8, 173–174.
- Chappell, B. W., & White, A. J. R. (1992). I- and S-type granites in the Laxhlan Fold Belt. Transactions of the Royal Society of Edinburgh Earth Science, 83, 1–26.
- Collins, W. J., Beams, S. D., White, A. J. R., & Chappell, B. W. (1980). Nature and origin of A-type granites with particular reference to south-eastern Australia. Contributions to Mineralogy and Petrology, 80, 189–200.
- Eby, G. N. (1990). The A-type geanitoids: A review of their occurrence and chemical characteristics and speculations on their petrogenesis. Lithos, 26(1/2), 115–134.
- Han, H. T., Liu, J. S., Dong, X., & Ouyang, Y. F. (2008). Geology and genesis of Wenquan porphyry molybdenum deposit in the West Qinling area. Geology and Prospecting, 44(4), 1-7.
- Ishihara, S. (1977). The magnetite-series and ilmenite-series granitic rocks. Mining Geology, 27, 293–305.
- Jin, W. J., Zhang, Q., He, D. F., & Jia, X. Q. (2005). SHRIMP dating of adakites in western Qinling and their implications. Acta Petrologica Sinica, 21(3), 959-966.
- Liang, Y. Z. (2008). Geological characteristics of Wenquan molybdenum deposit in Wushan County of Gansu Province. Gansu Geology, 17(2), 40-49.
- Liu, X. L., Li, W. C., Zhang, N., Zhu, J., Luo, Y., Yang, F. C., & Wang, S. S. (2018a). Comparative study on mineralization-related granite of Pulang porphyry copper deposit in Northwestern Yunnan and Global adakite: The preliminary results of big data research. Acta Petrologica Sinica, 34(2), 289–302.
- Liu, X. L., Li, W. C., Zhang, Q., Zhang, N., Luo, Y., Wang, S. S., … Li, Z. H. (2018b). Comparative study of big data of global adakites and mineralization-related granite in the Geza arc metallogenic belt, northwest Yunnan, Southwest China. Big Earth Data, 2(3), 268–281.
- Luo, J. M., Hou, Y. S., Zhang, X. H., Peng, D. Q., & Niu, H. B. (2006). Reserve predictive model and resource potential appraisal of gold deposits in Gansu Province, China. Mineral Deposits, 25(1), 53–59.
- Luo, J. M., Wang, X. W., Song, B. T., Yang, Z. M., Zhang, Q., Zhao, Y. Q., & Liu, S. Y. (2018). Discussion on the method for quantitative classification of magmatic rocks: Taking it’s application in West Qinling of Gansu Province for example. Acta Petrologica Sinica, 34(2), 326–332.
- Luo, J. M., Zhang, X. H., & Peng, D. Q. (2005). Grade-resource distribution model of rock gold deposits in the Gansu Province. Geology and Prosecting, 41(5), 62-65.
- Maniar, P. D., & Piccoli, P. M. (1989). Tectonic discrimination of granitoids. Geological Society of America Bulletin, 101, 635–643.
- Pitcher, W. S. (1983). Granite type and tectonic environment. In K. Hsu (Ed.), Mountain building processes (pp. 19–40). London: Academic Press.
- Qiu, Q. L., Gong, Q. S., Lu, S. W., & Liu, S. X. (2008). Geochemical characteristics and geological significance of adakitic granitoids in Xiahe County of Gansu Province. Gansu Geology, 17(3), 6-12.
- Wang, Y. X., Luo, J. M., Wang, J. R., Luo, Y. Z., Wang, X. W., Zhang, Q., … Wang, H. Q. (2018). The gold prospecting targets quantitative optimization based on information of the magmatic rocks (oxide) in dunhuang block, Gansu Province. Acta Petrologica Sinica, 34(2), 319–325.
- Whalen, J. B., Currie, K. L., & Chappell, B. W. (1987). A-type granites: Geochemical characteristics, discriminations and petrogenesis. Contributions to Mineralogy and Petrology, 95, 407–419.
- Yang, T., Zhu, L. M., Zhang, G. W., Wang, F., Lu, R. K., Xia, J. C., & Zhang, Y. Q. (2012). Geological and geochemical constraints on genesis of the Liziyuan gold-dominated polymetal deposit, western Qinling orogen, central China. International Geology Review, 54(16), 1944–1966.
- Yin, Y., & Zhao, Y. Q. (2006). Relationship between granite and gold mineralization in the gold enrichment area of western Qinling, Gansu Province. Gansu Geology, 15(1), 36-41.
- Zhang, H. F., Jin, L. L., Zhang, L., Harris, N., Zhou, S., Hu, S. H., & Zhang, B. R. (2007). Geochemical and Pb-Sr-Nd isotopic compositions of granitoids from western Qinling belt: Constraints on basement nature and tectonic affinity. Science in China (Series D), 50(2), 184-196.
- Zhang, Q., Wang, Y., Xiong, X. L., & Li, C. D. (2008). Adakite and granite: Challenge and opportunity (pp. 1–344). Beijing: China Land Press.
- Zhang, Q., & Zhou, Y. Z. (2017). Big data will lead to a profound revolution in the field of geological science. Chinese Journal of Geology, 52(3), 637–648.
- Zhao, P. D., Wei, M., & Jin, Y. Y. (1990). Statistical analysis of geological exploration. Wuhan: China University of Geosciences Press.
- Zhou, Y. Z., Chen, S., Zhang, Q., Xiao, F., Wang, S. G., Liu, Y. P., & Jiao, S. T. (2018). Advances and prospects of big data and mathematical geoscience. Acta Petrologica Sinica, 34(2), 256–263.