
ABSTRACT
In recent years, with the progress of computer technology, some traditional industries such as geology are facing changes in industrial structure and application mode. So we try to apply big data and virtualization technology in the field of geoscience. This study aims at addressing the existing problems in geological applications, such as data sharing, data processing and computing performance. A Geological Cloud Platform has been designed and realized preliminarily with big data and virtualization technology. The application of the Geological Cloud Platform can be divided into two parts: 1) to nest the geological computing model in cloud platform and visualize the results and 2) to use relevant software to conduct data analysis and processing in virtual machines of Windows or Linux system. Finally, we prospect Carlin-type deposits in Nevada by using the spatial data model ArcSDM in the virtual machine.
1. Introduction
Following the rapid development of the Internet of Things, cloud computing, and big data, scholars in the field of information believe that the world has entered the era of big data. The solution based on Hadoop can ensure the high security and high availability of mass storage, and high efficiency of real-time analysis and professional data processing. Industries such as Google and Facebook have conducted lots of research studies and carried out applications in the fields of big data and cloud computing (He, Citation2013; Lv, Li, & Li et al., Citation2012; Tang, He, & Xiao et al., Citation2003). Therefore, using these technologies to design and build a cloud platform can offer advantages to geological work. The cloud platform has the capacity to store and manage massive geological data, and to provide various geological services for ore prospecting and evaluation.
In recent years, geological application services are facing three main challenges in this field. 1) Data problems: geological data are difficult to obtain, and most of them are stored locally with different specifications, which increase the difficulties in data sharing. There is so far no integrated platform to manage these data. 2) Single processing mode: Most geological data processing still depends on various GIS software tools . For specific analysis and processing, complex manual modelling or code writing is required. 3) Low computing performance: traditional local processing methods cannot ensure high performance of workstations and servers resulting in low efficiency and wastage of resources.
This study designs and builds a prototype of geological cloud platform on the basis of previous research, and preliminarily solves the above-mentioned geological application problems. Through big data distributed framework (Hadoop), database (HBase) and data warehouse (Hive), the distributed storage and management of geological data are achieved. By using distributed computing framework (Spark), distributed search engine (Elasticsearch), and visual analysis platform (Kibana), the data analysis model and data processing visual template are established. The server computing performance has been much improved, and the data processing is greatly simplified.
2. Research status
In the field of geosciences, many developed countries have built their own geo-data sharing platforms and have begun to provide data services for government agencies, private enterprises, universities, research institutes, and the general public. This contributes to sharing and acquiring of information and facilitates better decision-making, for example, Geospatial One-Stop and US Geoscience Information Network (USGIN) in the United States, Geo Connections in Canada, African-European Geo-resources Observation System (AEGOS) and Geoscience Information in Africa Network (GIRAF) in Africa, and etc. Developed countries such as UK, Canada, and Japan have already integrated parallel computing, distributed computing, virtualization and big data technology in the construction of geological informatization (He, Citation2013).
China is relatively lagging in the use of big data and cloud computing to serve mineral resource prospecting and evaluation. In 2003, the “China Geological Survey Information Grid” project was carried out by China Geological Survey, which made a great progress in integration and sharing of geological data (Lv et al., Citation2012; Tang et al., Citation2003). Xu (Citation2009) proposed the concept of “one map” of land and resources in view of the low degree of geological information sharing and unsatisfactory extent of application. In 2010, the Development Research Center of China Geological Survey also launched relevant research on cloud computing. Supporting projects were set up to begin applicable research and exploration of cloud computing in the field of geological surveying. In addition, He (Citation2013) used cloud computing technology to manage and analyze massive data then built a one-stop prototype system for geological information, such that users can access resources throughout the network. Wang (Citation2011) combined GIS and cloud computing technology and established the prototype of geological disaster cloud GIS by deploying geological disaster sharing service in Wenchuan disaster area on Applogic platform. Several studies (Liu, Citation2013; Liu, Lu, & Xu et al., Citation2013; Zhang, Citation2013) redesigned cloud computing architecture on the basis of the Geosciences G4I system. Zhao (Citation2015) put forward the framework of a cloud prospecting platform and provided a new perspective of the geological industry in the era of big data, which is of great significance to the development of geosciences.
We have undertaken several mineral evaluation projects, and a variety of mineral data have been accumulated. Compared to previous architectures, our research mainly focuses on ore prospecting and big data and virtualization technologies are utilized.
3. Service model and application
3.1. Platform framework
As shown in , the platform architecture can be divided into three layers: service, management, and basement.
Figure 1. Cloud platform architecture
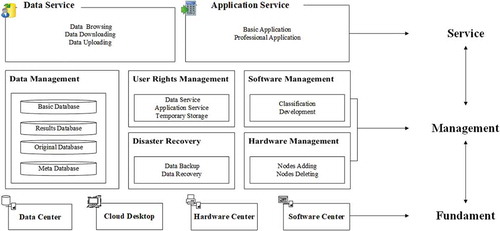
Among these, the basement layer provides hardware, software, virtualization, data storage, and provides resources for the management and service layers. The management layer mainly manages underlying resources while supporting the service layer to ensure data availability and security. The service layer packages all software, hardware resources, and applications into services. It has the characteristics of high reliability and scalability and can meet the various application needs. Users are able to access resources from client to cloud through this layer.
3.2. Service modes
Cloud service is built on a cloud environment with data security. The service mainly includes three levels: SaaS (Software as a Service), PaaS (Platform as a Service), and IaaS (Infrastructure as a Service). The overall purpose is to share professional data in a cloud environment, while simultaneously implementing professional data processing and display by using existing cloud application models. As shown in , the cloud service mode is divided into geological data service and geological application service.
Figure 2. Application of cloud servers
Geological data service provides browsing, consulting and download of stored data, including basic geological data, prospecting information, and geological maps, to solve the problem of data sharing.
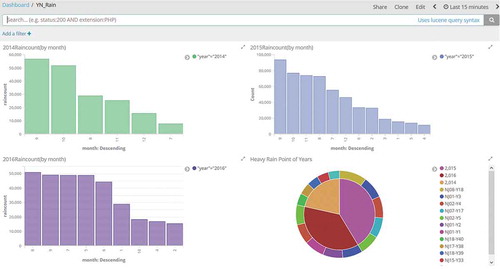
Geological application service aids in the analysis and processing of data on the server. Processing with cloud desktop and GIS software (). The algorithm model and existing data are applied to perform data analysis and processing using the computing resources of the server. shows visualization results of a rainfall data processing model.
Figure 3. Virtual desktop operation
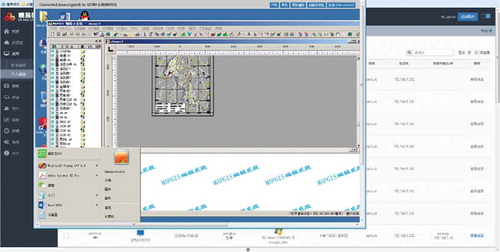
Figure 4. Data analysis and visualization
4. Cloud service application-weight-of-evidence
Cloud services offer convenience to professionals for data sharing, analysis, and processing. Data extraction of cloud services is achieved by establishing descriptive information of metadata storage data in the background and locating data through accessing metadata database, thus completing data acquisition, invoking model processing, and ultimately serving ore prospecting prediction and mineral resources evaluation.
This study implements the weight-of-evidence model in the cloud service, which is mainly accomplished by applying data and using ArcGIS software in the virtual machine (operating system: windows, memory: 16 G, hard disk: 50GB). This improves the data processing mode. The entire process transforms from localization to cloud processing.
The weight-of-evidence model is a commonly used geostatistical method. In the process of resource exploration, it is often used as an important basis to delineate prospective targets. It was proposed by Agterberg (Citation1990) a Canadian mathematical geologist and was first used in medicine in the 1960s. The basic idea is to superimpose and synthesize thematic map data (evidence) with different weights in a GIS environment to generate grid thematic maps with different ore-bearing probability values. The quantitative analysis results reflect the spatial distribution of different ore-bearing potential zones, thus providing regional advanced evaluation results for further detailed exploration work. This method has been widely used in resource evaluation, which can be divided into four steps: (1) vectorization of data and establishment of spatial digital database, (2) extraction of predictive evidence layers of target deposit type based on an ore deposit exploration model, (3) calculation of weight values for each evidence layer, and (4) synthesis of each evidence layer and delineation of favourable ore-forming areas (Shi, Zhang, & Hu et al., Citation2009).
In the cloud service platform, ArcGIS is used as the carrier of weight of evidence model. The SDM (spatial data modeller) toolbox is used as the tool for establishing the evidence weight model. By using ArcGIS spatial data stored on the platform in the established model, the posterior probability overlay maps of each evidence layer are finally obtained, which can play a guiding role in further prospecting work.
4.1. ArcSDM (spatial data modeller for ArcGIS)
The SDM is a set of spatial data model tools based on ArcGIS, mainly used for evaluation and prediction. Spatial data models include (1) data-driven model: evidence weight, Logistic regression, RBF-connected neural network and probabilistic neural network; (2) knowledge-driven model: fuzzy logic, expert evidence weight; (3) classification tools: fuzzy clustering network; and (4) common tools: adding fault direction. These models can use numerical data (such as geochemical data of arsenic) and type data (such as lithologic classification data).
The calculation of the evidence weight method in SDM includes (1) preparation of the study area map, training point map, and evidence layer, (2) calculation of the weight table of each evidence layer, (3) calculation of the response layer to the target according to the weight coefficient table, (4) conditional independence test of evidence layers and analysis of evaluation and prediction results (Agterberg, Citation1989; Alok Porwal & Carranza, Citation2006; Batchelor et al., Citation1985; Chen, Citation2004; Paktunc, Citation1998; Qu, Li, & Li et al., Citation2010; Zhao, Citation2009)
4.2. Introduction of a data layer in the research area
Nevada is an important gold producer in the United States and the first region to succeed in treating fine disseminated gold deposits. There are nearly 100 gold deposits (including those in remote spots) in this prefecture. Except for a few quartz vein type gold deposits, the vast majority of these are fine disseminated type gold deposits. Ore deposits are generally large-scale, mostly large-super and large gold deposits.
There are basically two types of gold deposits. One is hosted in the sedimentary strata with carbonate rocks, fine clastic rocks, and clay rocks as direct surrounding rocks, whereas the other is hosted in volcanic rocks.
The Carlin-type gold deposits in Nevada are mainly located in the north-central part of the state. It is also known as the Nevada-type gold deposit (Zhang, Citation1985).
The data collected in this study are collated from many sources, including foreign websites and publications (Philip, Helen, & Gertrude, Citation1974; Ludington, Cox, & McCammon, Citation1996). After screening, the main data used are the geological lithology map, fault data, and geochemical characteristics data of stream sediments. The scale of the map is 1:2,500,000.
Training point layer. The study area is located in the central part of Nevada, with an approximate range of 116°00′W–118°13′W and 38°40′–41°01′N, with a total area of about 910,000 km2. Due to unpublished data in the lower left corner, the training point layer is missing in this area. The research area is divided into 908,785 cell meshes, where each cell mesh size is 1 km × 1 km. Among these, 31 ore spots with abundance values, which have been explored, are selected as training points after screening (, ArcGIS calculation layer).
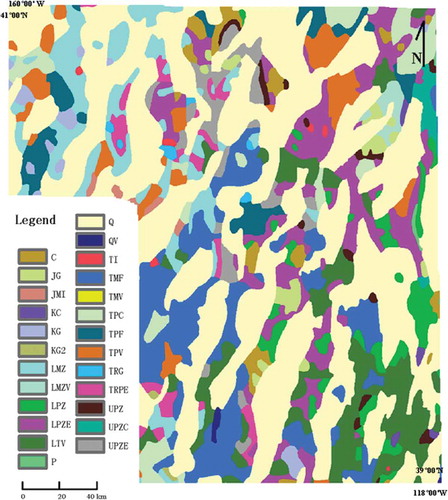
Geological lithologic layer. This is the geological lithologic layer of the study area, as shown in . Its attribute database contains the lithologic names of each stratum and the correlation attribute of the Carlin-type gold deposit. If the formation age of strata is earlier than or consistent with the formation age of Carlin-type gold deposit, the attribute is marked as T; and if the formation of the deposit is late, it is recorded as F.
Figure 5. Training point in the study area
Figure 6. Geology in the study area. Legend: Carboniferous (C), Jurassic Granite (JG), Jurassic Mafic Intrusive rock (JMI), Cretaceous Continental sedimentary rock (KC), Cretaceous Granite (KG), Upper Cretaceous Granite (KG2), Lower Mesozoic (LMZ), Lower Mesozoic Volcanic rocks (LMZV), Lower Palaeozoic (LPZ), Lower Palaeozoic Eugeosyncline deposit (LPZE), Lower Tertiary Volcanic rocks (LTV), Permian (P), Quaternary (Q), Quaternary Volcanic rocks (QV), Tertiary Intrusive rock (TI), Miocene Felsic intrusive rocks (TMF), Miocene Volcanic rocks (TMV), Pliocene Continental deposition (TPC), Pliocene Felsic intrusive rocks (TPF), Pliocene Volcanic rocks (TPV), Triassic Granite (TRG), Triassic Eugeosyncline deposit (TRPE), Upper Palaeozoic(UPZ), Upper Palaeozoic Clastic wedged facies (UPZC), Upper Palaeozoic Eugeosyncline deposit (UPZE)
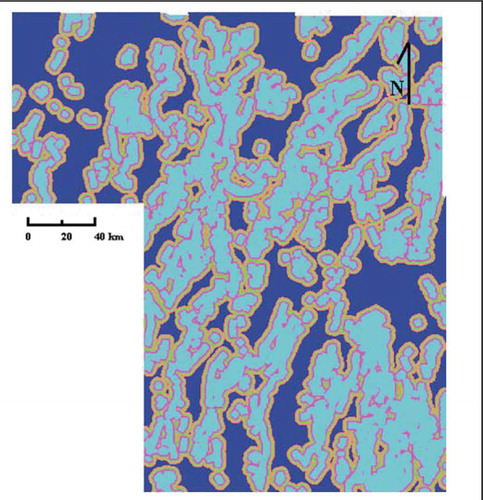
Fault buffer zone. The current small-scale layer is obtained by data processing (), and the fault buffer layer is obtained by creating a 1 km × 5 km ring buffer on the basis of the original fault ().
Figure 7. Faults in the study area
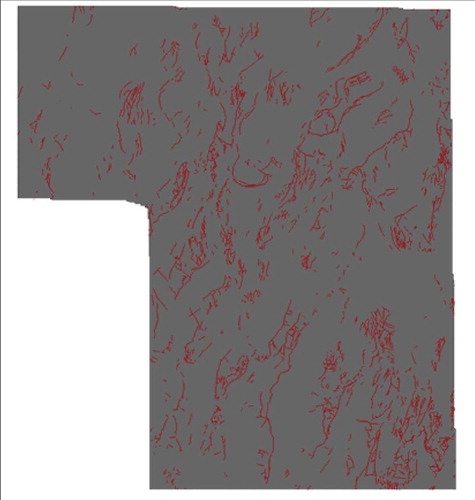
Figure 8. Fault ring buffer in the study area
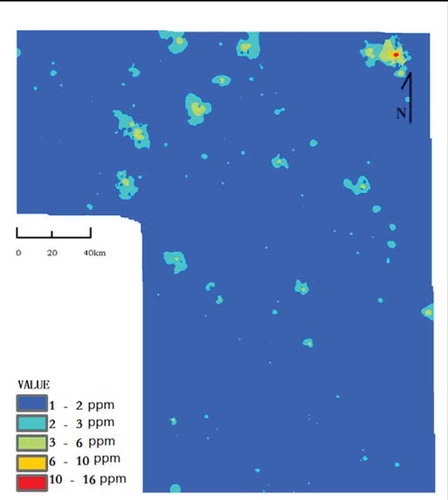
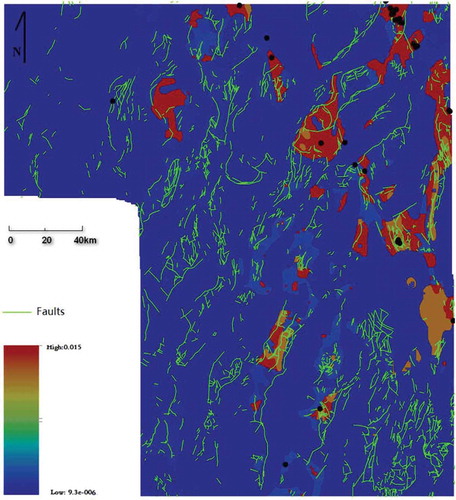
Geochemical characteristics of stream sediments. Potassium and antimony geochemical data of stream sediments are selected. These are re-classified by the natural segmentation method (), showing that high Sb and low K are favourable for mineralization.
Figure 9. K surface
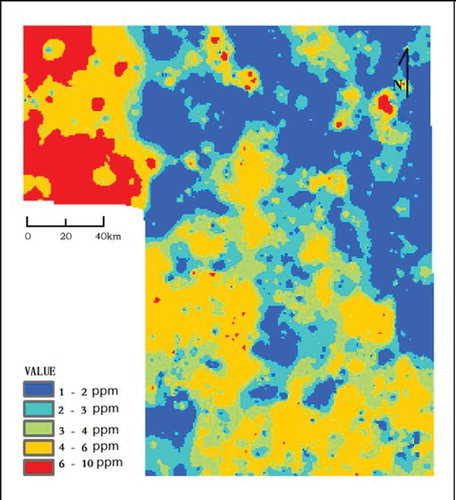
Figure 10. Sb surface
4.3. Weight-of-evidence method
Weight-of-evidence method is divided into four steps: 1) applying for virtual machine and data, 2) calculating evidence weight, 3) conditional independence test, 4) calculating area frequency, as follows:
Application Data and Virtual Desktop. By applying for virtual machines and data in the platform and remotely operating the cloud desktop ().
Figure 11. Applying for data
Calculation. Local ArcGIS is accessed on the cloud desktop and the calculation of weights is completed via SDM.
Conditional Independence Test. The response layer () is compared with the Stoudon contrast to test the independence of the layers and obtain the data as follows. CI is 11.8% and Conditional Independence Ratio is 0.63. (T-n)/Tstd = 1.564398 is 94.1%. The layers are basically independent of each other.
Area-frequency calculation. It is mainly used to test the prediction results. The input training point and response layer calculation show that 7.8% of the effective area contains 80.6% of the mineral spots. Therefore, the prediction of evidence weight method is of good instructional significance ().
Figure 12. Response layer
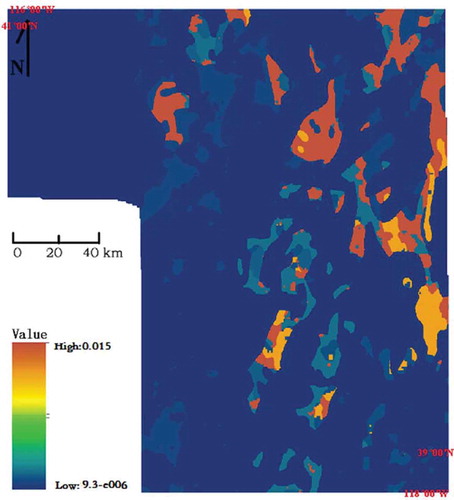
Table 1. Area-frequency
According to the response layer, in order to facilitate prediction, the known ore spots and faults are added (). The intersection of NW and NE faults in the red high value area is a favourable area for mineralization.
Figure 13. Prediction of the Carlin-type gold deposit Nevada
5. Conclusion
Big data and virtualization technologies have gradually matured in recent years, and their applications to geological work make it more convenient and efficient. However, application of the technology is difficult, with a steep learning curve. Hence, we have only achieved the preliminary implementation of geological cloud platform.
By using virtualization, big data, and a distributed framework, our work preliminarily realizes the application of geological cloud service from the perspective of data sharing, data analysis and processing, and visualization. The process of data management and analysis is completed in the cloud. The application services are divided into online model processing and virtual machine processing. With the application of the virtual machine and data, the weight-of-evidence analysis of the Carlin-type gold deposit in Nevada is carried out. Compared with the traditional local processing mode, the cloud service is more convenient and efficient, and data acquisition is easier. At the same time, the nested data analysis and visualization model in cloud avoids coding, reduces the application threshold, and is more user-friendly.
Acknowledgments
The authors would like to express sincere appreciation for the editor and the anonymous reviewers for their valuable comments and suggestions towards improving the presentation of the manuscript.
Data availability statement
The data that support the findings of this study are openly available at https://www.ige.unicamp.br/sdm/ArcSDM10/source/SDMArcGIS10.zip.
Disclosure statement
No potential conflict of interest was reported by the authors.
Additional information
Notes on contributors

Gaodian Zhou
Gaodian Zhou received his Master's degree at China University of Geosciences (Wuhan). He is currently a PhD candidate studying at China University of Geosciences (Wuhan). His research interests are object detection, computer vision and big data.
Weitao Chen
Weitao Chen is an associate professor at the School of Computer Science in China University of Geosciences (Wuhan). He received B.E. degree from Jiaozuo Institute of Technology in 2003, and obtained Ph.D. degree from China University of Geosciences (Wuhan) in 2012. His main research interests include machine learning and remote sensing of environment.
References
- Agterberg, F. P. (1989). Computer programs for mineral exploration. Science, 245, 76–81.
- Agterberg, F. P. (1990). Combining indicator patterns for mineral resource evaluation. Proceeding of International Workshop on Statistical Prediction of Mineral Resources, 1(1), 39–50.
- Alok Porwal, E. J. M., & Carranza, M. H. (2006). Bayesian network classifiers for mineral potential mapping. Computers & Geosciences, 32(1), 1–16.
- Batchelor, R. A. (1985). Petrogenetic interpretation of granitoid rock series using multicationic parameters. Chemical Geology, 48(1–4), 43–55.
- Chen, Y. L. (2004). Three visual basic programs for mineral resource potential mapping. Computers & Geosciences, 30(9–10), 969–983.
- He, W. N. (2013). Research of geological informationization based on IoT and cloud computing in big data era [Unpublished doctoral dissertation]. China: Jilin University.
- Liu, W. (2013). Research on key technologies of data integration and cloud computing in complex geoscience G4I system [Unpublished doctoral dissertation]. China: Jilin University.
- Liu, W., Lu, J. L., & Xu, H. (2013). Structure design of G4 ICCS based on cloud computing. Journal of Jilin University, 187–190.
- Ludington, S. D., Cox, D. P., & McCammon, R. B. (1996). Data base for a national mineral-resource assessment of undiscovered deposits of gold, silver, copper, lead, and zinc in the conterminous United States (No. 96-96). US Geological Survey.
- Lv, X., Li, F. D., & Li, J. Q. (2012). The techniques of distributed spatial data services of China geological survey information grid platform. Geological Bulletin of China, 31(9), 1520–1530.
- Paktunc, A. D. (1998). MODAN: An interactive computer program for estimating mineral quantities based on bulk composition. Computers & Geosciences, 24(5), 425–431.
- Philip, B. K., Helen M. B., & Gertrude J. E. (1974). Geologic map of the United States.U.S. geological survey.
- Qu H. G., Li J. Z., Li Y. W. (2010). Spatial assessment and prediction modeling tool and its application in mineral resources potential assessment. Mineral Deposits, 29(s1), 756–757.
- Shi, K., Zhang, J., Hu, P. (2009). Application of MOPARS weight of evidence method in metallogenic prediction of Fengtai gold deposit. Geophysical and Geochemical Exploration Technology, 31(5), 500–506.
- Tang, Y., He, K. T., Xiao, N., et al. (2003). Study on system framework and key issues of national geological application grid. Journal of Computer Research and Development, 40(12), 1682–1688.
- Wang, Z. F. (2011). Research and application of key technologies of geological disaster spatial information sharing platform [Unpublished doctoral dissertation]. China: Chengdu University of Technology.
- Xu, S. S. (2009). Speech at national land and resources informatization conference. Land and Resources Informatization, 000(005), 28–30.
- Zhang, J. D. (2013). Cloud-based geological G4I system structure design [Unpublished doctoral dissertation]. China: Jilin University.
- Zhang, X. R. (1985). Current situation of beneficiation and metallurgical technology of carlin-type gold mine in Nevada, USA. Mineral Resources, (02), 39–47.
- Zhao, G. L. (2009). Weights of evidence regression model based on ArcGIS and python and application on seafloor resource assessment [Unpublished doctoral dissertation]. China: Jilin University.
- Zhao, P. D. (2015). Digital mineral exploration and quantitative evaluation in the big data age. Geological Bulletin of China, 34(7), 1255–1259.