
 ?Mathematical formulae have been encoded as MathML and are displayed in this HTML version using MathJax in order to improve their display. Uncheck the box to turn MathJax off. This feature requires Javascript. Click on a formula to zoom.
ABSTRACT
Leaf area index (LAI) and canopy chlorophyll density (CCD) are key indicators of crop growth status. In this study, we compared several vegetation indices and their red-edge modified counterparts to evaluate the optimal red-edge bands and the best vegetation index at different growth stages. The indices were calculated with Sentinel-2 MSI data and hyperspectral data. Their performances were validated against ground measurements using R2, RMSE, and bias. The results suggest that indices computed with hyperspectral data exhibited higher R2 than multispectral data at the late jointing stage, head emergence stage, and filling stage. Furthermore, red-edge modified indices outperformed the traditional indices for both data genres. Inversion models indicated that the indices with short red-edge wavelengths showed better estimation at the early jointing and milk development stage, while indices with long red-edge wavelength estimate the sought variables better at the middle three stages. The results were consistent with the red-edge inflection point shift at different growth stages. The best indices for Sentinel-2 LAI retrieval, Sentinel-2 CCD retrieval, hyperspectral LAI retrieval, and hyperspectral CCD retrieval at five growth stages were determined in the research. These results are beneficial to crop trait monitoring by providing references for crop biophysical and biochemical parameters retrieval.
1. Introduction
Vegetation growth condition can be evaluated by both biophysical parameters as leaf area index (LAI) and biochemical parameters as canopy chlorophyll density (CCD). The parameters can also be extensively used in crop yield prediction (Aase, Citation1978; Chen, Zhang, & Tao, Citation2018; Duchemin et al., Citation2008; Houles, Guerif, & Mary, Citation2007; Huang et al., Citation2015). Leaf area index (LAI) is defined as the total one-sided leaf area on per unit ground area (Chen & Black, Citation1992). It indicates plant biophysical status like the leaf structure and foliage cover and can be used as an intermediate indicator to estimate biomass and fraction of absorbed photosynthetically active radiation (fAPAR) (Wang et al., Citation2007; Xiao et al., Citation2015, Citation2016). Different from LAI, chlorophyll content demonstrates the inner biochemical vigor of the leaves which can be used to estimate photosynthesis status. Chlorophyll content is related to nitrogen and it has been used to imply the nutrition status (Houlès et al., Citation2001; Yoder & Pettigrew-Crosby, Citation1995). The seasonal dynamics of LAI and chlorophyll content among temperate deciduous forest (Croft et al., Citation2015; Croft, Chen, & Zhang, Citation2014) and crops including maize and soybean have been studied (Houborg et al., Citation2015). The results showed that the parameter values vary with the growth stage. This can be concluded from the diverse characteristics of vegetation at different growth stages. Winter wheat leaves are sparse in the early stages therefore the LAI and CCD are relatively low, then the leaves grow larger and turn green which leads to an increase in parameter values. The yellow and senescent leaves come after the emergence of stems and spikes which result in a decrease of the parameters (Zhao et al., Citation2016). To better assess the growth conditions of crops, it is crucial to estimate variable dynamics accurately at different development stages.
The most common way to estimate crop parameters is to build empirical models with vegetation indices (VIs). Many vegetation indices have been developed for the past several decades. The basis of VI is the spectral reflectance response to pigments and leaf structure. According to previous research, the maximum absorbance of chlorophyll occurs between 660 nm and 680 nm (Wu et al., Citation2008). Most indices take advantage of the reflectance difference between red and near-infrared region for parameter retrieval. Normalized difference vegetation index (NDVI) is a benchmark among all the indices. It utilized the contrast between the maximum absorption in the red region attributed to chlorophyll pigments and the maximum reflection in the near infrared region because of leaf cellular structure (Rouse et al., Citation1974). Simple ratio (SR) takes advantage of the ratio between red and near-infrared reflectance based on the knowledge that leaves absorb more red light than infrared light (Jordan, Citation1969). To eliminate the effects from soil background, soil-adjust vegetation index (SAVI) was created with the adjusting factor to reduce the soil reflectance (Huete, Citation1988). To better grasp the spectral response to pigment variation, researchers developed triangular vegetation index (TVI) which is calculated as the triangle area embraced by the green peak, the chlorophyll absorption minimum, and the NIR shoulder in spectral region (Broge & Leblanc, Citation2001). Besides, indices aimed to retrieve chlorophyll were created, including chlorophyll absorption vegetation index (CARI) (Kim et al., Citation1994). To maximize the merits of indices and minimize their demerits, indices composed of two or more indices were created. They were proved to be good indicators for variables (Zarco-Tejada et al., Citation2004). The interfering factors for vegetation indices are also different at distinct growth stages. Soil reflectance, the canopy architecture and the amount of vegetation are the three main variables affecting the indices (Rondeaux, Steven, & Baret, Citation1996). For early stages, the soil background plays an important role in reflectance. The amount of leaves and canopy structure make independent and joint contribution to the variation of VI.
In recent years, studies have been focused on the development of red-edge modified vegetation indices. Red-edge spectral region was correlated with biophysical parameters at canopy scale while less sensitive to noise from soil background and atmospheric effect (Baret, Citation1992). Besides, red-edge region is positively related to leaf chlorophyll content while hardly affected by other structural properties (Horler et al., Citation1983a). The red-edge is the important spectral region for LAI assessment (Herrmann et al., Citation2011). Red-edge inflection point shifts towards longer wavelengths with the increase of nitrogen content or development stage and just as it shifts back to shorter wavelengths once the leaves turn yellow or withered (Horler, Citation1983b). Due to the sensitiveness to LAI and chlorophyll, indices replaced by red-edge bands have been used for parameter retrieval and they were proved to have good correlation with parameters (Xie et al., Citation2018). Researches showed that Sentinel-2 red-edge bands had an advantage in estimating vegetation parameters over other traditional VIs (Xie et al., Citation2019). Despite that many red-edge indices have been developed for variable retrieval, it is hard to infer from existing studies what are the optimal red-edge indices for distinct growth stages.
The objectives of this study are to: (1) compare the performances of red-edge bands centered at different wavelengths at early jointing, late jointing, head emergence, filling, and milk development stages of winter wheat; (2) evaluate the estimation ability of indices for both LAI and CCD; (3) select the optimal vegetation index for variables at key growth stages using both hyperspectral and Sentinel-2 images.
2. Study area and data acquisition
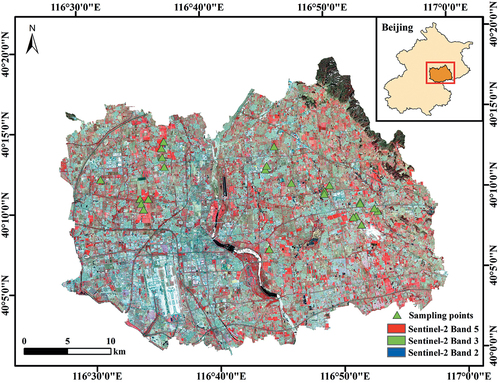
Winter wheat (Triticum aestivum L.), one of the main food crops that provides ample gluten protein to feed people, is the research object in this study. Accurate monitoring of the winter wheat growth condition helps to adjust the cultivation strategies and to increase production. We conducted field experiments at Shunyi District, Beijing, China (116°31ʹ10” E to 116°53ʹ26” E, 40°8ʹ2” N to 40°14ʹ0” N) as shown in . The Shunyi experiment site is a continuous winter wheat farmland for more than three years covered with silt-clay loam soil. The average temperature is 13.8 °C with annual rainfall of 507.7 mm. Winter wheat in Shunyi District was planted in October and harvested in late May of the next year. Field measurements were conducted in 2016 at five main growth stages of winter wheat: early jointing stage (April 7th – 8th), late jointing stage (April 20th −21st), head emergence stage (May 3rd −5th), filling stage (May 18th −19th), and milky development stage (June 6th-8th), to collect LAI, leaf chlorophyll content, and canopy reflectance. Twenty-four sampling units of 30 m × 30 m that evenly distributed in the field with different winter wheat cultivars were selected, as shown in . For each sampling unit, a 1 m × 1 m area was selected as the representative for sample collection. Thus, there are 24 samples for each growth stage.
Figure 1. Distribution of 24 sampling points in Shunyi District, Beijing.
2.1. Field data collection and processing
LAI measurements were collected by LAI-2200 plant canopy analyzer (LI-COR Biosciences, Inc., Lincoln, NE, USA). The LAI measurements were conducted during the daytime in bright sunny days. To minimize the measuring error, a 45° cap was used to avoid direct sunlight. To note that LAI measurements by LAI 2200 are effective LAI values (Chen, Citation1996). The final LAI value for each sampling unit was a statistical mean of 15 observations which includes five data readings (one A value above the canopy and four B values under the canopy with the same measuring heights) and two replications. The data for different growth stages were analyzed respectively for subsequent analysis.
There are two accepted units for chlorophyll content which are leaf chlorophyll concentration (LCC, % or g/g) and leaf chlorophyll density (LCD, µg/cm2). Research showed that remote sensing of leaf pigment should be performed on an area basis(Kattenborn et al., Citation2019). Besides, chlorophyll on canopy scale indicates more than leaf scale. Thus, the concept of chlorophyll density is used in this study. LCC measurements were conducted in the laboratory using winter wheat leaf samples with 1 m2 quadrat in each sampling units. Two circular leaf parts with an area of 0.25 cm2 were collected. One part was dried in the oven at 70°C for 48 h to obtain the determination of dry weight, while the other part was put into 10 ml of 80% acetone after measuring the fresh weight. Then another 15 ml of acetone were added, and there was a total of 25 ml in each tube. The mixture for each sample was filtered and placed in a cuvette. After storing in the dark at 25°C for 48 h, their absorbance at 470 nm, 646 nm and 663 nm were measured using an L6 ultraviolet-visible spectrophotometer (INESA, China). The calculation procedures of chlorophyll were based on the standard methods and equations (Zhou et al., Citation2017). To obtain chlorophyll based on area, the derived chlorophyll contents were multiplied by the corresponding leaf fresh weight and then divided by leaf area. Canopy chlorophyll density (CCD, µg/cm2) was calculated as the multiplication of LCD with corresponding LAI for each sampling units (Broge & Mortensen, Citation2002).
The statistical analysis of measured winter wheat LCD, LAI, and CCD at five growth stages in 2016 shows that the data range varied across different growth stages, as can be seen in . The statistical values of LCD and LAI showed similar but slightly different trends for five stages. They both increased from early jointing stage and peaked at head emergence to filling stage and then decreased. The maximum value of LAI appeared earlier than LCD. The CCD values displayed the identical variation with its component LCD and LAI.
Table 1. Statistical analysis of LCD, LAI and CCD at different growth stages.
2.2. Canopy spectra measurements and processing
For each sampling unit, canopy reflectance measurements were done within a 1 m × 1 m area of winter wheat using an ASD FieldSpec spectrometer (Analytical Spectral Devices, Inc., Boulder, CO, USA). The canopy spectra were collected under clear, blue-sky conditions between 10:00 and 14:00 local time. The spectrometer obtains reflectance from 350 to 1000 nm with a spectral resolution of 3 nm, and 10 nm resolution within the 1000–2500 nm spectral regions. Measurements were conducted from a nadir position at the height of 1.3 m above the ground and averaged by 10 scans. Reflectance was calibrated both before and after canopy measurements by a 0.4 m × 0.4 m white reference panel. In this study, reflectance between 400 nm and 1200 nm were used because of their sensitiveness and radiometric responses to vegetation variables (Boissard, Pointel, & Huet, Citation1993; Broge & Leblanc, Citation2001).
2.3. Sentinel-2 data acquisition and processing
Sentinel-2 satellites are part of Global Monitoring for Environment and Security (GMES) programme of the European Space Agency (ESA), including two sensors, Sentinel-2A and Sentinel-2B. The spatial resolution varies from 10 m to 60 m according to specific spectral bands. The satellite has 13 spectral bands ranging from the visible and near-infrared to the short-wave infrared including multiple red-edge bands which have been used widely. It has been used in agriculture widely and outperformed existing satellites with several red-edge bands (Dash & Curran, Citation2004; Gitelson, Keydan, & Merzlyak, Citation2006). Remote sensing images were acquired on five growth stages within three days of field measurements (April 8th, April 20th, May 3rd, May 18th, and June 9). We downloaded Sentinel-2 images taken on April 10th, April 23rd, May 3rd, May 14th, and June 9th, corresponding to the field campaigns at five growth stages. Spectral bands at 20 m spatial resolution were used and related to sampling units of 30 m × 30 m. Atmospheric correction was conducted using sen2cor plugin provided by http://step.esa.int/main/third-party-plugins-2/sen2cor. The details of sentinel-2 bands as shown in . Band 5 and band 6 are used as red-edge bands in this study.
Table 2. Central wavelength and bandwidth of Sentinel-2 spectral bands.
3. Methods
3.1. Calculation of VIs
Spectral vegetation indices with various forms have been developed to estimate vegetation variables over a range of species under a variety of conditions. Some indices were created to estimate the specific vegetation parameter and others are related to many parameters due to their sensitiveness to reflectance. The estimation abilities of indices have been comprehensively analyzed and discussed in previous literature (Dong et al., Citation2019; Vincini, Amaducci, & Frazzi, Citation2014). Three types of indices were selected based on previous research in this study. Their modifications with red-edge bands were also calculated. Spectral band 5, band 6 and band 7 of Sentinel-2 sensors are regarded as vegetation red-edge bands in certain studies (Delegido et al., Citation2011; Forkuor et al., Citation2018; Roy, Li, & Zhang, Citation2017). Considering the range of red-edge between 680 nm and 750 nm and the wavelengths of red-edge inflection point for winter wheat (Horler, Citation1983b), spectral band 5 with center wavelength of 705 nm and band 6 with center wavelength of 740 nm were used to modify the indices in this study (Clevers & Gitelson, Citation2013). The indices used in this study and the modified versions with red-edge are shown in .
Table 3. The list of vegetation indices used in this study.
3.1.1. Indices of normalized difference that are sensitive to LAI
Normalized difference vegetation index (NDVI) (Rouse et al., Citation1974), as a ubiquitous vegetation index in vegetation remote sensing, has been widely used in vegetation remote sensing due to its correlation with foliage density. It is an essential cornerstone for vegetation parameter retrieval. The contrast between red and near-infrared region makes it sensitive to chlorophyll pigment and leaf cellular structure while gets saturated under high vegetation cover or multi-layered canopy(Wu et al., Citation2008). Optimized soil-adjusted vegetation index (OSAVI) based on the form of ratio indices. It belongs to the optimized soil-adjusted index (SAVI) family which include soil-line parameters and aim to minimize influences from surface characteristics, soil background and atmospheric effects (Rondeaux et al., Citation1996). OSAVI increase the response to LAI or foliage cover and decreasing the variabilities due to soil with the optimum adjusting factor of 0.16.
Macc01, as a modification of NDVI, was created to model the spatial and temporal variations of LAI and chlorophyll during the whole growing season (Croft et al., Citation2014). It was originally applied for broadleaf forest and performed a strong relationship with chlorophyll content at the canopy scale. The index also based on the reflectance among the red-edge region.
3.1.2 Indices sensitive to chlorophyll
Green chlorophyll index (CIgreen) and red chlorophyll index (CIred) were derived from the research basis that reciprocal reflectance from 520 to 550 nm and 695 to 705 nm related closely to the total chlorophyll content in leaves of all species (Gitelson, Gritz, & Merzlyak, Citation2003; Gitelson et al., Citation2006).
The MERIS terrestrial chlorophyll index (MTCI) was developed according to the high correlation between red-edge position (REP) and chlorophyll content (Dash & Curran, Citation2004). It is capable of model spectra, field spectra and MERIS data. The index was correlated strongly with REP but not as sensitive to high chlorophyll content values as REP.
3.1.3 Indices of integrated form
The merits and defects of existed indices are obvious. For instance, NDVI was used to estimate vegetation parameters but it got saturated under high foliage cover. Furthermore, the usage of indices is limit. They might be able to retrieve one parameter accurately but might be resistant to others. Thus, new indices assemble two or more existed indices were developed to take advantage of strength from multiple indices and overcome the weakness. The combination of MCARI and OSAVI, TCARI and OSAVI were discussed in the study.
Modified chlorophyll absorption ratio index (MCARI) (Daughtry et al., Citation2000) and transformed chlorophyll absorption ratio index (TCARI) (Haboudane et al., Citation2002) were created to measure the light absorption by chlorophyll pigment with three spectral bands. They are both modifications of chlorophyll absorption ratio index (CARI) which aimed to minimize the effects from non-photosynthetic materials for the vegetation canopy APAR estimation (Kim et al., Citation1994). Research proved that MCARI combined with soil line vegetation index can reduce the soil reflectance properties (Daughtry et al., Citation2000; Wu et al., Citation2008). Thus, the integrated indices, MCARI/OSAVI and TCARI/OSAVI are used in this study.
3.2. LAI and CCD estimation and validation
The best-fit models between vegetation parameters and VIs at five growth stages were built and further used as estimation models. Five kinds of regression including linear, 2nd exponential, 3rd exponential, exponential, and logarithmic regression were used to select the best-fit models. The k-fold (k = 4) cross-validation was used to evaluate the results. In k-fold cross-validation, all the data were partitioned into k equal sized data sets randomly. One data set is retained as a validation set to test the model and the other k-1 sets were used as training sets. The process was repeated k times to make sure each data sets will be used exactly once for a validation. The benefit of cross-validation is that all the observations will be participated in training and validation process. Each data set will be used as training set for only once. Biased estimations derived from single dataset can be avoided. The performances of VIs were evaluated and compared using coefficient of determination (R2), root-mean-square error (RMSE), and bias (Richter, Atzberger, Hank, & Mauser, Citation2012). The R2 indicates the proportion of the variance that can be explained by the model. The RMSE indicates the errors that are associated with the model. The bias indicates whether the models overestimate or underestimate the vegetation parameters. The P-value was computed by transforming the correlation to t-statistics as an indicator for significance test. For each sought variable at different growth stages, the VI that yielded the high R2, low RMSE and low bias was considered a good retrieval index. To avoid the uncertainties from limited red-edge bands of Sentinel-2 data, indices computed with more red-edge spectral wavelengths of hyperspectral data were also used to further figure out the red-edge shift at different growth stages. The estimation models were validated using both Sentinel-2 data and hyperspectral data.
4. Results
4.1. Estimation models using Sentinel-2 data
Relationships between sought variables and VIs calculated from Sentinel-2 images were established to estimate vegetation parameters. To better analyze the performances of indices, we regard spectral indices calculated with the same form and different wavelengths as one index class. For instance, NDVI, NDVIre1, NDVIre2, and Maac01 all utilized the contrast between red and NIR bands and they are classified into one index class.
As shown in and , the R2 and RMSE of LAI and CCD varied at different growth stages. The R2 values of LAI estimation are higher at early jointing stage and milk development stage than the three middle stages which are late jointing stage, head emergence stage, and filling stage. According to the statistical analysis of LAI in , LAI value reached the peak at head emergence stage. However, the R2 are relatively low and the RMSE are high at head emergence stage. It can be contributed to the saturation effect when LAI is larger than 3 (Heiskanen et al., Citation2012). The variation trend also applies to indices for CCD estimation. Most red-edge modified indices performed better than their counterparts without red-edge bands over the five growth stages. Furthermore, red-edge modified indices outperformed traditional indices and the advantage of them over traditional indices are more apparent at early jointing, head emergence and filling stage than late jointing and milk development stage. The indices at different growth stages varied markedly.
Figure 2. Correlation results between LAI, CCD and VI calculated from Sentinel-2 data.
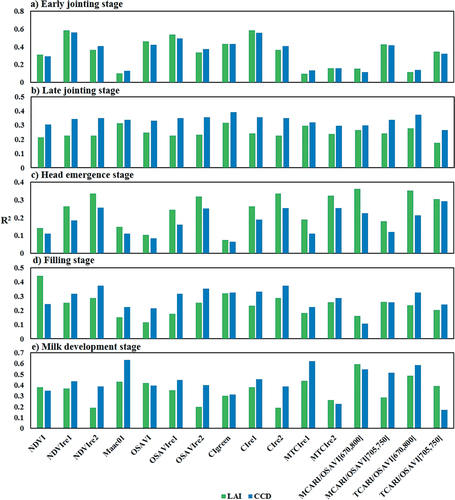
Table 4. RMSE and p-value between vegetation indicese and parameters with Sentinel-2 data
At early jointing stage, VIre1 (indices modified with Sentinel-2 Band 5) have better estimation than VIre2 (indices modified with Sentinel-2 Band 6) and traditional indices. The R2 between vegetation parameters and the same VI are similar. NDVIre1, OSAVIre1, and CIre1 showed better estimation for both LAI and CCD and they are much better than their counterparts with higher R2 and lower RMSE (as shown in and ). At this stage, the vegetation cover is low and sparse leaves hardly cover the soil background. In this way, sensors collect more soil information than plant information. The indices modified with wavelengths that are sensitive to pigment or leaf structure can't play their roles.
At late jointing stage, there is no significant difference between red-edge modified indices and traditional indices, nor obvious gap between indices with short red-edge wavelengths and those with long red-edge wavelengths. Indices performed relatively low R2 with both parameters and RMSE for all indices increased. The CCD estimation is slightly better than of LAI estimation.
At head emergence stage, VIre2 exhibited noticeably better estimation than that of VIre1; VIre1 performed higher R2 than normal VI. The R2 values are still low and RMSE values keep rising, though. Leaves keep growing larger and thicker and spikes appear at this stage. Different from late jointing stage, the estimation of LAI is better than that of CCD. For each index class, red-edge indices with longer wavelength have better performances than those with shorter wavelength and then followed by indices without red-edge bands. MCARI/OSAVI[670,800] performed the best estimation for LAI.
At filling stage, VIre2 showed noticeably better estimation results than VIre1. The difference between indices with short red-edge bands and indices with long red-edge bands is obvious. The R2 ranking for each index class is VIre2, VIre1, and normal indices. The RMSE arranged from small to large for index class is VIre2, VIre1, and normal indices. This variation is similar to head emergence stage. What different from head emergence stage is that the indices showed better estimation for CCD than LAI.
At milk development stage, the performances of indices are similar with those at early jointing stage. VIre1 outperformed VIre2 with higher R2 and lower RMSE values. Compared with head emergence stage and filling stage, there is an increase in R2 and a decrease in RMSE. The estimation of CCD is slightly better than that of LAI. It is obvious for Maac01 and MTCIre1. MCARI/OSAVI[670,800] is suitable for both LAI and CCD estimation. This can be attributed to more yellow and senescent leaves which leads to a decrease of chlorophyll content and an increase of brown pigment at this stage.
The finding on red-edge indices is consistent with previous result which indicates the REIP (red-edge inflection point) shifts toward shorter wavelengths are related to a decrease in green foliage cover, while the REIP shifts toward longer wavelengths are related to an increase in green vegetation density (Broge & Mortensen, Citation2002). Besides, the optimal vegetation index for each growth stage is distinct. The estimation for LAI and CCD showed similar trends but with slight difference for five growth stages. In general, NDVI and OSAVI are more capable of LAI estimation while CI, MTCI and the integrated indices TCARI/OSAVI and MCARI/OSAVI behaved better at late four growth stages. They took advantages of both chlorophyll absorption ratio index and soil-adjust vegetation index but displayed low correlation at early jointing stage. The estimation of CCD is better than that of LAI other than head emergence stage. This is consistent with the previous results that they are sensitive to chlorophyll content while resistant to LAI variations (Haboudane et al., Citation2002). Generally, indices for LAI estimation showed good estimation for CCD, too. Indices aimed to retrieve CCD don’t relate to LAI well. This can be attributed to that LAI plays a strong impact on the relationships between indices and chlorophyll content(Haboudane et al., Citation2002). While combining the LAI and chlorophyll content in CCD, the chlorophyll indices still work on CCD but are resistant to LAI. The highest R2 with LAI were performed by NDVIre1, CIgreen, MCARI/OSAVI[670,800], NDVI, and MCARI/OSAVI[670,800] for five stages, respectively. NDVIre1, CIgreen, TCARI/OSAVI[705,750], NDVIre2, and Maac01 showed the highest R2 with CCD at five growth stages.
4.2. Estimation models using hyperspectral data
In comparison with broad-band VIs, narrow-band VIs computed from hyperspectral data with higher spectral resolution may provide additional information for quantifying vegetation parameters. Two red-edge bands of Sentinel-2 sensors centred at 704 nm and 740 nm with moderate resolution were analyzed in section A. To further investigate the ability of red-edge bands with narrow wavelengths for vegetation parameter estimation and the optimal red-edge bands at five growth stages, we analyzed the performances of vegetation indices with hyperspectral data. To avoid the uncertainty derived from merely two red-edge bands, we modified indices with red-edge region wavelengths at 705 nm, 720 nm and 740 nm. Total 21 vegetation indices were calculated and their performances in parameter retrieval were analyzed (as shown in and ). The variation of indices at different growth stages is more regular, compared with Sentinel-2 indices.
Figure 3. Correlation results between LAI, CCD and VI calculated from hyperspectral data.
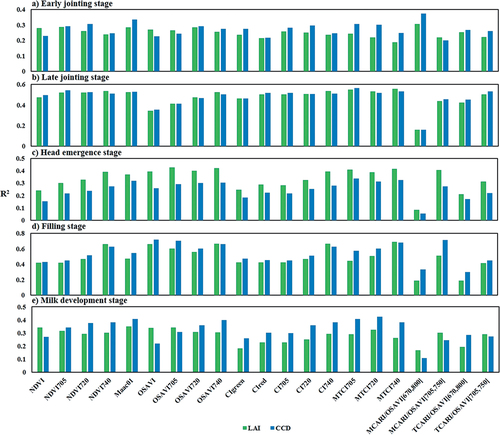
Table 5. RMSE and p-value between vegetation indices and parameters with hyperspectral data.
It is worth noticing that the estimation results derived from hyperspectral data for different growth stages are similar with that from Sentinel-2 data. For the indices with various wavelengths, the results consist with the conclusions in section A that the red-edge indices outperformed the normal ones under the most circumstances. The performances of red-edge indices for different growth stages varied. For early jointing stage, indices with wavelength center at 705 nm are better than those using 720 nm, 740 nm and traditional indices; the difference between red-edge wavelengths for each index class is not clear at late jointing stage; but for head emergence and filling stage, indices centered at 740 nm are quite better than other counterparts. The R2 can be ranked as VI740, VI720, VI705, and traditional indices. The indices with longer red-edge bands also performed the lower RMSE. When coming to the milk development stage, indices with shorter red-edge wavelength showed better estimation. These results are consistent with what we get from section A. The R2 increased from early jointing stage at low values, and peaked at filling stage. Then the R2 decreased to milk development stage. For RMSE, the variation kept pace with R2. The RMSE value increased from early jointing stage to head emergence stage and then decreased to milk development stage. Indices showed better estimation for LAI and CCD at late jointing stage, filling stage, and milk development stage with higher R2, lower RMSE, and p-value at higher significant level. The soil background has huge impact on canopy spectra at early growth stages.
For early jointing stage, there are sparse and young leaves above the soil ground. The dominant information can be soil background and dead leaves from the last year. The indices showed nearly equal performances with similar R2 and RMSE. The correlations between indices and parameters are relatively low but the OSAVI family showed good estimation. NDVI and its revisions are also able to estimate LAI and CCD at low foliage cover.
Situation changed at head emergence stage, the red-edge advantages is not obvious for OSAVI class but clear for NDVI class and CI class. The R2 slightly decreased and the RMSE increased at head emergence stage. The comparison between indices can be seen and OSAVI families performed better estimation for both CCD and LAI. The R2 of indices came up prominently at filling stage while there is a decrease in RMSE for most indices. CI740 showed a highest R2 value of 0.668 and RMSE value of 0.623 m2/m2 for LAI estimation and OSAVI performed with the highest R2 value of 0.719 and RMSE value of 57.631 µg/cm2 for CCD. The estimation for CCD is better than LAI. The optimal vegetation index for LAI retrieval at five stages are MCARI/OSAVI[705,750], CI740, OSAVI740, CI740, OSAVI, respectively. From the perspective of optimal indices at five stages, the 740 nm is useful for LAI retrieval. The optimal vegetation index of CCD retrieval are MCARI/OSAVI[705,750], Maac01, OSAVI740, OSAVI and Maac01 for five growth stages. The estimation of CCD is better than LAI at early jointing, filling and milk development stages. The contrast can be readily observed at milk development stage. Most leaves turn yellow from green at this stage. Spikes take up the most information in the field and leaves are underneath. Indices of normalized difference and of soil-adjust are sensitive to both LAI and CCD. While indices of chlorophyll and integrated forms are more suitable for CCD. The integrated indices showed pretty poor estimation with both parameters. Compared to results from section A, they were not as good as those with multispectral data. They behaved better for early jointing stage and worse for the other four stages, especially at late jointing and head emergence stage. Even R2 were low, the integrated indices correlated better with CCD than LAI. Most indices correlated with parameters very well with the highest R2 at the filling stage.
The estimation of variables with broad-band indices and narrow-band indices have been studied before (Broge & Leblanc, Citation2001; Elvidge & Chen, Citation1995). Although the defined equations are the same, the calculated values can be different. The RMSE of CCD from hyperspectral and multispectral data didn’t fluctuate much but vary a lot for LAI. Hyperspectral RMSE values are lower at late jointing, head emergence, and filling stages but higher at early jointing and milk development stages than multispectral RMSE values. The indices derived from multispectral data can contain more reflectance from more wavelengths while hyperspectral data are susceptible to canopy variation in narrow bands.
5. Validation
The estimation models were validated with Sentinel-2 satellite data and hyperspectral data for LAI and CCD with linear regression. The indices were calculated from their best fit models in Section A and Section B. The optimal indices at different growth stages were shown in . The best fit indices and models for distinct growth stages were derived from the results in Section 7 evaluated by R2 and RMSE. The illustrations of the validation results are shown in , the R2 of LAI and CCD are similar at five growth stages. They are consistent with results from 4.1. In general, the indices with shorter red-edge wavelengths are suitable for variables retrieval at early jointing stage and milk development stage. Indices with longer red-edge wavelengths are better for head emergence and filling stage.
Figure 4. Scatterplots of estimated vegetation parameters versus measured vegetation parameters for spectral indices with Sentinel-2 data and hyperspectral data. Red solid lines indicate 1:1 lines. The five rows from up to bottom indicate the validation results at early jointing stage, late jointing stage, head emergence stage, filling stage and milk development stage, separately. The four columns from left to right indicate the vegetation parameters as Sentinel-2 LAI, Sentinel-2 CCD, hyperspectral LAI and hyperspectral CCD.
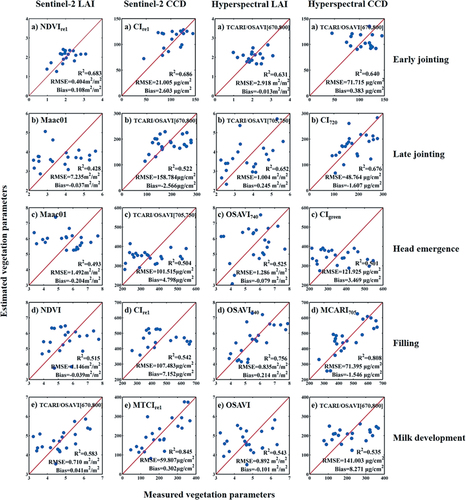
Part of the validation results are consistent with estimation models. Indices with shorter red-edge bands are better at early jointing stage for both multispectral and hyperspectral data and milk development stage. Nevertheless, some of the results can be different from what we got from previous sections. Indices without red-edge bands as NDVI and OSAVI can exhibit the best performance. The best retrieval of LAI appeared at early jointing stage. NDVI is suitable for LAI retrieval especially for low forage cover and shorter red-edge wavelength shows better estimation for early jointing stage. There are some scatterings to the 1:1 line at the other four growth stages. The retrieval for CCD at five stages showed better estimation than that for LAI and the best accuracy is at milk development stage with the R2 value of 0.845. The dispersion to 1:1 line is less but the parameter values at head emergence and filling stages were underestimated when CCD gets larger. The best indices for early jointing and milk development stage are with shorter red-edge wavelengths which are consistent with conclusions in section 4.1.
Overall, the optimal indices for Sentinel-2 LAI retrieval at five stages are NDVIre1, Maac01, Maac01, NDVI, and TCARI/OSAVI[670,800] in phenological order. The optimal indices for CCD are different from LAI retrieval which are CIre1 for early jointing stage, TCARI/OSAVI[670,800] for late jointing stage, TCARI/OSAVI[705,750] for head emergence stage, CIre1 for filling stage, and MTCIre1 for milk development stage. The results demonstrated that NDVI, Maac01 are better at LAI retrieval and CI with Sentinel-2 data, MTCI performed better for CCD retrieval. The integrated index form of TCARI/OSAVI can be capable for both LAI and CCD. The best indices for hyperspectral LAI retrieval are TCARI/OSAVI[670,800] for early jointing stage, TCARI/OSAVI[705,750] for late jointing stage, OSAVI740 for head emergence stage, OSAVI740 for filling stage, and OSAVI for milk development stage. The best indices for hyperspectral CCD retrieval are TCARI/OSAVI[670,800] for early jointing stage, CI720 for late jointing stage, CIgreen for head emergence stage, MCARI705 for filling stage and TCARI/OSAVI[670,800] for milk development stage, respectively. Generally, hyperspectral indices performed higher R2 at late jointing stage, head emergence stage, and filling stage, compared with multispectral indices. The advantage of multispectral data showed at early jointing stage and milk development stage. MCARI705 has a significant linear trend with CCD at filling stage. The optimal hyperspectral indices for LAI estimation at late jointing stage, head emergence stage and filling stage are with longer red-edge bands but indices without red-edge bands are better at early jointing stage and milk development stage.
The relationships of these indices with LAI and CCD were somehow divergent at late jointing stage, head emergence stage and filling stage.
6. Discussion
Both multispectral and hyperspectral data were utilized to establish the estimation models at different growth stages in this study. The performances of red-edge indices varied with different growth stages for both Sentinel-2 data and hyperspectral data. We analyzed the red-edge movement with Sentinel-2 Band 5 and Band 6 at first. For early growth stages, VIre1 showed better estimation for both LAI and CCD; when crops grow to head emergence and filling stage,VIre2 outperformed other indices; and finally, VIre1 established better correlation with vegetation parameters at milk development stage. Furthermore, we took advantage of fine spectral resolution of hyperspectral bands at 705 nm, 720 nm, and 740 nm to analyze the red-edge movement. The 720 nm is a supplement between merely two red-edge bands from Sentinel-2. It turned out that at early jointing stage, the performances ranked as VI705, VI720, VI740, and normal indices. At head emergence and filling stage, the rank is in reverse which is VI740 is better than VI720, VI705, and normal indices. When coming to milk development stage, the performances are same as early jointing stage. The variation can be attributed to the shift of red-edge inflection point caused by the growth status of crop plant at different development stages. Studies showed that with the increase of nitrogen content or development stage, red-edge inflection point moves to longer wavelength. Once the leaves turn yellow or withered it moves back to shorter wavelength(Horler, Citation1983b). Foliage cover at early jointing and milk development stages can be relatively low. Soil information exerts an influence on reflectance. For late jointing, head emergence and filling stages, green leaves grow and leads to more absorption in red region (from 600 nm to 760 nm) and more reflection in green region (around 550 nm). Near-infrared region (from 700 nm to 1300 nm) reflect more due to the leaf cellular structure(Colwell, Citation1974).
The best indices between data genres are various. Most indices (Macc01, integrated indices MCARI/OSAVI, TCARI/OSAVI excluded) had better correlation with vegetation parameters computed with hyperspectral than multispectral images at late jointing, head emergence, and filling stage. However, the situation is opposite at early jointing stage and milk development stage. These can be contributed to several factors: 1) spatial resolution, 2) bandwidth, and 3) atmospheric effect. Imaging spectrometer sampled surface radiance information in contiguous narrow band between 400 and 2500 nm(Darvishzadeh et al., Citation2008). Hyperspectral data were collected by field measurement using imaging spectrometer with a spatial resolution at nm level. The mean orbital altitude of Sentinel-2 is 786 km with spatial resolution of 20 m for red-edge bands. In this way, hyperspectral images can track the spectral reflectance variation in narrow spectral regions caused by LAI or CCD. Bandwidth can be an important interfering factor in LAI inversion (Liang et al., Citation2020). Different vegetation indices have their own preference for bandwidths. The difference lies in whether the index needs to be accurately located or utilized the spectral region information as much as possible. Some vegetation indices are more sensitive to narrow bandwidths, just as some indices are better used with broad bandwidths. Indices like NDVI, OSAVI, and their counterparts with red-edge showed stable performance when using both Sentinel-2 and hyperspectral data. Integrated indices of TCARI/OSAVI[670,800] and MCARI/OSAVI[670,800] showed better estimations using Sentinel-2 data but did not perform as well when using hyperspectral data. Compared to Sentinel-2 multispectral images, ASD measured spectra are less affected by atmospheric scattering effects. Scattering in visible bands inflates the red and red-edge component of the related indices which dampens the contrast between NIR and red/red-edge, and diminishes indices values (Lee et al., Citation2004). It is quite interesting that the variation patterns of different data sources and different wavelengths are similar. Multispectral have better estimation than hyperspectral data at early jointing stage and milk development stage as shorter red-edge indices outperformed longer red-edge indices. Nevertheless, hyperspectral indices showed higher R2 than multispectral indices as longer red-edge indices compared with shorter red-edge indices. The atmospheric scattering has more effect at late jointing, head emergence, and filling stages. This explains why hyperspectral indices were considerably higher than multispectral indices with vegetation parameters. The estimation results for LAI and CCD are similar and the estimation for CCD at milk development stage is relatively better than any other estimations. Compared to overall retrieval in pervious literature (Delloye, Weiss, & Defourny, Citation2018; Pasqualotto et al., Citation2019), the R2 can be relatively low in this validation. The variable value range is relatively smaller than that of overall stages which makes it harder to generate a relationship. This can be another reason hampering the estimation.
7. Conclusion
Red-edge spectral region helps improve the retrieval accuracy of LAI and CCD retrieval. In this study, we evaluated the vegetation indices modified with various red-edge wavelengths at different growth stages. Summarizing, the indices modified with red-edge have better correlation with LAI and CCD compared to the normal indices and the red-edge indices are especially advantaged over other indices at late jointing, head emergence, filling stages than early jointing stage and milk development stage. According to our research, the indices modified with longer red-edge wavelength performed better estimation for LAI and CCD at late jointing, head emergence, and filling stage. The results indicate that vegetation indices with spectral band centered at 740 nm (Sentinel-2 band 6) is suitable for LAI and CCD estimation at late jointing, head emergence, and filling stage. The spectral band 5 of Sentinel-2, centered at 704 nm, is suitable for variable estimation at early jointing and milk development stages. Indices calculated using hyperspectral data show consistent results with those calculated using Sentinel-2 data. NDVI, OSAVI and their modified counterparts performed remarkedly at both LAI and CCD estimation, while CI and integrated indices are more suitable for CCD estimation. This paper conducted vegetation parameter retrieval using both hyperspectral data and multispectral data combined with red-edge bands. The results can be further applied to vegetation dynamic monitoring. Remote sensing techniques provide insight into detection of physiological status. However, the established vegetation indices that generally for all growth stages, might lack predictive accuracy for vegetation growth at different growth stages. This study investigates the most relevant bands and VIs for crop traits monitoring. Moreover, it provides reference for the design of future sensors, particularly those with red-edge bands.
Disclosure statement
No potential conflict of interest was reported by the author(s).
Data availability statement
For the moment, the data from the project are not available due to restrictions.
Additional information
Funding
Notes on contributors
Naichen Xing
Naichen Xing is a student from Aerospace Information Research Institute, Chinese Academy of Sciences, Beijing, China (AIRCAS). She is currently working toward the Ph.D. degree in cartography and geographic information systems at AIRCAS. Her research interests include vegetation biophysical and biochemical parameter retrieval using hyperspectral and multispectral data.

Wenjiang Huang
Wenjiang Huang received the Ph.D. degree in cartography and GIS from Beijing Normal University, Beijing, China, in 2005. Currently, he is a Professor with the Key Laboratory of Digital Earth Science, Aerospace Information Research Institute, Chinese Academy of Sciences, Beijing, China. His research interests include quantitative remote sensing research and application in vegetation.
Huichun Ye
Huichun Ye received his Ph.D. degree in agricultural resources and the environment from China Agricultural University in 2014. He is an associate research fellow with the Key Laboratory of Digital Earth Science, Aerospace Information Research Institute, Chinese Academy of Sciences, Beijing, China. His current research interests include quantitative remote sensing application in vegetation monitoring and precision agriculture.
Yingying Dong
Yingying Dong received the B.S. degree in information and computation science from Shandong Normal University, Shandong, China, in 2006, the M.S. degree in mathematics of computation from Capital Normal University, Beijing, China, in 2009, and the Ph.D. degree in agricultural remote sensing and information technology from Zhejiang University, Zhejiang, China, in 2013. Her research interests include research and application in vegetation remote sensing.

Weiping Kong
Weiping Kong received the Ph.D. degree at Institute of Remote Sensing and Digital Earth, Chinese Academy of Sciences, in 2018. She is currently working in Aerospace Information Research Institute, Chinese Academy of Sciences. Her research interest includes remote retrieval of vegetation biochemical parameters.

Yu Ren
Yu Ren, received the B.E. degree in application and technology of remote sensing in Chengdu University of Technology, Chengdu, China, in 2015, and the M.S. degree in geology from Chengdu University of Technology, China, in 2018. She is currently pursuing the Ph.D. degree in cartography and geographic information systems from Aerospace Information Research Institute, Chinese Academy of Sciences, Beijing, China. Her current research interests include research and application in quantitative vegetation remote sensing.
Qiaoyun Xie
Qiaoyun Xie is a researcher in remote sensing with expertise in vegetation monitoring, and currently works at the University of Technology in Australia. Her main research interest are using satellite data for vegetation monitoring, including vegetation parameter retrieval, vegetation dynamics, landscape phenology processes, and their shifting seasonalities with climate variability. She also uses airborne remote sensing data and field measurements to observe land surface responses and interactions with climate, land use activities, and major disturbance events.
References
- Aase, J. (1978). Relationship between leaf area and dry matter in winter wheat 1. Agronomy Journal, 70(4), 563–565.
- Baret F, Jacquemoud S, Guyot G, et al. (1992). Modeled analysis of the biophysical nature of spectral shifts and comparison with information content of broad bands. Remote Sensing of Environment, 41(2–3), 133–142.
- Barnes E M, Clarke T R, Richards S E, et al. Coincident detection of crop water stress, nitrogen status and canopy density using ground based multispectral data. in Proceedings of the Fifth International Conference on Precision Agriculture, Bloomington, MN, USA. 2000.
- Boissard, P., Pointel, J.-G., & Huet, P. (1993). Reflectance, green leaf area index and ear hydric status of wheat from anthesis until maturity. International Journal of Remote Sensing, 14(14), 2713–2729.
- Broge, N. H., & Leblanc, E. (2001). Comparing prediction power and stability of broadband and hyperspectral vegetation indices for estimation of green leaf area index and canopy chlorophyll density. Remote Sensing of Environment, 76(2), 156–172.
- Broge, N. H., & Mortensen, J. V. (2002). Deriving green crop area index and canopy chlorophyll density of winter wheat from spectral reflectance data. Remote Sensing of Environment, 81(1), 45–57.
- Chen, J. M. (1996). Optically-based methods for measuring seasonal variation of leaf area index in boreal conifer stands. Agricultural and Forest Meteorology, 80(2–4), 135–163.
- Chen, J. M., & Black, T. (1992). Defining leaf area index for non‐flat leaves. Plant, Cell & Environment, 15(4), 421–429.
- Chen, Y., Zhang, Z., & Tao, F. (2018). Improving regional winter wheat yield estimation through assimilation of phenology and leaf area index from remote sensing data. European Journal of Agronomy, 101, 163–173.
- Clevers, J. G., & Gitelson, A. A. (2013). Remote estimation of crop and grass chlorophyll and nitrogen content using red-edge bands on Sentinel-2 and-3. International Journal of Applied Earth Observation and Geoinformation, 23, 344–351.
- Colwell, J. E. (1974). Vegetation canopy reflectance. Remote Sensing of Environment, 3(3), 175–183.
- Croft H, Chen J M, Froelich N J, et al. (2015). Seasonal controls of canopy chlorophyll content on forest carbon uptake: Implications for GPP modeling. Journal of Geophysical Research: Biogeosciences, 120(8), 1576–1586.
- Croft, H., Chen, J. M., & Zhang, Y. (2014). Temporal disparity in leaf chlorophyll content and leaf area index across a growing season in a temperate deciduous forest. International Journal of Applied Earth Observation and Geoinformation, 33, 312–320.
- Darvishzadeh R, Skidmore A, Atzberger C, et al. (2008). Estimation of vegetation LAI from hyperspectral reflectance data: Effects of soil type and plant architecture. International Journal of Applied Earth Observation and Geoinformation, 10(3), 358–373.
- Dash, J., & Curran, P. (2004). The MERIS terrestrial chlorophyll index, International Journal of Remote Sensing, 25(23), 5403–5413. doi: 10.1080/0143116042000274015.
- Daughtry C S T, Walthall C L, Kim M S, et al. (2000). Estimating corn leaf chlorophyll concentration from leaf and canopy reflectance. Remote Sensing of Environment, 74(2), 229–239.
- Delegido, J., Verrelst, J., Alonso, L., & Moreno, J. (2011). Evaluation of sentinel-2 red-edge bands for empirical estimation of green LAI and chlorophyll content. Sensors, 11(7), 7063–7081.
- Delloye, C., Weiss, M., & Defourny, P. (2018). Retrieval of the canopy chlorophyll content from Sentinel-2 spectral bands to estimate nitrogen uptake in intensive winter wheat cropping systems. Remote Sensing of Environment, 216, 245–261.
- Dong, T., Liu, J., Shang, J., Qian, B., Ma, B., Kovacs, J. M., . . . & Shi, Y. (2019). Assessment of red-edge vegetation indices for crop leaf area index estimation. Remote Sensing of Environment, 222, 133–143.
- Duchemin, B., Maisongrande, P., Boulet, G., & Benhadj, I. (2008). A simple algorithm for yield estimates: Evaluation for semi-arid irrigated winter wheat monitored with green leaf area index. Environmental Modelling and Software, 23(7), 876–892.
- Elvidge, C. D., & Chen, Z. (1995). Comparison of broad-band and narrow-band red and near-infrared vegetation indices. Remote Sensing of Environment, 54(1), 38–48.
- Forkuor, G., Dimobe, K., Serme, I., & Tondoh, J. E. (2018). Landsat-8 vs. Sentinel-2: Examining the added value of sentinel-2’s red-edge bands to land-use and land-cover mapping in Burkina Faso. GIScience & Remote Sensing, 55(3), 331–354.
- Gitelson, A. A., Gritz, Y., & Merzlyak, M. N. (2003). Relationships between leaf chlorophyll content and spectral reflectance and algorithms for non-destructive chlorophyll assessment in higher plant leaves. Journal of Plant Physiology, 160(3), 271–282.
- Gitelson, A. A., Keydan, G. P., & Merzlyak, M. N. (2006). Three‐band model for noninvasive estimation of chlorophyll, carotenoids, and anthocyanin contents in higher plant leaves. Geophysical Research Letters, 33, L11402, doi:10.1029/2006GL026457.
- Haboudane, D., Miller, J. R., Tremblay, N., Zarco-Tejada, P. J., & Dextraze, L. (2002). Integrated narrow-band vegetation indices for prediction of crop chlorophyll content for application to precision agriculture. Remote Sensing of Environment, 81(2–3), 416–426.
- Heiskanen, J., Rautiainen, M., Stenberg, P., Mõttus, M., Vesanto, V.-H., Korhonen, L., & Majasalmi, T. (2012). Seasonal variation in MODIS LAI for a boreal forest area in Finland. Remote Sensing of Environment, 126, 104–115.
- Herrmann, I., Pimstein, A., Karnieli, A., Cohen, Y., Alchanatis, V., & Bonfil, D. J. (2011). LAI assessment of wheat and potato crops by VENμS and Sentinel-2 bands. Remote Sensing of Environment, 115(8), 2141–2151.
- Horler, D. N. H., Dockray, M., Barber, J., & Barringer, A. R. (1983a). Red edge measurements for remotely sensing plant chlorophyll content. Advances in Space Research, 3(2), 273–277.
- Horler, D. (1983b). M. DOCKRAY, and J. Barber. The Red Edge of Plant Leaf Reflectance. International Journal of Remote Sensing, 4(2), 273–288.
- Houborg, R., McCabe, M., Cescatti, A., Gao, F., Schull, M., & Gitelson, A. (2015). Joint leaf chlorophyll content and leaf area index retrieval from Landsat data using a regularized model inversion system (REGFLEC). Remote Sensing of Environment, 159, 203–221.
- Houlès, V., Mary, B., Machet, J. M., Guerif, M., & Moulin, S. (2001). Do crop characteristics available from remote sensing allow to determine crop nitrogen status. In 3. ECPA. ENSAM.
- Houles, V., Guerif, M., & Mary, B. (2007). Elaboration of a nitrogen nutrition indicator for winter wheat based on leaf area index and chlorophyll content for making nitrogen recommendations. European Journal of Agronomy, 27(1), 1–11.
- Huang, J., Tian, L., Liang, S., Ma, H., Becker-Reshef, I., Huang, Y., . . . & Wu, W. (2015). Improving winter wheat yield estimation by assimilation of the leaf area index from Landsat TM and MODIS data into the WOFOST model. Agricultural and Forest Meteorology, 204, 106–121.
- Huete, A. (1988). Huete, AR A soil-adjusted vegetation index (SAVI). Remote sensing of environment. Remote Sensing of Environment, 25(3), 295–309.
- Jordan, C. F. (1969). Derivation of leaf‐area index from quality of light on the forest floor. Ecology, 50(4), 663–666.
- Kattenborn, T., Schiefer, F., Zarco-Tejada, P., & Schmidtlein, S. (2019). Advantages of retrieving pigment content [μg/cm2] versus concentration [%] from canopy reflectance. Remote Sensing of Environment, 230, 111195.
- Kim, M. S., Daughtry, C. S. T., Chappelle, E. W., McMurtrey, J. E., & Walthall, C. L. (1994). The use of high spectral resolution bands for estimating absorbed photosynthetically active radiation (A par), CNES, Proceedings of 6th International Symposium on Physical Measurements and Signatures in Remote Sensing.
- Lee, K. S., Cohen, W. B., Kennedy, R. E., Maiersperger, T. K., & Gower, S. T. (2004). Hyperspectral versus multispectral data for estimating leaf area index in four different biomes. Remote Sensing of Environment, 91(3–4), 508–520.
- Liang, L., Huang, T., Di, L., Geng, D., Yan, J., Wang, S., . . . & Kang, J. (2020). Influence of different bandwidths on LAI estimation using vegetation indices. IEEE Journal of Selected Topics in Applied Earth Observations and Remote Sensing, 13, 1494–1502.
- Pasqualotto, N., Delegido, J., Van Wittenberghe, S., Rinaldi, M., & Moreno, J. (2019). Multi-crop green LAI estimation with a new simple Sentinel-2 LAI Index (SeLI). Sensors, 19(4), 904.
- Richter, K., Atzberger, C., Hank, T. B., & Mauser, W. (2012). Derivation of biophysical variables from Earth observation data: Validation and statistical measures. Journal of Applied Remote Sensing, 6(1), 063557.
- Rondeaux, G., Steven, M., & Baret, F. (1996). Optimization of soil-adjusted vegetation indices. Remote Sensing of Environment, 55(2), 95–107.
- Rouse, J. W., Haas, R. H., Schell, J. A., & Deering, D. W. (1974). Monitoring vegetation systems in the Great Plains with ERTS. NASA Special Publication, 351, 309.
- Roy, D. P., Li, Z., & Zhang, H. K. (2017). Adjustment of Sentinel-2 multi-spectral instrument (MSI) Red-Edge band reflectance to Nadir BRDF adjusted reflectance (NBAR) and quantification of red-edge band BRDF effects. Remote Sensing, 9(12), 1325.
- Vincini, M., Amaducci, S., & Frazzi, E. (2014). Empirical estimation of leaf chlorophyll density in winter wheat canopies using sentinel-2 spectral resolution. IEEE Transactions on Geoscience and Remote Sensing, 52(6), 3220–3235.
- Wang, P., Sun, R., Hu, J., Zhu, Q., Zhou, Y., Li, L., & Chen, J. M. (2007). Measurements and simulation of forest leaf area index and net primary productivity in Northern China. Journal of Environmental Management, 85(3), 607–615.
- Wu, C., Niu, Z., Tang, Q., & Huang, W. (2008). Estimating chlorophyll content from hyperspectral vegetation indices: Modeling and validation. Agricultural and Forest Meteorology, 148(8–9), 1230–1241.
- Xiao, Z., Liang, S., Sun, R., Wang, J., & Jiang, B. (2015). Estimating the fraction of absorbed photosynthetically active radiation from the MODIS data based GLASS leaf area index product. Remote Sensing of Environment, 171, 105–117.
- Xiao, Z., Liang, S., Wang, T., & Jiang, B. (2016). Retrieval of leaf area index (LAI) and fraction of absorbed photosynthetically active radiation (FAPAR) from VIIRS time-series data. Remote Sensing, 8(4), 351.
- Xie, Q., Dash, J., Huang, W., Peng, D., Qin, Q., Mortimer, H., … & Ye, H. (2018). Vegetation indices combining the red and red-edge spectral information for leaf area index retrieval. IEEE Journal of Selected Topics in Applied Earth Observations and Remote Sensing, 11(5), 1482–1493.
- Xie, Q., Dash, J., Huang, W., Peng, D., Qin, Q., Mortimer, H., . . . & Ye, H. (2019). Retrieval of crop biophysical parameters from Sentinel-2 remote sensing imagery. International Journal of Applied Earth Observation and Geoinformation, 80, 187–195.
- Yoder, B. J., & Pettigrew-Crosby, R. E. (1995). Predicting nitrogen and chlorophyll content and concentrations from reflectance spectra (400–2500 nm) at leaf and canopy scales. Remote Sensing of Environment, 53(3), 199–211.
- Zarco-Tejada, P. J., Miller, J. R., Morales, A., Berjón, A., & Agüera, J. (2004). Hyperspectral indices and model simulation for chlorophyll estimation in open-canopy tree crops. Remote Sensing of Environment, 90(4), 463–476.
- Zhao, C., Li, H., Li, P., Yang, G., Gu, X., & Lan, Y. (2016). Effect of vertical distribution of crop structure and biochemical parameters of winter wheat on canopy reflectance characteristics and spectral indices. IEEE Transactions on Geoscience and Remote Sensing, 55(1), 236–247.
- Zhou, X., Huang, W., Kong, W., Ye, H., Dong, Y., & Casa, R. (2017). Assessment of leaf carotenoids content with a new carotenoid index: Development and validation on experimental and model data. International Journal of Applied Earth Observation and Geoinformation, 57, 24–35.