
ABSTRACT
Urban land use information that reflects socio-economic functions and human activities is critically essential for urban planning, landscape design, environmental management, health promotion, and biodiversity conservation. Land-use maps outlining the distribution, pattern, and composition of essential urban land use categories (EULUC) have facilitated a wide spectrum of applications and further triggered new opportunities in urban studies. New and improved Earth observations, algorithms, and advanced products for extracting thematic urban information, in association with emerging social sensing big data and auxiliary crowdsourcing datasets, all together offer great potentials to mapping fine-resolution EULUC from regional to global scales. Here we review the advances of EULUC mapping research and practices in terms of their data, methods, and applications. Based on the historical retrospect, we summarize the challenges and limitations of current EULUC studies regarding sample collection, mixed land use problem, data and model generalization, and large-scale mapping efforts. Finally, we propose and discuss future opportunities, including cross-scale mapping, optimal integration of multi-source features, global sample libraries from crowdsourcing approaches, advanced machine learning and ensembled classification strategy, open portals for data visualization and sharing, multi-temporal mapping of EULUC change, and implications in urban environmental studies, to facilitate multi-scale fine-resolution EULUC mapping research.
1. Introduction
Land use/land cover (LULC) has been considered one of the most important factors that reflect the underlying natural and anthropogenic processes of global environmental change (Foody, Citation2002; Herold, Mayaux, Woodcock, Baccini, & Schmullius, Citation2008; Running, Citation2008; Turner, Lambin, & Reenberg, Citation2007). It has been widely recognized that LULC pattern and changes affect and link with many aspects of ecosystem function and human health (Foley et al., Citation2005) and play a critical role in modulating climate change (Feddema et al., Citation2005; Findell et al., Citation2017; Pielke Sr et al., Citation2011), maintaining ecosystem (Verburg, Van De Steeg, Veldkamp, & Willemen, Citation2009), conserving biodiversity (Gámez-Virués et al., Citation2015), and promoting planetary health (Rockström et al., Citation2009; Whitmee et al., Citation2015). Accurate and timely classification, mapping, and monitoring of LULC and its changes are of great importance to a broad spectrum of research themes in Earth observation and global environmental change since they can provide essential knowledge for understanding the Earth’s dynamics.
Satellite and airborne remote sensing have greatly facilitated LULC monitoring by providing spatially explicit and temporally continuous information from regional to global scales (Gong et al., Citation2013; Hansen et al., Citation2013). In recent decades, with the development of new satellite sensors, improved classifiers, machine learning algorithms, and cloud computing, many remote sensing based LULC classification products have been produced and publicly available at multiple spatial resolutions. Representative datasets include (i) coarse-resolution ones from 100 m to 1 km, e.g. the 1-km International Geosphere-Biosphere Programme data and information system cover (IGBP-DISCover) map (Loveland et al., Citation2000), the 1-km University of Maryland (UMD) land cover map (Hansen, DeFries, Townshend, & Sohlberg, Citation2000), the 1-km global land cover classification product (GLC2000) (Bartholome & Belward, Citation2005), the 1-km and 500-m Moderate Resolution Imaging Spectrometer (MODIS) land cover maps (Friedl et al., Citation2010; Tateishi et al., Citation2011), the 300-m global land cover map (GlobCover) derived from Medium Resolution Imaging Spectrometer (MERIS) dataset (Arino et al., Citation2012), the 300-m European Space Agency (ESA) Climate Change Initiative (CCI) land cover maps from 1992 to 2015 (UCL-Geomatics , Citation2017), the 100-m ESA Copernicus Global Land Service Land Cover Map (CGLS-LC100) (Buchhorn et al., Citation2020), and the 100-m global land cover fraction map (Masiliūnas et al., Citation2021); (ii) fine-resolution ones from 10 m to 30 m, e.g. the 30-m finer resolution observation and monitoring of global land cover (FROM-GLC30) (Gong et al., Citation2013), the 30-m global land cover data product (GlobeLand30) (Chen et al., Citation2015), the 30-m global land-cover product with fine classification system (GLC_FCS30) (Zhang et al., Citation2020a), the most recent 30-m intelligent mapping of global land cover (iMap World 1.0) (Liu et al., Citation2021), the 20-m ESA CCI Sentinel-2 prototype land cover map of Africa in 2016 (Lesiv et al., Citation2017), and the 10-m finer resolution observation and monitoring of global land cover (FROM-GLC10) (Gong et al., Citation2019); and (iii) high-resolution one less than 10 m, e.g. the recent 3-m national land cover map in China based on Planet Imagery (Dong et al., Citation2021).
Urban land use is the highest level of human modification on Earth (Gong et al., Citation2020a; Theobald et al., Citation2020). Despite their small proportion (<1%) covering the land surface (Schneider, Friedl, & Potere, Citation2010), urban areas have accommodated more than 50% of the global population (Nations, Citation2018) and exerted a disproportionate influence on their surroundings in terms of mass, energy, and resource fluxes (Cao, Chen, Imura, & Higashi, Citation2009). In addition to the global LULC maps that outline the general distribution and pattern of urban extents, a group of global thematic products regarding impervious areas have been developed (), including Global Human Settlement Layer (Gong & Howarth, Citation1990, Citation1992; Pesaresi et al., Citation2013), Human Built-up and Settlement Extent (Wang, Huang, Brown De Colstoun, Tilton, & Tan, Citation2017), Global Man-made Impervious Surface (Brown De Colstoun et al., Citation2017), Global Artificial Impervious Area (Gong et al., Citation2020b), and other global impervious maps using Normalized Urban Areas Composite Index (NUACI) (Liu et al., Citation2018) and multi-source, multi-temporal random forest classification (MSMT_RF) (Zhang et al., Citation2020b). The above-mentioned remote sensing based impervious area products are binary classification by grouping all impervious surface areas into one class. However, maps contain knowledge on the distribution, pattern, and composition of different land-use types in urban areas, are still limited by the data available from government agencies and the spatial coverage at city and regional levels (Gong et al., Citation2020a). Moreover, the mapping standard on data sources, methods, land use classification units and schemes, and updating frequency varies across different cities and regions, due to extreme difficulties in (i) differentiating complex urban built-up areas to functional labels; (ii) coordinating financial input and skills of mapping personnel (Gong et al., Citation2020a); and (iii) securing the availability of spatially and temporally explicit datasets with high to very high resolutions.
Figure 1. Land use/land cover classification. (a) Global land cover map to thematic impervious area map and urban land use map; and (b) classification unit from pixel to object and parcel
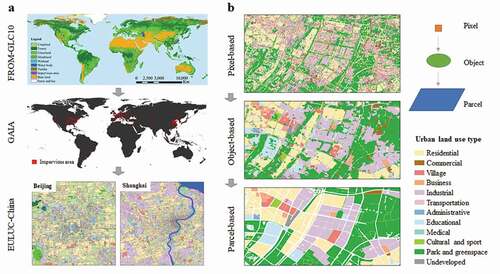
Detailed urban land use information that reflects socio-economic functions and human activities is critically important for urban planning, landscape design, environmental management, disaster control, human health promotion, and biodiversity conservation (Chen et al., Citation2021b). To better inform high-level semantic information of urban components and uncover the spatially explicit distribution of various land use types, many previous studies have used multi-source and multi-scale remote sensing datasets and different classification algorithms to delve into urban land use classification (). Here we categorize them into three classes by the minimum size of their spatial representation as pixel, object, and parcel (Chen et al., Citation2021b). The pixel-based approaches mainly use spectral, texture, and auxiliary features to differentiate land-use types in direct classifications. For example, Gong, Marceau, and Howarth (Citation1992) integrated spatial and spectral features from Système Pour l’Observation de laTerre (SPOT) HRV multispectral data to classify two-level land uses at the rural-urban fringe of Metropolitan Toronto using a Gaussian maximum likelihood classifier. Since urban areas commonly comprise a complex spatial assemble of spectrally distinct land-cover types, per-pixel classification algorithms will not be suitable to quantify urban land uses without very high spatial resolution satellite sensors. Barnsley and Barr (Citation1996) proposed to classify the image into broad land-cover types at the first stage and then group the classified pixels into different land-use categories based on their frequency and spatial arrangement within a square kernel at the second stage. However, these pioneering studies are largely limited to local scale experimental tests due to restrictions in data availability. Leveraging the medium spatial resolution Landsat dataset, Lu and Weng (Citation2006) applied the spectral mixture analysis in classifying residential areas with different intensities and the integrated class of commercial, industrial, and transportation land uses. However, the classification scheme is too general without differentiating specific commercial, industrial, or transportation classes. Nevertheless, the complexity of the urban system makes it difficult for single-type remotely sensed data to identify different land use types and functional zones. A growing trend of recent studies is the integration of multi-source and multi-platform datasets to address this challenge. For example, Man, Dong, and Guo (Citation2015a) aimed to derive pixel-based urban land-use classification with 15 classes by fusing structural and height information from Lidar and spectral and texture information of hyperspectral imagery. Theobald (Citation2014) combined an expansive set of features from housing and employment census, infrastructure, and National Land Cover Dataset (NLCD) to produce a 30-m map of land use for the conterminous United States, including 79 land use types within five major categories: built-up, production, recreation, conservation, and water.
The new and improved satellite sensors that provide high-resolution (HR) and very-high-resolution (VHR) remote sensing imagery (e.g. IKNONS, Worldview, Quick Bird, etc.) have opened up new opportunities for detailed mapping and analysis of urban land use. It is now possible to identify the geometry, texture, size, location, and adjacent information of ground objects at a much finer scale (Zhang et al., Citation2018; Zhong et al., Citation2020). Object-based approaches are becoming more popular and widely used to classify urban land-use types with two general stages, including the object segmentation from VHR remote sensing imagery and object-based land use classification. Image segmentation techniques aim at grouping pixels into homogeneous objects with consistent composition and continuous pattern, for instance, in spectrums, textures, and shapes. They generate a complete set of individual segmented “land-cover objects” that can be a tree, building, water body, road, etc. The subsequent stage is to use the classifier to identify their specific land-use types accurately. Generally, two types of information are usually included for consolidating the classification models, i.e. intra-object features (e.g. spectral, texture, and gradient features) and inter-object features (e.g. connectivity, contiguity, and adjacent alignment) (Zhang et al., Citation2018).
In addition to statistical machine learning algorithms such as support vector machine (SVM), random forest (RF), and neural network (NN) that digest low-level features for urban land use classification through the regular training and prediction protocol, recent advances in deep learning based convolutional neural networks (CNNs) make it more promising and cost-effective to transform the raw images and low-level features to classes at a higher and slightly abstract level (LeCun, Bengio, & Hinton, Citation2015; Schmidhuber, Citation2015). These advances have greatly facilitated a wide range of applications, including image segmentation, object recognition, and land-use classification. For example, Zhang et al. (Citation2018) proposed an object-based CNN (OCNN) method for urban land use classification using VHR images. Unlike the pixel-based convolutional process, the OCNN used the segmented objects as its functional units. The CNN structures are designed to assign semantic labels by partitioning within-object and between-object variations. Considering the challenges in understanding high-level semantics and spatial information through traditional CNN models in feature extraction, Bao et al. (Citation2020) proposed the Deeper-Feature Convolutional Neural Network (DFCNN) to extract multi-dimensional and deeper features for classifying semantic labels. Although deep convolutional neural network (DCNN) techniques have achieved very impressive image classification performance, the potential of including multi-spectral remote sensing images rather than the true-color three channels is limitedly explored. Moreover, the traditional practice of DCNN methods uniformly crop large images into small processing units, thus leading to obvious block effects in the spatial pattern of the derived land-use classification. Huang, Zhao, and Song (Citation2018) further proposed a semi-transfer deep convolutional neural network (STDCNN) approach including three steps of a transfer DCNN model, a small DCNN model with multispectral image layers, and a fully connected layer that fuses the first two parts, which makes it feasible to derive accurate object-based urban land use classification as well as maintaining the integrity of land-use patterns.
The hierarchy of urban scenes represents the urban landscape as “land-use parcel”, “land-use objects”, and “land-cover pixels” (). Intuitively, land-use parcels are comprised of land-use objects, and land-use objects are grouped by land-cover pixels. The object-based approaches, but the segmented unit will be largely influenced by the spatial scale effect (Myint, Gober, Brazel, Grossman-Clarke, & Weng, Citation2011), in particular, driven by global models. This raised issue may hinder the consistency of intrinsic unit size across different landscape heterogeneities (Chen et al., Citation2021b). Moreover, the segmented unit is more spatially oriented, which cannot be flexibly applied in real-world practices of urban land use planning and management considering the potential “application gap” (Zhong et al., Citation2020). Addressing this shortcoming, recent studies proposed to use a more synthetic scale of parcels to classify urban land-use types. For example, a street block representing a relatively homogeneous urban function is more compatible with the basic unit for urban planning and land management (Hu, Yang, Li, & Gong, Citation2016; Liu & Long, Citation2016). The parcel-based approaches have been increasingly developed and applied in multi-scale urban land use classification (Blaschke, Hay, Weng, & Resch, Citation2011). In addition to remote sensing observations, social sensing big data recorded or collected in a crowdsourcing way has provided us new opportunities to quantify human activities and characterize urban structures (Chen et al., Citation2018; Hu et al., Citation2016). For example, Point of Interests (POIs) extracted from social media check-in records can represent places or locations with certain functions (Chen, Song, Huang, & Xu, Citation2020). People usually go to different POIs for different purposes, e.g. dining, shopping, working, and entertaining (Chen et al., Citation2020). Based on Point of Interests (POIs) statistics allocated within street blocks, Liu and Long (Citation2016) estimated the parcel-based land uses for 297 cities in China. However, the quality and quantity of POIs will be certainly biased across different locations. Several follow-up studies further explored more features from medium-resolution remote sensing imagery, POIs, and other auxiliary geospatial information in parcel-based land use classification at city levels and reported much better classification performance (Su et al., Citation2020; Yao et al., Citation2017b). Zhong et al. (Citation2020) proposed a data-driven point, line, and polygon semantic object mapping framework to integrate POIs, OpenStreetMap (OSM) data, and VHR Google Earth imagery for parcel-based urban land use classification in four cities in China. However, the high-resolution spatial details from Google Earth imagery are always spatially mosaicked using temporally irregular VHR satellite observations, which prevents spatially and temporally consistency for classifying land use types (Chen et al., Citation2021b). Moreover, this work is leveraged at the stage of experimental tests in specific regions without extending to larger spatial scales. Noticeably, Gong et al. (Citation2020a) proposed a new concept of essential urban land use categories (EULUC) to define the urban land use classification scheme and reported a new map of EULUC for entire China (EULUC-China) in 2018 that uses 10-m Sentinel-2 imagery, nighttime lights, POIs, and Tencent location-based service (LBS) data. It marks the beginning of a new approach of collaborative urban land use mapping that can be replicable and transferable across multiple spatial scales. Due to the incomplete coverage of OSM road networks in China, the segmented land parcels with certain big sizes are typically mixed with different land uses. This situation will be particularly serious for less urbanized cities. Addressing this challenge, Su et al. (Citation2020) used the detailed road networks from a special road survey to generate land parcels, which represent the most accurate land parcel divisions. By further leveraging the complete set of survey-based land use samples in Shenzhen, they investigated the impact of training and validation samples on the accuracy in terms of different sizes and purities. Another promising approach is to integrate the object-based and parcel-based classifications, for example, Tu, Chen, Zhang, and Xu (Citation2020) proposed a segmentation-based framework to complement the road network derived land parcels and further improve the mapping results of EULUC at the city scale. On the other hand, the exploration of feeding multi-source datasets and multi-dimensional features into urban land use classification continues to be an open topic. For example, Zong et al. (Citation2020) integrated road network datasets of Gaode and OpenStreetMap (OSM) to divide urban parcels and integrated Sentinel-2A images, Sentinel-1A polarization data, night light data, point of interest (POI) data, and other data to derive final land use classifications. Huang, Yang, Li, and Wen (Citation2021) fused the multi-view optical imagery and high-resolution nighttime light imagery to derive urban land use function for two megacities of Wuhan and Beijing in China.
The structure of this review is organized as below. We first summarize the evolution of EULUC mappings in Introduction. We review the advances of EULUC mapping research and practices regarding their data, methods, and applications in Section 2. Based on the historical retrospect, we conclude the challenges and limitations of current EULUC studies in Section 3. Finally, we discuss future opportunities to better facilitate multi-scale EULUC mapping in Section 4.
2. An overview of data, methods, and applications
New and improved data and methods have been continuously involved in urban land use classification, which witnessed an accelerated pace of innovations and practices in this field due to the rapid development of remote sensing and artificial intelligence over the recent decades. Here we dive in from three primary perspectives to provide an overview of data, methods, and applications that have been progressively contributed to the knowledge of urban land use classification.
2.1. Remote sensing observations
2.1.1. Multispectral remote sensing
Multispectral remote sensing provides image information in the spectral domain as well as in the spatial domain. Ideally, different land cover objects and land use parcels represent distinct spectral responses recorded from the multispectral remote sensing observations. This is the fundamental assumption that we take advantage of the individual spectral band and the combination of spectral bands to separate different land-use types. Many remote sensing indicators have been devised to enhance thematic LULC features by diagnosing and analyzing spectral profiles. For example, we now have representative remote sensing indicators of (i) vegetation: Normalized Difference Vegetation Index (NDVI) (Tucker, Citation1979), Enhanced Vegetation Index (EVI) (Huete et al., Citation2002), etc.; (ii) soil: Normalized Difference Soil Index (NDSI) (Rogers & Kearney, Citation2004), Ratio Normalized Difference Built-up Index (RNDBI) (Deng, Wu, Li, & Chen, Citation2015), etc.; (iii) water: Normalized Difference Water Index (NDWI) (Gao, Citation1996; Xu, Citation2006), and (iv) built-up area: Normalized Difference Built-up Index (NDBI) (Zha, Gao, & Ni, Citation2003), Index-based Built-up Index (IBI) (Xu, Citation2008), Normalized Urban Areas Composite Index (NUACI) (Liu et al., Citation2018), etc. However, the spatial details vary a lot across different multispectral remote sensing images. The coarse spatial resolution images with large pixel sizes (e.g. MODIS with 250–1000 m and VIIRS with 500 m) are bound to have multiple land cover categories within a single pixel, especially for urbanized areas. The mixed land use problems can be eliminated dramatically at the scale of medium spatial resolution remote sensing images such as Landsat with 30 m and Sentinel-2 with 10–60 m. However, the capabilities for extracting the geometry, texture and adjacent information within and between objects are still limited. In contrast, HR and VHR images such as SPOT, IKONOS, Quick Bird, and Worldview definitely provide more detailed spatial information of the land surface, making it feasible to quantify distinct spatial/spectral/geometric characteristics for different land use types. However, their high expanses barricade the data accessibility for large-scale applications (Chen, Huang, & Xu, Citation2017b).
2.1.2. Hyperspectral remote sensing
Hyperspectral imaging has continuous narrow wavelength bands (around 10 nm per band). It is able to capture much more variations of spectral signatures than the multispectral ones (about 100 nm per band) (Xu & Gong, Citation2008). It has been demonstrated that the advantage of spectral sensitivity can improve the accuracy in discriminating similar land-use types (Zhang & Ma, Citation2009). For example, EO-1 Hyperion hyperspectral images were used for LULC mapping (Xu & Gong, Citation2007). The Chinese HJ Hyperspectral Imager (HSI) with 110 bands at 100 m was fused with 30-m multispectral images to derive detailed wetland species mapping (Chen, Chen, Lu, & Xu, Citation2017a). However, the spatial coverage of such data is limited for large-scale applications.
2.1.3. Multi-angular remote sensing
Multi-angular imaging is designed to provide remote sensing observations from different views. Previous studies have suggested bidirectional reflectance distribution function (BRDF) information can be used to complement spectral signatures to improve land cover classification accuracy (De Colstoun & Walthall, Citation2006). Following this direction, Huang, Zhang, and Yu (Citation2012) proposed to fuse multi-angle observation from Multi-angle Imaging SpectroRadiometer (MISR) data with Landsat observations to improve urban land cover mapping. Chen et al. (Citation2017b) blended the Landsat data and the retrieved multi-angular MODIS observations from the RossThick-LiSparse-Reciprocal (RTLSR) kernel-driven BRDF model (Lucht, Schaaf, & Strahler, Citation2000) to consolidate urban land cover classification in Beijing. However, these multi-view observations are still limited by their spatial resolution less than or equivalent to 30 m, which makes it challenging to quantify urban structures at fine scales, especially for those dense and high-rise cities. The Chinese launched Ziyuan3-01 (ZY3-01) satellite can simultaneously acquire multi-view images in nadir, forward, and backward modes, but its spatial resolution is much higher at 2.1 m. Recently, Huang et al. (Citation2021) integrated the multispectral and multi-view ZY3-01 images to capture urban vertical information, which can be helpful and cost-effective in urban land use classification.
2.1.4. Nighttime light remote sensing
As a measure of the lighting brightness observed at night from space, remote sensing based nighttime light (NTL) observations have emerged to be a unique measure of human activities and socio-economic attributes at different spatial and temporal scales (Elvidge, Baugh, Kihn, Kroehl, & Davis, Citation1997; Li & Zhou, Citation2017). For example, the long-term NTL products (1992–2013) from the Defense Meteorological Satellite Program’s Operational Line-scan System (DMSP/OLS) have triggered a wide range of applications such as urbanization (Ma, Zhou, Pei, Haynie, & Fan, Citation2012; Song, Chen, & Kwan, Citation2020), socioeconomic development (Xie & Weng, Citation2016; Yu et al., Citation2015), LULC classification (Cao et al., Citation2009; Zhang & Seto, Citation2011), and evaluation of light pollution (Chalkias, Petrakis, Psiloglou, & Lianou, Citation2006) and conflict crisis (Li & Li, Citation2014). The Visible Infrared Imaging Radiometer Suite (VIIRS) instrument onboard the Suomi National Polar Partnership (NPP) satellite launched in 2011 was equipped with a Day/Night Band (DNB) to provide high-quality night observations (Elvidge, Baugh, Zhizhin, Hsu, & Ghosh, Citation2017). Launched on June 2, 2018, by China, Luojia-1 has delivered dramatic improvements over the above two predecessors, in terms of increased spatial resolution (~130 m), high radiometric quantization (14 bits) with a swath of 250 km (Li, Zhao, Li, & Xu, Citation2018). Some recent studies have taken advantage of the finer-resolution nighttime information from Luojia-1 to map urban land use classification in China (Gong et al., Citation2020a; Tu et al., Citation2020). However, these existing nighttime light observations are still at relatively coarse and medium spatial resolutions from 130 m to 1000 m, preventing characterizing between- and within-object features in urban areas. Given the advantage of nighttime light observations in characterizing human activities and socioeconomics, some recent satellite initiatives and missions have delved into the exploration of fine-scale nighttime light sensors. For example, the Jilin1-07 satellite can provide high-resolution nighttime light images at 0.92 m (Huang et al., Citation2021). All these efforts will potentially contribute to better measures and approaches for depicting fine-scale urban structures and functions.
2.1.5. Microwave remote sensing
Although less often applied than optical remote sensing, microwave-based imaging has already become popular in characterizing urban structures and features, particularly for the emerging concept of multi-dimensional urban studies (Gamba, Aldrighi, & Stasolla, Citation2010; Li, Zhou, Gong, Seto, & Clinton, Citation2020b; Pelizari et al., Citation2018). Over the past few decades, we have witnessed a growing number of HR and VHR synthetic aperture radar (SAR) sensors, including Envisat ASAR, ALOS PALSAR, RADASAT-1, TerraSAR-X, Cosmo/Skymed, and Sentinel-1. Additionally, the superiority of microwave-based remote sensing in penetrating cloud cover, eliminating weather condition impacts, and capturing texture and height information has further accelerated its broader application in urban studies (Chen et al., Citation2020). For example, the height information of building structure is one of the important explanatory variables accounting for different land-use types. It has been included as a feature in the EULUC classification (Chen et al., Citation2021b; Tu et al., Citation2020).
2.1.6. Lidar remote sensing
As an emerging new type of active remote sensing, Light detection and ranging (Lidar) is a method for determining variable distance by targeting an object with a laser and measuring the time for the reflected light back to the receiver (Liu, Citation2008). Unlike optical data, Lidar data has the natural advantage of capturing high-accuracy structural information that can be used to differentiate land-use types with other structures, components, and compositions. For example, Antonarakis, Richards, and Brasington (Citation2008) used airborne Lidar data to map land-cover classification based on object-based classification methods. Zhou (Citation2013) investigated the integrated use of Lidar height and intensity data for urban land-cover classification and found that Lidar-derived parameters such as height, height variation, intensity, height texture, and skewness or kurtosis can be beneficial in land-use classification. However, the application of Lidar data for land-use classification is limited by spatial coverage, data availability and observational costs, which makes it very difficult to extend to large-scale applications with fine-resolution Lidar footprints. Additionally, updating temporal frequency will be another concern because of the limited availability of airborne Lidar data collected by commercial companies and government agencies.
2.1.7. Emerging new types of remote sensing datasets
The rapidly evolving CubeSat society has opened a new era for Earth observations (Poghosyan & Golkar, Citation2017; Puig-Suari, Turner, & Ahlgren, Citation2001). For example, as one of the most representative companies, Planet has launched a series of satellites, including RapidEye, PlanetScope, and Skysat (Cooley, Smith, Stepan, & Mascaro, Citation2017), with the aims to realize the spatial, temporal, and spectral observations with simultaneous fine resolutions through this ambitious satellite network. Street-view imagery from Google, Baidu, and Tencent provides street-level or eye-level observations along the road networks, which has been widely used to serve as the ground reference of urban land uses or the on-site lens to quantify the urban environment (Cao et al., Citation2018; Yu, Zhao, Chang, Yuan, & Heng, Citation2019; Zhang et al., Citation2017a). Unmanned aerial vehicle (UAV) sensors and platforms nowadays have been extensively used in urban studies to deliver high-resolution remote sensing observations (Akar, Citation2018; Al-Najjar et al., Citation2019; Li, Levin, Xie, & Li, Citation2020a; Zhang, Chen, Wang, Wang, & Dai, Citation2017b).
2.2. Social sensing big data
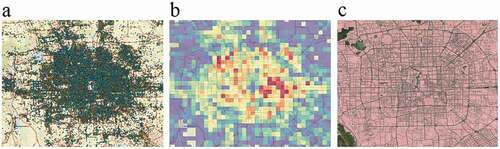
Although remote sensing observations from multiple types, platforms, and scales have greatly supported the mapping, monitoring, and modeling of the dynamic urbanization and land-use changes, existing remote sensing based approaches have one major shortcoming that they mainly study the physical (e.g. spectrum, texture, geometry, and land surface temperature) and indirect anthropogenic (e.g. nighttime light) difference between different land-use classes (Chen et al., Citation2020). The emerging social sensing big data have provided novel insights, datasets, and approaches to quantify spatiotemporal patterns of human activities and uncover thematic information in urban contexts ().
Figure 2. Examples of social sensing big data in Beijing, China. (a) Point of Interests (POIs) for Weibo check-in records; (b) Tencent mobile-phone location-based service (LBS) active population density; and (c) OpenStreetMap based road networks
2.2.1. Social media data
Social media is a set of Internet-based applications grounded by the idea of Web 2.0 to empower contents and applications that can be continuously modified and altered by users in participative and collaborative ways (Gilbert & Karahalios, Citation2009; Kaplan & Haenlein, Citation2010). The development of Mobile Internet technologies further connects human beings through social networks in very diverse aspects. As a result, we now witnessed many geotagged information from Twitter, Facebook, Instagram, LinkedIn, Flickers, WeChat, Weibo, etc. For example, Twitter is one of the most popular social media platforms globally, which allows users to post messages and record real-time positions. In this way, geotagged Tweets’ spatial and temporal features are considered a good measure of dynamic human movements. Several previous studies have analyzed the changes in the number of Tweets sent from different geographic locations to characterize urban land uses (Abbasi, Rashidi, Maghrebi, & Waller, Citation2015; Frias-Martinez & Frias-Martinez, Citation2014; Wakamiya, Lee, & Sumiya, Citation2011).
2.2.2. Mobile device data
Mobile devices such as mobile phones carried by persons can record the relative locations of their daily movements to the access points (e.g. cellular towers or WiFi access points). Based on the locations of those access points and their accessible radius, we can infer the spatiotemporal trajectories of human mobility. For example, Pei et al. (Citation2014) constructed a synthesized vector of mobile phone activity to identify land-use types using mobile phone data and a semi-supervised clustering method. Louail et al. (Citation2014) used the recorded phone data to define an urban dilatation index for measuring spatial structure in 31 Spanish cities. Instead of logging the relative locations to access points, individual human mobility can be recorded by GPS mobile devices. This is usually the best dataset to quantify human mobility with the highest spatial and temporal accuracies. For example, the pick-up/set-down dynamics from taxi GPS traces were used to recognize the function of urban land uses (Liu, Wang, Xiao, & Gao, Citation2012; Pan, Qi, Wu, Zhang, & Li, Citation2012). However, given the concern about privacy and cost issues, the collection of GPS-based trajectory dataset is always limited to local regions and short-term sampling periods.
2.2.3. Volunteered geographic information
Volunteered geographic information (VGI) is an emerging phenomenon and trend of crowdsourcing in which members of the general public create, collect, and contribute georeferenced facts about the Earth’s surface and near-surface to synthesized databases (Goodchild, Citation2007; Goodchild & Li, Citation2012). For example, initiated in 2004 as a volunteer effort, OpenStreetMap (OSM) has become the best-known and most successful VGI database with substantial global spatial information that maps various points, lines, and polygon features (www.openstreetmap.org). The rich geographic information from OSM has been widely employed to classify land-use types and uncover urban land-use patterns (Gong et al., Citation2020a; Hagenauer & Helbich, Citation2012; Hu et al., Citation2016; Tu et al., Citation2020; Zhong et al., Citation2020; Zong et al., Citation2020).
2.2.4. Auxiliary data sources
In addition to the remote sensing and social sensing data sources, many auxiliary datasets have also been used in EULUC mappings. For example, census data that includes demography, education, employment, income, and housing can reveal the spatial difference of socioeconomic status across different land use types (Theobald, Citation2014). Topographic features such as elevation, slope and aspect can be used in urban land use classification (Chen et al., Citation2017b). Given the advantage of more complete population coverage and longer temporal spans, municipal data such as water consumption data has been used to identify the socioeconomic functions of urban lands (Pan et al., Citation2020) and analyze mixed patterns of land use (Guan, Cheng, Pan, Yao, & Zeng, Citation2021), because the land use types and composition can be estimated by the classification of spatiotemporal patterns in water consumption from individual end-users (Guan et al., Citation2021).
2.3. Methods
Although many advances have been made in data and method development for urban land use classification, fine-resolution and accurate EULUC mapping remain a challenge, given that many factors such as landscape heterogeneity, data processing, classification algorithms, mixed land use, and post-classification process may affect the success of a complete classification (Chen et al., Citation2017b; Gong et al., Citation2013). Therefore, the design of classification strategy is critically important to the performance of classification outcomes. Generally, the classification strategies can be divided into supervised, unsupervised, and hybrid classifications. The classification may seek to group land use types by their relative spectral similarity (unsupervised) or allocate land-use types based on their similarity to a set of predefined classes that have been characterized spectrally (supervised) (Foody, Citation2002). Nevertheless, the hybrid classification aims to combine the advantages of both supervised and unsupervised ones, which has been demonstrated that it can produce more accurate classification than that from the supervised and unsupervised classification alone (Lo & Choi, Citation2004; Malinverni et al., Citation2011). Moreover, the integration of multi-source data features and multi-function models has been another mainstream in promoting classification strategies for better classification performance (Gong et al., Citation2020a, Citation2019).
The basic unit of land use classification is the fundamental attribute for land use classification maps and products, which determines the finest spatial scale that end users can dive into (Chen et al., Citation2021b). Based on the minimum size of spatial representation, the classification unit can be generally categorized into three levels of pixel, object, and parcel. Therefore, the choice of classification unit should be determined after designating the classification strategy. Research progress on the division of different unit-based EULUC classification has been described in the Introduction. Here we mainly summarized the progress of classification algorithms that have evolved over the past few decades in machine learning, natural language processing (NPL), and deep learning based approaches.
With the development of data and method in the field of land use science, we have witnessed many classification efforts and practices at different scales using machine learning algorithms, including Maximum likelihood (ML) (Gong et al., Citation1992; Man, Dong, & Guo, Citation2015b; Özkan & Sunar Erbek, Citation2005; Paola & Schowengerdt, Citation1995), K-means (Chen et al., Citation2017d; Wang et al., Citation2016), Neural Network (NN) (Pacifici, Chini, & Emery, Citation2009; Paola & Schowengerdt, Citation1995), Support Vector Machine (SVM) (Man et al., Citation2015b), Decision Tree (DT) (Hu & Wang, Citation2013), Random Forest (RF) (Gong et al., Citation2020a; Grippa et al., Citation2018; Ruiz Hernandez & Shi, Citation2018; Sun et al., Citation2020; Zhang et al., Citation2017c, Citation2017a), etc. Among these algorithms, RF that consists of a large ensemble of regression trees has proven its efficiency and robustness in computational cost and model performance when processing high dimensional data, which has been extensively used.
Similar to the concept of understanding the contents of natural language data, NLP-based approaches have been increasingly used to fuse the geospatial latent semantic information extracted from remote sensing observations and multisource social sensing information as patterns for urban land use classification. For example, the Google Word2Vec model (Mikolov, Sutskever, Chen, Corrado, & Dean, Citation2013) was adopted to measure the contextual relationships between POIs and urban land-use types (Yao et al., Citation2017a). Some of the Word2Vec-based extension models, such as Traj2Vec (Zhang et al., Citation2021) and Place2Vec (Zhai et al., Citation2019) were subsequently developed to better retrieve the potential semantic information of locations and trajectories to characterize urban land-use types. A variety of probabilistic topic models in the NLP field such as latent Dirichlet allocation (LDA), latent semantic analysis (LSA), probabilistic latent semantic analysis (pLSA), and term frequency–inverse document frequency (TF-IDF) have been used for different semantic analysis of urban land use classification (Liu et al., Citation2017a; Yan, Schultz, & Zipf, Citation2019; Yao et al., Citation2017a; Yuan, Zheng, & Xie, Citation2012; Zhang et al., Citation2021).
With the growing popularity of CNN models, deep learning based approaches have also rapidly developed in the field of EULUC classification because of their capability of transforming the raw input imagery and low-level features to classes at a higher and abstract level. For example, the conventional CNN models have been employed to derive multi-intention land use classification maps at different spatial scales (Cao et al., Citation2018; Liu, Qi, Li, & Yeh, Citation2019; Liu & Shi, Citation2020; Srivastava, Vargas-Munoz, & Tuia, Citation2019). To better integrate spatial and temporal features from adjacent contexts, some deeper CNN models have been proposed to refine EULUC classification (Bao et al., Citation2020; Feng, Zhu, Yang, & Li, Citation2019; Huang et al., Citation2018). Additionally, social sensing data and methods have also been integrated with deep learning approaches to derive more accurate EULUC classification (Du, Du, Liu, Zhang, & Zheng, Citation2020; Jia et al., Citation2018; Zhong et al., Citation2020).
2.4. Applications and implications
Built environment factors have become a significant focus on the field of physical activity and public health, which typically consists of urban design (arrangement of physical elements within a city), land use patterns (the distribution and composition of land functions across space), and transportation system infrastructure (roads, railway, sidewalks, etc.) (Handy, Boarnet, Ewing, & Killingsworth, Citation2002). Therefore, land-use maps outlining the distribution, pattern, and composition of essential urban land use categories (EULUC) have triggered a wide spectrum of applications and implications in the field of urban environmental health science.
2.4.1. Urban planning and land management
The fundamental data required by urban planners and policy makers is accurate information on current land use, how it has changed over the past, and how it will change in the future for practicing various urban planning and land management activities (Malarvizhi, Kumar, & Porchelvan, Citation2016). For example, over the past decades, the land use data collected from survey-based approaches have been the primary baseline for urban planners and researchers in preparation for the master plan, landscape, and functional design from a community to a town, a city, and the city cluster (Liu, Zhang, Zhang, & Borthwick, Citation2014; Malarvizhi et al., Citation2016). In recent decades, remote sensing data availability, especially for the VHR satellite imagery, has facilitated the spatiotemporal mapping and monitoring of urban land-use changes from local to regional scales (Sakieh et al., Citation2015; Treitz & Rogan, Citation2004).
2.4.2. Urban environment
The distribution of different land-use categories has been closely related to a variety of environmental problems such as air pollution, water pollution, noise pollution, heat island, and greenspace inequity. Therefore, EULUC maps and the derived land-use variables have been widely used in urban environmental studies. For example, the urban LULC changes and urban thermal landscape were integrated to account for the spatial pattern of local air pollution (Weng & Yang, Citation2006). Due to the high correlation between land use pattern and air pollution (Hoek et al., Citation2008), a group of land-use regression models has been developed to estimate spatial pattern and temporal variability of nitrogen dioxide concentrations (Beelen et al., Citation2013; Henderson, Beckerman, Jerrett, & Brauer, Citation2007) and fine particulate matter concentrations (Eeftens et al., Citation2012; Shi, Ren, Lau, & Ng, Citation2019). In addition to the choice of different regression models with linear and nonlinear forms, the quality of land-use baseline maps plays a critical role in modulating the performance of the air pollution retrieval. In a similar context, the influence of urban land use on land surface temperature and urban heat islands has been widely investigated (Dugord, Lauf, Schuster, & Kleinschmit, Citation2014; Heusinkveld, Steeneveld, Van Hove, Jacobs, & Holtslag, Citation2014; Jusuf, Wong, Hagen, Anggoro, & Hong, Citation2007; Stone & Norman, Citation2006). As for water pollution, it is recognized that strong ties exist between land uses and the water quality characteristics of adjacent aquatic systems in terms of spatial configuration (Bu, Meng, Zhang, & Wan, Citation2014; Lee, Hwang, Lee, Hwang, & Sung, Citation2009; Uriarte, Yackulic, Lim, & Arce-Nazario, Citation2011). Land use also significantly affects the distribution of urban green space regarding its configuration and composition (Chen, Nie, Chen, & Xu, Citation2017c; Li, Bai, Zhou, Han, & Han, Citation2015), thus leading to the spatial difference in greenspace exposure for urban citizens (Song et al., Citation2020; Song, Huang, Cai, & Chen, Citation2018).
2.4.3. Urban morphology change
The irregularity of land uses and land parcels that constitute the urban morphology (Batty & Longley, Citation1988) is mainly defined by the shape of land use and the density of different land uses filled in the spatial context (Mesev, Longley, Batty, & Xie, Citation1995). Due to the LULC changes, urban morphology is continuously evolving at micro- and macro-scales. Schneider and Woodcock (Citation2008) used remote sensing data, pattern metrics, and census information to compare the urban growth in 25 global cities. In terms of their evolutionary morphologies, they aimed to categorize the urbanization process into compact, dispersed, fragmented, and extensive modes. Liu et al. (Citation2010) proposed a landscape expansion index to generalize the spatio-temporal dynamics of landscape patterns. By applying this proposed index in measuring morphological changes of urban expansion, the urban growth types can be categorized into three major groups of infilling, edge-expansion, and outlying (Liu et al., Citation2010; Tu et al., Citation2021). As the outcome of urban development, urban morphology changes have been closely associated with demographic structures (van de Coevering & Schwanen, Citation2006), transportation modes (Zhou & Gao, Citation2020), building energy consumption (Wong et al., Citation2011), urban air quality (Yuan, Ng, & Norford, Citation2014), and heat environment (Zhou and Chen 2018).
2.4.4. Urbanization process from observation and simulation
Time-series LULC observations have greatly supported the historical reconstruction and future prediction of the urbanization process. Numerous maps and products that document spatially and temporally explicit information of LULC changes have advanced our understanding of the process of urbanization and their impacts on the environment and ecology from local to regional and global scales. For example, by quantifying the annual urban land-use changes, Seto and Fragkias (Citation2005) used the derived spatiotemporal landscape metrics to infer underlying social, economic, and political processes that drive the observed urbanization difference. Gong et al. (Citation2020b) mapped the annual artificial impervious area dynamics at a 30-m resolution from 1985 to 2018 using the full Landsat archive. The derived results revealed a considerable urbanization process at the global scale over the past three decades. Specifically, Asia has the most significant growth. China and the US are the top two nations of total artificial impervious areas accounting for around 50% of the global total in 2018 (Gong et al., Citation2020b). From the perspective of simulations, a wide range of urban simulation models has been developed to predict urban land-use changes driven by natural and socioeconomic factors. Given the difference of simulation targets in socioeconomic activities, the spatial configuration of urban land uses, or modeling units/scales, these models can be categorized into three classes of the land use/transportation (LUT) model, the cellular automata (CA) model, and the agent-based (AB) model (Li & Gong, Citation2016). Specifically, the LUT models are focused on mimicking socio-economic activities by considering relatively complex relationships among variables and sectors (Li & Gong, Citation2016). The CA models are more focused on simulating specific land-use types in spatial allocation, which have been regarded as very useful tools to analyze the causes and effects of the urbanization process and have been extensively modified for addressing different urban simulation issues, for example, the constrained CA model (Li & Yeh, Citation2000; White, Uljee, & Engelen, Citation2012), logistic CA model (Wu, Citation2002), SLEUTH model (Silva & Clarke, Citation2002), LUSD model (He et al., Citation2005), and FLUS model (Liu et al., Citation2017b). The AB models, treated as an intermediary between these two objectives, have been extensively investigated and utilized due to their capability of modeling behaviors and processes through individual agents (Groeneveld et al., Citation2017; Matthews, Gilbert, Roach, Polhill, & Gotts, Citation2007; Parker, Manson, Janssen, Hoffmann, & Deadman, Citation2003). There are also a set of AB model systems such as Swarm, MASON, Repast, StarLogo, NetLogo, OBEUS, AgentSheets, and AnyLogic for geospatial simulations (Castle & Crooks, Citation2006). Although most of the existing studies from remote sensing analysis treat urban land uses as the combination of major types, including built-up land, cropland, vegetated land, and water body (Du & Huang, Citation2017; Guan et al., Citation2011; Schneider & Woodcock, Citation2008; Seto & Fragkias, Citation2005), EULUC changes within the built-up land that depict the micro-scale dynamics of urban land functions have aroused growing attention in urban science community (Banzhaf et al., Citation2017; Wang, Lin, Glendinning, & Xu, Citation2018; Yao et al., Citation2017b).
2.4.5. Human behaviors and public health
The distribution of urban land use types impacts human activities. A growing literature investigates the potential for causal links between land use patterns and travel behavior (Boarnet & Crane, Citation2001). For example, results revealed that the pattern of mixed land use had significant associations with the frequency of walking for transportation, and the area-correlated mixed land use was significantly related to the duration of walking for transportation (Duncan et al., Citation2010). A comparative study between Boston and Hong Kong further confirmed the role of land use in influencing travel behaviors, which was independent from travel time and monetary costs (Zhang, Citation2004). They revealed that land use strategies influenced travel more effectively when complemented by pricing policies (Zhang, Citation2004). Urbanization in the form of dramatic land-use changes and conversions has also led to a major public health challenge with the growing disease burden in urban areas (Gong et al., Citation2012), for example, asthma (Son, Kim, & Bell, Citation2015), infectious disease (Patz et al., Citation2004), obesity (Jia et al., Citation2021). As a proxy of urban physical contexts, EULUC maps provide multi-scale baseline maps for linking physical activity, urban environment and human behaviors, thus providing opportunities for informing environment and policy initiatives to promote healthy and sustainable urban development.
3. Challenges and limitations of existing EULUC studies
3.1. Sample collection
Training data are critical components to urban land use classification because different classifiers and machine learning algorithms highly depend on the input reference with varying qualities and quantities. Generally, the increase in the number and variability of training samples leads to robust urban land use classification (Gong et al., Citation2019; Su et al., Citation2020). However, sample collection is the most time-consuming step. Existing samples are mainly derived from the following approaches: (i) manual or semi-manual inspection, for example, on-site survey, or visual inspections of VHR Google Earth imagery, Google Street Views, Google POIs, and 3-D modeled imagery; (ii) open data portal with LULC labels, for example, OSM has included polygon-based land use labels; and (iii) land use reference from government agencies. Two major weaknesses are noticeable. First, the crowdsourcing protocol of interpreting land use labels is still labor-intensive. The number of samples collected highly depends on coordinated efforts from both participatory popularity and financial input. Moreover, the quality of samples collected cannot be systematically controlled due to the inconsistent sampling criteria caused by the subjectivity of sample collectors among different places. Second, the temporal consistency of available georeferenced samples is another concern. For example, the Google Earth imagery at regional scales is always spatially mosaicked using temporally irregular VHR satellite observations, preventing spatially and temporally consistent information for interpreting land-use types. The crowdsourcing effort such as OSM will be an integration of sample collections spanning different years. Although the land use references from government agencies can be regarded as the most accurate ground truth for selecting samples, they are always limited by the updating frequency without revealing the temporal dynamics.
3.2. Mixed land-use problem
The mixed land use has been a big challenge in mapping EULUC, especially for highly dense urbanized contexts. Mixed land uses describe urban aggregation and development that integrate multiple functional uses, including residential, commercial, educational, medical, recreational, or even industrial land use, in a small neighborhood area (e.g. land parcel) or in high-rise buildings. Consequently, mixed land uses attract a diversity of user groups throughout different times of the day (Zahnow, Citation2018). However, the differentiation from these mixed land uses will be quite difficult if the spatial resolution of input data sources and features is not equivalent to or much coarser than the targeted objects. Conventional approaches tend to adopt the protocol of “dominant land use” rather than “proportional land uses”, eliminating a lot of useful information to describe the micro-structure of land use composition. Recent studies from two major directions have been working on addressing this shortcoming. First, the fine-resolution land parcel generation with detailed road networks and multi-scale image segmentation. With the increase in road network density, the derived land parcels have much higher purity in land uses (Su et al., Citation2020; Sun et al., Citation2020). For areas with highly mixed land uses, the objects derived from image segmentations and the parcels derived from road network divisions are complemented to refine urban land use classification (Tu et al., Citation2020). Second, the emerging new datasets such as traffic data, mobile phone data, social media data, and municipal data (e.g. water and electrical consumption data) provide new insights for estimating mixed urban land use patterns. For example, Liu and Long (Citation2016) computed the degree of mixed land use based on the proportional POI types within each land parcel. Dovey and Pafka (Citation2017) proposed a live/work/visit triangle framework focusing on the interconnections between land use functions to measure land-use mix. Considering the biased spatiotemporal coverage of social sensing data, Guan et al. (Citation2021) proposed to identify individual socioeconomic functions by the water consumption patterns of municipal services and measure the mixed land-use patterns using the information entropy index. However, the data availability of municipal services will barricade large-scale implementations and practices of this type of approach. Additionally, the vertical mixed land uses continue to be a challenge because of the limited approaches to partition different land-use types within building groups.
3.3. Generalization of data and models
The capability of data and model generalization across different spatial and temporal scales will be of great significance to multi-scale EULUC mappings. However, systematic testing of samples, features, and models on classification performance across different spatial and temporal contexts is limited. Knowledge about the impact of sample size, feature combinations, and model selection on classification performance is required to better support the practical implementation of multi-scale EULUC mapping (Gong et al., Citation2020a). Additionally, the transferability of data and models is another major concern. For example, the data availability, especially for some social sensing big data, will be largely different across countries, which prevents the flexible function of the mapping framework from one place to another. Although medium-resolution satellite imagery such as Landsat and Sentinel-2 are globally open access, some VHR remote sensing imagery is limited to specific regions and countries. For example, the National Agriculture Imagery Program (NAIP) imagery at a spatial resolution of 1 to 2 m can provide much higher spatial details for improving the EULUC classification performance (Chen et al., Citation2021b). Still, this dataset is only available in the United States. Similarly, different classification models have been employed in EULUC mapping practices, but their robustness to other feature inputs and the associated adaptation to different study areas remains uncertain.
3.4. Large-scale EULUC mapping
Given the advance of data and methods in the field of urban land use classification, existing EULUC research and practices are still limited to local to regional levels. To address pressing environmental challenges caused by urbanization, it is important to have urban land uses at the national and global scales that are derived from the same or consistent data sources with the same or compatible classification systems and mapping methods (Gong et al., Citation2020a). This is because only with urban land use maps produced with similar criteria, consistent environmental policies can be made, and action efforts can be compared and assessed for large-scale environmental contexts (Gong et al., Citation2020a). However, more detailed urban land use maps do not exist at the scope of global coverage.
4. Discussion and future opportunities
To improve the current EULUC mapping results and advance further research, we proposed that future efforts could be devoted to the following seven aspects.
4.1. Cross-scale mapping strategy
A cross-scale mapping strategy that can be compatible across pixel-, object-, and parcel-scale is highly demanded. It can well solve the mixed land use problem because of (i) the logic reliability of scaling representation of urban land surface from pixels to objects and parcels; and (ii) the diverse outputs of urban land use classification maps that can generate the combination and proportion of mixed land uses, as well as the ratio of mixed land uses and dominant land use. Additionally, the cross-scale mapping strategy will remove potential obstacles for multi-disciplinary practical applications. For example, land use modelers may be interested in using pixel-based land use classification maps; urban planners and landscape architects may prefer parcel-based land use classification maps; and urban climate modelers may prefer object-based classification maps that can be accurately aggregated to flexible units of different land-use combinations.
4.2. Optimal integration of multi-source features
An increasing number of different data sources have been successfully used in urban land use classification. However, the higher volume of input data does not ensure better classification performance (Chen et al., Citation2017b, Citation2021b). Although a large group of explanatory variables is not necessarily an obstacle to the reliable function of machine learning based classifiers, the presence of highly correlated variables may nonetheless hinder model interpretations (Chen et al., Citation2021a). Recent land cover classification studies also revealed that the feature redundancy might even degrade the classification performance (Chen et al., Citation2017b). Moreover, the contribution of different data features to the classification performance is not the universe, which will have distinct characteristics across different locations and different combinations of datasets. Therefore, the localized function of optimal features should be carefully tuned to achieve robust classification results. Additionally, information compression and feature transformation techniques such as principal component analysis (PCA) (Abdi and Williams, Citation2010) and maximum noise fraction (MNF) (Gao, Du, Zhang, Yang, & Wu, Citation2013) can be taken into consideration to better preserve useful information while reducing the computational costs. In the meantime, geometric registration is another issue when integrating multi-source geospatial data. Although the geometric mismatch does not impact much on block-level land use classification since all the inclusive features are aggregated into block-level statistics, the same issue will be challenging towards pixel-level urban land-use classification that geometric mismatch leads to be the main driver of misclassification over the adjacent areas. For this case, geometric registration and correction should be conducted before stacking inclusive features from different geospatial data layers.
4.3. Global sample library from crowdsourcing approaches
A global sample library that consists of different land-use types across different cities and countries will be highly needed for the research campaign of large-scale EULUC mapping. However, sample collection is time-consuming and labor-intensive. To promote a cost-effective global sample library, we call for future efforts devoted to the following aspects. First, the collection of samples can be facilitated in a crowdsourcing approach, including the VGI-based OSM land use labels, self-organized sampling campaigns of on-site survey and visual inspection, and available land-use references from government agencies and related institutions. Second, the temporal consistency of collected samples can be improved by inter-calibration and change detection techniques. As for samples collected in earlier years, LULC change detection algorithms such as continuous change detection and classification (CCDC) (Zhu & Woodcock, Citation2014), Landsat-based detection of trends in disturbance and recovery (LandTrendr) (Kennedy, Yang, & Cohen, Citation2010), and breaks for additive season and trend (BFAST) (Verbesselt, Hyndman, Newnham, & Culvenor, Citation2010) can be used to include those stable ones to the sample library in more recent years. Third, the structure of the sample library should be systematically designed by including hierarchical land use categories, harmonizing the spatial distribution and sample size across different locations (e.g. continents, countries, cities, and climate zones), and considering the similarity and heterogeneity within and between classes.
4.4. Advanced machine learning and ensembled classification
Traditional machine learning algorithms such as SVMs and RF have been widely and successfully applied in EULUC mapping at different scales. However, this sort of model using low-level features has been difficult to adapt to the emerging big data era with tons of data sources and features, especially for the cost-effective and intelligent mapping of large-scale EULUC dynamics. The unique deep hierarchical structure of recent deep learning algorithms has proven its powerful capability of learning and generalization using deep convolutional neural networks, which is suitable for big data processing and analysis (LeCun et al., Citation2015). Two major opportunities from deep learning technologies can be explored in the field of large-scale EULUC mapping. First, transfer learning that makes use of pre-trained neural networks has proven to be quite helpful and efficient to solve a different but related problem (Pan & Yang, Citation2009). This concept is quite suitable to large-scale EULUC mapping. Because of the similarity and difference in landscape characteristics and land use compositions across regions and countries, the training samples collected in local sites may or may not be appropriate for EULUC classification in different regions. Similarly, it will be unrealistic to apply a global model in universal EULUC mapping for different regions. The idea here is to build categorized groups in the sense of “similar cities” that share similar characteristics in landscape and land use patterns. Within each group of cities, we probably may apply local features and models in classifying nonlocal EULUC. Moreover, how to calibrate nonlocal similarity among different regions and develop spatially adjusted transferring models will be another open topic in this direction of the model and feature transferability from local to regional and global scales. Second, ensemble learning is a promising strategy that can bring together a group of algorithms and models. The ensembled strategy can reduce the variance of predictions and result in predictions that are better than any single model.
4.5. Open portal for data visualization and sharing
Efforts should be devoted to promoting data usages and sharing through open portals for visualization and download. We believe such a data portal can facilitate the distribution of multi-scale EULUC data by providing an easy-to-access, searchable hub for a variety of end-users from different fields and applications. First, the online open portal makes it possible for broader users to dive into any areas of their interests. On the one hand, it could facilitate multi-scale data usages based on the requirement of different spatial extents. On the other hand, users can in turn provide feedbacks on data quality assessment and other data attributes. Second, the entire procedure of EULUC mapping from raw datasets, training samples, high-level features, classification methods, and final mapping products can be integrated through the open data portal. It will facilitate the replication and extension of EULUC mapping practices and promote the interpretability of EULUC mapping results.
4.6. Historical reconstruction and future prediction of EULUC changes
Many studies have worked in the pipelines of historical reconstruction and future prediction of the urban sprawl process (Gao & O’Neill, Citation2020; Gong et al., Citation2020b). Yet, limited research has delved into the internal dynamic of urbanized regions in terms of land use changes at fine spatial and temporal resolutions. The knowledge about the historical process and future development of EULUC will be insightful and supportive to city managers and relevant stakeholders for strategic urban planning on healthy and sustainable development, especially for those rapidly urbanized areas where land use is changing dramatically. Therefore, we call for potential efforts to develop a relatively long-term annual urban land use classification dataset that is temporally consistent and spatially explicit, which will be of great importance to various applications in the field of urban environmental science.
4.7. Implications in urban environmental studies
Intuitively, the EULUC maps that outline the composition, distribution, and pattern of varying land-use types represent the “identify cards” for different cities. In addition to the widely used fields of urban planning, landscape architecture, land management, and biodiversity conservation, EULUC maps and the derived spatiotemporal information could be very useful in urban environmental studies such as air pollution, heat stress, noise pollution, and green/blue space protection; economic geography studies such as urban vibrancy, innovation ecosystem, and housing market; urban energy applications such as anthropogenic heat, carbon footprint, and energy supplies. Moreover, the multi-temporal mapping and monitoring of urban land-use changes and evolutions will significantly advance our understanding of the mechanism of urbanization in the evolutionary loop from emergence to development, transformation (growth or shrinkage), and stability. This knowledge can be leveraged in urban models for the historical reconstruction of the urbanization process and the future projection of urban development. Additionally, another consciousness that should be addressed is to promote the philosophy of “from users, and back to users” in the field of urban science between the research and application communities. Only if we get fully understood the demands from end-users, the knowledge exchange gaps could be closed progressively.
COI-statement statement
No potential conflict of interest was reported by the author(s).
Acknowledgments
This study was supported by the National Key Research and Development Program of the Ministry of Science and Technology of the People’s Republic of China (2016YFA0600104) and the Cyrus Tang Foundation to Tsinghua University. The authors would like to thank all members of the Essential Urban Land Use Categories (EULUC-China) Mapping Committee for collectively moving forward urban land use mapping.
Disclosure statement
No potential conflict of interest was reported by the author(s).
Additional information
Funding
Notes on contributors

Bin Chen
Bin Chen is an assistant professor in the Division of Landscape Architecture, Faculty of Architecture, at the University of Hong Kong. His research interests include most aspects of geoscience and remote sensing, specifically multi-source data-model fusion and geospatial big data analysis in the field of urban and environmental health science. He has published more than 40 journal articles, including Science, PNAS, Remote Sensing of Environment, ISPRS Journal of Photogrammetry and Remote Sensing, etc. He received the 2021 AAG Early Career Award in Remote Sensing, ISPRS Best Young Author Award, and Li Xiaowen Remote Sensing Excellent Youth Award.

Bing Xu
Bing Xu is a professor in the Department of Earth System Science at Tsinghua University. Her research interests include global environmental change monitoring and health, particularly the understanding of evolution and transmission mechanism of avian influenza at the molecular and cross-continental scales using phylogenetic analysis and spatio-temporal modeling tools. She is currently on the editorial board of Annals of GIS and ISPRS Journal of Photogrammetry and Remote Sensing.

Peng Gong
Peng Gong is a chair professor of global sustainability and Vice-President & Pro-Vice-Chancellor (Academic Development) of the University of Hong Kong. His research interests include urbanization and health, mapping and monitoring of global environmental change, and modelling of environmentally related infectious diseases. He led the creation of the world’s first 10-m resolution global land cover map. He is an advisor to Future Earth and a member of the Earth Commission.
References
- Abbasi, A., Rashidi, T. H., Maghrebi, M., & Waller, S. T. (2015). Utilising location based social media in travel survey methods: Bringing Twitter data into the play. In, Proceedings of the 8th ACM SIGSPATIAL international workshop on location-based social networks (pp. 1–9), Bellevue, WA, USA.
- Abdi, H., & Williams, L. J. (2010). Principal component analysis. Wiley Interdisciplinary Reviews. Computational Statistics, 2, 433–459.
- Akar, Ö. (2018). The Rotation Forest algorithm and object-based classification method for land use mapping through UAV images. Geocarto International, 33, 538–553.
- Al-Najjar, H. A., Kalantar, B., Pradhan, B., Saeidi, V., Halin, A. A., Ueda, N., & Mansor, S. (2019). Land cover classification from fused DSM and UAV images using convolutional neural networks. Remote Sensing, 11, 1461.
- Antonarakis, A., Richards, K. S., & Brasington, J. (2008). Object-based land cover classification using airborne LiDAR. Remote Sensing of Environment, 112, 2988–2998.
- Arino, O., Ramos Perez, J. J., Kalogirou, V., Bontemps, S., Defourny, P., & Van Bogaert, E. (2012). Global land cover map for 2009 (GlobCover 2009). European Space Agency (ESA) & Université Catholique de Louvain (UCL): Frascati, Italy.
- Banzhaf, E., Kabisch, S., Knapp, S., Rink, D., Wolff, M., & Kindler, A. (2017). Integrated research on land-use changes in the face of urban transformations–an analytic framework for further studies. Land Use Policy, 60, 403–407.
- Bao, H., Ming, D., Guo, Y., Zhang, K., Zhou, K., & Du, S. (2020). DFCNN-Based Semantic Recognition of Urban Functional Zones by Integrating Remote Sensing Data and POI Data. Remote Sensing, 12, 1088.
- Barnsley, M. J., & Barr, S. L. (1996). Inferring urban land use from satellite sensor images using kernel-based spatial reclassification. Photogrammetric Engineering and Remote Sensing, 62, 949–958.
- Bartholome, E., & Belward, A. S. (2005). GLC2000: A new approach to global land cover mapping from Earth observation data. International Journal of Remote Sensing, 26, 1959–1977.
- Batty, M., & Longley, P. (1988). The morphology of urban land use. Environment and Planning. B, Planning & Design, 15, 461–488.
- Beelen, R., Hoek, G., Vienneau, D., Eeftens, M., Dimakopoulou, K., Pedeli, X., … Marcon, A. (2013). Development of NO2 and NOx land use regression models for estimating air pollution exposure in 36 study areas in Europe–the ESCAPE project. Atmospheric Environment, 72, 10–23.
- Blaschke, T., Hay, G. J., Weng, Q., & Resch, B. (2011). Collective sensing: Integrating geospatial technologies to understand urban systems—An overview. Remote Sensing, 3, 1743–1776.
- Boarnet, M., & Crane, R. (2001). The influence of land use on travel behavior: Specification and estimation strategies. Transportation Research Part A: Policy and Practice, 35, 823–845.
- Bu, H., Meng, W., Zhang, Y., & Wan, J. (2014). Relationships between land use patterns and water quality in the Taizi River basin, China. Ecological Indicators, 41, 187–197.
- Buchhorn, M., Lesiv, M., Tsendbazar, N.-E., Herold, M., Bertels, L., & Smets, B. (2020). Copernicus global land cover layers—collection 2. Remote Sensing, 12, 1044.
- Cao, R., Zhu, J., Tu, W., Li, Q., Cao, J., Liu, B., … Qiu, G. (2018). Integrating aerial and street view images for urban land use classification. Remote Sensing, 10, 1553.
- Cao, X., Chen, J., Imura, H., & Higashi, O. (2009). A SVM-based method to extract urban areas from DMSP-OLS and SPOT VGT data. Remote Sensing of Environment, 113, 2205–2209.
- Castle, C. J., & Crooks, A. T. (2006). Principles and concepts of agent-based modelling for developing geospatial simulations. Working Paper 110. Centre For Advanced Spatial Analysis, University College London, London, UK.
- Chalkias, C., Petrakis, M., Psiloglou, B., & Lianou, M. (2006). Modelling of light pollution in suburban areas using remotely sensed imagery and GIS. Journal of Environmental Management, 79, 57–63.
- Chen, B., Chen, L., Lu, M., & Xu, B. (2017a). Wetland mapping by fusing fine spatial and hyperspectral resolution images. Ecological Modelling, 353, 95–106.
- Chen, B., Huang, B., & Xu, B. (2017b). Multi-source remotely sensed data fusion for improving land cover classification. ISPRS Journal of Photogrammetry and Remote Sensing, 124, 27–39.
- Chen, B., Jin, Y., Scaduto, E., Moritz, M. A., Goulden, M. L., & Randerson, J. T. (2021a). Climate, fuel, and land use shaped the spatial pattern of wildfire in California’s Sierra Nevada. Journal of Geophysical Research: Biogeosciences, 126, e2020JG005786.
- Chen, B., Nie, Z., Chen, Z., & Xu, B. (2017c). Quantitative estimation of 21st-century urban greenspace changes in Chinese populous cities. Science of the Total Environment, 609, 956–965.
- Chen, B., Song, Y., Huang, B., & Xu, B. (2020). A novel method to extract urban human settlements by integrating remote sensing and mobile phone locations. Science of Remote Sensing, 1, 100003.
- Chen, B., Song, Y., Jiang, T., Chen, Z., Huang, B., & Xu, B. (2018). Real-time estimation of population exposure to PM2. 5 using Mobile-and station-based big data. International Journal of Environmental Research and Public Health, 15, 573.
- Chen, B., Tu, Y., Song, Y., Theobald David, M., Zhang, T., Ren, Z., … Xu, B. (2021b). Mapping essential urban land use categories with open big data: Results for five metropolitan areas in the United States of America. ISPRS Journal of Photogrammetry and Remote Sensing (In press).
- Chen, J., Chen, J., Liao, A., Cao, X., Chen, L., Chen, X., … Lu, M. (2015). Global land cover mapping at 30 m resolution: A POK-based operational approach. ISPRS Journal of Photogrammetry and Remote Sensing, 103, 7–27.
- Chen, Y., Liu, X., Li, X., Liu, X., Yao, Y., Hu, G., … Pei, F. (2017d). Delineating urban functional areas with building-level social media data: A dynamic time warping (DTW) distance based k-medoids method. Landscape and Urban Planning, 160, 48–60.
- Cooley, S. W., Smith, L. C., Stepan, L., & Mascaro, J. (2017). Tracking dynamic northern surface water changes with high-frequency planet CubeSat imagery. Remote Sensing, 9, 1306.
- De Colstoun, B., Huang, E., Wang, C., Tilton, P., Tan, J., Phillips, B., … Wolfe, R. (2017). Global Man-made Impervious Surface (GMIS) Dataset From Landsat, Palisades. NY: NASA Socioeconomic Data and Applications Center (SEDAC).
- De Colstoun, E. C. B., & Walthall, C. L. (2006). Improving global scale land cover classifications with multi-directional POLDER data and a decision tree classifier. Remote Sensing of Environment, 100, 474–485.
- Deng, Y., Wu, C., Li, M., & Chen, R. (2015). RNDSI: A ratio normalized difference soil index for remote sensing of urban/suburban environments. International Journal of Applied Earth Observation and Geoinformation, 39, 40–48.
- Dong, R., Fang, W., Fu, H., Gan, L., Wang, J., & Gong, P. (2021). High-Resolution Land Cover Mapping Through Learning With Noise Correction. IEEE Transactions on Geoscience and Remote Sensing, 1–13.
- Dovey, K., & Pafka, E. (2017). What is functional mix? An assemblage approach. Planning Theory & Practice, 18, 249–267.
- Du, S., Du, S., Liu, B., Zhang, X., & Zheng, Z. (2020). Large-scale urban functional zone mapping by integrating remote sensing images and open social data. GIScience & Remote Sensing, 57, 411–430.
- Du, X., & Huang, Z. (2017). Ecological and environmental effects of land use change in rapid urbanization: The case of hangzhou, China. Ecological Indicators, 81, 243–251.
- Dugord, P.-A., Lauf, S., Schuster, C., & Kleinschmit, B. (2014). Land use patterns, temperature distribution, and potential heat stress risk–the case study Berlin, Germany. Computers, Environment and Urban Systems, 48, 86–98.
- Duncan, M. J., Winkler, E., Sugiyama, T., Cerin, E., Leslie, E., & Owen, N. (2010). Relationships of land use mix with walking for transport: Do land uses and geographical scale matter? Journal of Urban Health, 87, 782–795.
- Eeftens, M., Beelen, R., De Hoogh, K., Bellander, T., Cesaroni, G., Cirach, M., … De Nazelle, A. (2012). Development of land use regression models for PM2. 5, PM2. 5 absorbance, PM10 and PMcoarse in 20 European study areas; results of the ESCAPE project. Environmental Science & Technology, 46, 11195–11205.
- Elvidge, C. D., Baugh, K., Zhizhin, M., Hsu, F. C., & Ghosh, T. (2017). VIIRS night-time lights. International Journal of Remote Sensing, 38, 5860–5879.
- Elvidge, C. D., Baugh, K. E., Kihn, E. A., Kroehl, H. W., & Davis, E. R. (1997). Mapping city lights with nighttime data from the DMSP Operational Linescan System. Photogrammetric Engineering and Remote Sensing, 63, 727–734.
- UCL-Geomatics (2017). Land Cover CCI Product User Guide Version 2.0. Available online:. http://maps.elie.ucl.ac.be/CCI/viewer/download/ESACCI-LC-Ph2-PUGv2_2.0.pdf
- Feddema, J. J., Oleson, K. W., Bonan, G. B., Mearns, L. O., Buja, L. E., Meehl, G. A., & Washington, W. M. (2005). The importance of land-cover change in simulating future climates. Science, 310, 1674–1678.
- Feng, Q., Zhu, D., Yang, J., & Li, B. (2019). Multisource hyperspectral and lidar data fusion for urban land-use mapping based on a modified two-branch convolutional neural network. ISPRS International Journal of Geo-Information, 8, 28.
- Findell, K. L., Berg, A., Gentine, P., Krasting, J. P., Lintner, B. R., Malyshev, S., … Shevliakova, E. (2017). The impact of anthropogenic land use and land cover change on regional climate extremes. Nature Communications, 8, 1–10.
- Foley, J. A., DeFries, R., Asner, G. P., Barford, C., Bonan, G., Carpenter, S. R., … Gibbs, H. K. (2005). Global consequences of land use. Science, 309, 570–574.
- Foody, G. M. (2002). Status of land cover classification accuracy assessment. Remote Sensing of Environment, 80, 185–201.
- Frias-Martinez, V., & Frias-Martinez, E. (2014). Spectral clustering for sensing urban land use using Twitter activity. Engineering Applications of Artificial Intelligence, 35, 237–245.
- Friedl, M. A., Sulla-Menashe, D., Tan, B., Schneider, A., Ramankutty, N., Sibley, A., & Huang, X. (2010). MODIS Collection 5 global land cover: Algorithm refinements and characterization of new datasets. Remote Sensing of Environment, 114, 168–182.
- Gamba, P., Aldrighi, M., & Stasolla, M. (2010). Robust extraction of urban area extents in HR and VHR SAR images. IEEE Journal of Selected Topics in Applied Earth Observations and Remote Sensing, 4, 27–34.
- Gámez-Virués, S., Perović, D. J., Gossner, M. M., Börschig, C., Blüthgen, N., De Jong, H., … Maier, G. (2015). Landscape simplification filters species traits and drives biotic homogenization. Nature Communications, 6, 1–8.
- Gao, B.-C. (1996). NDWI—A normalized difference water index for remote sensing of vegetation liquid water from space. Remote Sensing of Environment, 58, 257–266.
- Gao, J., & O’Neill, B. C. (2020). Mapping global urban land for the 21st century with data-driven simulations and Shared Socioeconomic Pathways. Nature Communications, 11, 2302.
- Gao, L., Du, Q., Zhang, B., Yang, W., & Wu, Y. (2013). A comparative study on linear regression-based noise estimation for hyperspectral imagery. IEEE Journal of Selected Topics in Applied Earth Observations and Remote Sensing, 6, 488–498.
- Gilbert, E., & Karahalios, K. (2009). Predicting tie strength with social media. In Proceedings of the SIGCHI conference on human factors in computing systems (pp. 211–220), Boston, MA, USA.
- Gong, P., Chen, B., Li, X., Liu, H., Wang, J., Bai, Y., … Feng, S. (2020a). Mapping essential urban land use categories in China (EULUC-China): Preliminary results for 2018. Science Bulletin, 65, 182–187.
- Gong, P., & Howarth, P. J. (1990). The use of structural information for improving land-cover classification accuracies at the rural-urban fringe. Photogrammetric Engineering and Remote Sensing, 56, 67–73.
- Gong, P., & Howarth, P. J. (1992). Frequency-based contextual classification and gray-level vector reduction for land-use identification. Photogrammetric Engineering and Remote Sensing, 58, 423–437.
- Gong, P., Li, X., Wang, J., Bai, Y., Chen, B., Hu, T., … Zhang, W. (2020b). Annual maps of global artificial impervious area (GAIA) between 1985 and 2018. Remote Sensing of Environment, 236, 111510.
- Gong, P., Liang, S., Carlton, E. J., Jiang, Q., Wu, J., Wang, L., & Remais, J. V. (2012). Urbanisation and health in China. The Lancet, 379, 843–852.
- Gong, P., Liu, H., Zhang, M., Li, C., Wang, J., Huang, H., … Bai, Y. (2019). Stable classification with limited sample: Transferring a 30-m resolution sample set collected in 2015 to mapping 10-m resolution global land cover in 2017. Science Bulletin, 64, 370–373.
- Gong, P., Marceau, D. J., & Howarth, P. J. (1992). A comparison of spatial feature extraction algorithms for land-use classification with SPOT HRV data. Remote Sensing of Environment, 40, 137–151.
- Gong, P., Wang, J., Yu, L., Zhao, Y., Zhao, Y., Liang, L., … Liu, S. (2013). Finer resolution observation and monitoring of global land cover: First mapping results with Landsat TM and ETM+ data. International Journal of Remote Sensing, 34, 2607–2654.
- Goodchild, M. F. (2007). Citizens as sensors: The world of volunteered geography. GeoJournal, 69, 211–221.
- Goodchild, M. F., & Li, L. (2012). Assuring the quality of volunteered geographic information. Spatial Statistics, 1, 110–120.
- Grippa, T., Georganos, S., Zarougui, S., Bognounou, P., Diboulo, E., Forget, Y., … Wolff, E. (2018). Mapping urban land use at street block level using openstreetmap, remote sensing data, and spatial metrics. ISPRS International Journal of Geo-Information, 7, 246.
- Groeneveld, J., Müller, B., Buchmann, C. M., Dressler, G., Guo, C., Hase, N., … Lauf, T. (2017). Theoretical foundations of human decision-making in agent-based land use models–A review. Environmental Modelling and Software, 87, 39–48.
- Guan, D., Li, H., Inohae, T., Su, W., Nagaie, T., & Hokao, K. (2011). Modeling urban land use change by the integration of cellular automaton and Markov model. Ecological Modelling, 222, 3761–3772.
- Guan, Q., Cheng, S., Pan, Y., Yao, Y., & Zeng, W. (2021). Sensing Mixed Urban Land-Use Patterns Using Municipal Water Consumption Time Series. Annals of the American Association of Geographers, 111, 68–86.
- Hagenauer, J., & Helbich, M. (2012). Mining urban land-use patterns from volunteered geographic information by means of genetic algorithms and artificial neural networks. International Journal of Geographical Information Science, 26, 963–982.
- Handy, S. L., Boarnet, M. G., Ewing, R., & Killingsworth, R. E. (2002). How the built environment affects physical activity: Views from urban planning. American Journal of Preventive Medicine, 23, 64–73.
- Hansen, M. C., DeFries, R. S., Townshend, J. R., & Sohlberg, R. (2000). Global land cover classification at 1 km spatial resolution using a classification tree approach. International Journal of Remote Sensing, 21, 1331–1364.
- Hansen, M. C., Potapov, P. V., Moore, R., Hancher, M., Turubanova, S. A., Tyukavina, A., … Loveland, T. R. (2013). High-resolution global maps of 21st-century forest cover change. Science, 342, 850–853.
- He, C., Shi, P., Chen, J., Li, X., Pan, Y., Li, J., … Li, J. (2005). Developing land use scenario dynamics model by the integration of system dynamics model and cellular automata model. Science in China Series D: Earth Sciences, 48, 1979–1989.
- Henderson, S. B., Beckerman, B., Jerrett, M., & Brauer, M. (2007). Application of land use regression to estimate long-term concentrations of traffic-related nitrogen oxides and fine particulate matter. Environmental Science & Technology, 41, 2422–2428.
- Herold, M., Mayaux, P., Woodcock, C., Baccini, A., & Schmullius, C. (2008). Some challenges in global land cover mapping: An assessment of agreement and accuracy in existing 1 km datasets. Remote Sensing of Environment, 112, 2538–2556.
- Heusinkveld, B. G., Steeneveld, G. V., Van Hove, L., Jacobs, C., & Holtslag, A. (2014). Spatial variability of the Rotterdam urban heat island as influenced by urban land use. Journal of Geophysical Research: Atmospheres, 119, 677–692.
- Hoek, G., Beelen, R., De Hoogh, K., Vienneau, D., Gulliver, J., Fischer, P., & Briggs, D. (2008). A review of land-use regression models to assess spatial variation of outdoor air pollution. Atmospheric Environment, 42, 7561–7578.
- Hu, S., & Wang, L. (2013). Automated urban land-use classification with remote sensing. International Journal of Remote Sensing, 34, 790–803.
- Hu, T., Yang, J., Li, X., & Gong, P. (2016). Mapping urban land use by using landsat images and open social data. Remote Sensing, 8, 151.
- Huang, B., Zhang, H., & Yu, L. (2012). Improving Landsat ETM+ urban area mapping via spatial and angular fusion with MISR multi-angle observations. IEEE Journal of Selected Topics in Applied Earth Observations and Remote Sensing, 5, 101–109.
- Huang, B., Zhao, B., & Song, Y. (2018). Urban land-use mapping using a deep convolutional neural network with high spatial resolution multispectral remote sensing imagery. Remote Sensing of Environment, 214, 73–86.
- Huang, X., Yang, J., Li, J., & Wen, D. (2021). Urban functional zone mapping by integrating high spatial resolution nighttime light and daytime multi-view imagery. ISPRS Journal of Photogrammetry and Remote Sensing, 175, 403–415.
- Huete, A., Didan, K., Miura, T., Rodriguez, E. P., Gao, X., & Ferreira, L. G. (2002). Overview of the radiometric and biophysical performance of the MODIS vegetation indices. Remote Sensing of Environment, 83, 195–213.
- Jia, P., Pan, X., Liu, F., He, P., Zhang, W., Liu, L., … Chen, L. (2021). Land use mix in the neighbourhood and childhood obesity. Obesity Reviews, 22, e13098.
- Jia, Y., Ge, Y., Ling, F., Guo, X., Wang, J., Wang, L., … Li, X. (2018). Urban land use mapping by combining remote sensing imagery and mobile phone positioning data. Remote Sensing, 10, 446.
- Jusuf, S. K., Wong, N. H., Hagen, E., Anggoro, R., & Hong, Y. (2007). The influence of land use on the urban heat island in Singapore. Habitat International, 31, 232–242.
- Kaplan, A. M., & Haenlein, M. (2010). Users of the world, unite! The challenges and opportunities of Social Media. Business Horizons, 53, 59–68.
- Kennedy, R. E., Yang, Z., & Cohen, W. B. (2010). Detecting trends in forest disturbance and recovery using yearly Landsat time series: 1. LandTrendr—Temporal segmentation algorithms. Remote Sensing of Environment, 114, 2897–2910.
- LeCun, Y., Bengio, Y., & Hinton, G. (2015). Deep learning. Nature, 521, 436–444.
- Lee, S.-W., Hwang, S.-J., Lee, S.-B., Hwang, H.-S., & Sung, H.-C. (2009). Landscape ecological approach to the relationships of land use patterns in watersheds to water quality characteristics. Landscape and Urban Planning, 92, 80–89.
- Lesiv, M., Fritz, S., McCallum, I., Tsendbazar, N., Herold, M., Pekel, J.-F., … Van De Kerchove, R. (2017). Evaluation of ESA CCI prototype land cover map at 20 m. IIASA Working Paper Series, WP-17-021. International Institute for Aplplied Systems Analysis: Laxenburg, Austria.
- Li, W., Bai, Y., Zhou, W., Han, C., & Han, L. (2015). Land use significantly affects the distribution of urban green space: Case study of Shanghai, China. Journal of Urban Planning and Development, 141, A4014001.
- Li, X., & Gong, P. (2016). Urban growth models: Progress and perspective. Science Bulletin, 61, 1637–1650.
- Li, X., Levin, N., Xie, J., & Li, D. (2020a). Monitoring hourly night-time light by an unmanned aerial vehicle and its implications to satellite remote sensing. Remote Sensing of Environment, 247, 111942.
- Li, X., & Li, D. (2014). Can night-time light images play a role in evaluating the Syrian Crisis? International Journal of Remote Sensing, 35, 6648–6661.
- Li, X., & Yeh, A. G.-O. (2000). Modelling sustainable urban development by the integration of constrained cellular automata and GIS. International Journal of Geographical Information Science, 14, 131–152.
- Li, X., Zhao, L., Li, D., & Xu, H. (2018). Mapping urban extent using Luojia 1-01 nighttime light imagery. Sensors, 18, 3665.
- Li, X., & Zhou, Y. (2017). Urban mapping using DMSP/OLS stable night-time light: A review. International Journal of Remote Sensing, 38, 6030–6046.
- Li, X., Zhou, Y., Gong, P., Seto, K. C., & Clinton, N. (2020b). Developing a method to estimate building height from Sentinel-1 data. Remote Sensing of Environment, 240, 111705.
- Liu, H., Gong, P., Wang, J., Wang, X., Ning, G., & Xu, B. (2021). Production of global daily seamless data cubes and quantification of global land cover change from 1985 to 2020-iMap World 1.0. Remote Sensing of Environment, 258, 112364.
- Liu, R., Zhang, K., Zhang, Z., & Borthwick, A. G. (2014). Land-use suitability analysis for urban development in Beijing. Journal of Environmental Management, 145, 170–179.
- Liu, S., Qi, Z., Li, X., & Yeh, A. G.-O. (2019). Integration of convolutional neural networks and object-based post-classification refinement for land use and land cover mapping with optical and sar data. Remote Sensing, 11, 690.
- Liu, S., & Shi, Q. (2020). Local climate zone mapping as remote sensing scene classification using deep learning: A case study of metropolitan China. ISPRS Journal of Photogrammetry and Remote Sensing, 164, 229–242.
- Liu, X. (2008). Airborne LiDAR for DEM generation: Some critical issues. Progress in Physical Geography, 32, 31–49.
- Liu, X., He, J., Yao, Y., Zhang, J., Liang, H., Wang, H., & Hong, Y. (2017a). Classifying urban land use by integrating remote sensing and social media data. International Journal of Geographical Information Science, 31, 1675–1696.
- Liu, X., Hu, G., Chen, Y., Li, X., Xu, X., Li, S., … Wang, S. (2018). High-resolution multi-temporal mapping of global urban land using Landsat images based on the Google Earth Engine Platform. Remote Sensing of Environment, 209, 227–239.
- Liu, X., Li, X., Chen, Y., Tan, Z., Li, S., & Ai, B. (2010). A new landscape index for quantifying urban expansion using multi-temporal remotely sensed data. Landscape Ecology, 25, 671–682.
- Liu, X., Liang, X., Li, X., Xu, X., Ou, J., Chen, Y., … Pei, F. (2017b). A future land use simulation model (FLUS) for simulating multiple land use scenarios by coupling human and natural effects. Landscape and Urban Planning, 168, 94–116.
- Liu, X., & Long, Y. (2016). Automated identification and characterization of parcels with OpenStreetMap and points of interest. Environment and Planning. B, Planning & Design, 43, 341–360.
- Liu, Y., Wang, F., Xiao, Y., & Gao, S. (2012). Urban land uses and traffic ‘source-sink areas’: Evidence from GPS-enabled taxi data in Shanghai. Landscape and Urban Planning, 106, 73–87.
- Lo, C., & Choi, J. (2004). A hybrid approach to urban land use/cover mapping using Landsat 7 Enhanced Thematic Mapper Plus (ETM+) images. International Journal of Remote Sensing, 25, 2687–2700.
- Louail, T., Lenormand, M., Ros, O. G. C., Picornell, M., Herranz, R., Frias-Martinez, E., … Barthelemy, M. (2014). From mobile phone data to the spatial structure of cities. Scientific Reports, 4, 1–12.
- Loveland, T. R., Reed, B. C., Brown, J. F., Ohlen, D. O., Zhu, Z., Yang, L., & Merchant, J. W. (2000). Development of a global land cover characteristics database and IGBP DISCover from 1 km AVHRR data. International Journal of Remote Sensing, 21, 1303–1330.
- Lu, D., & Weng, Q. (2006). Use of impervious surface in urban land-use classification. Remote Sensing of Environment, 102, 146–160.
- Lucht, W., Schaaf, C. B., & Strahler, A. H. (2000). An algorithm for the retrieval of albedo from space using semiempirical BRDF models. IEEE Transactions on Geoscience and Remote Sensing, 38, 977–998.
- Ma, T., Zhou, C., Pei, T., Haynie, S., & Fan, J. (2012). Quantitative estimation of urbanization dynamics using time series of DMSP/OLS nighttime light data: A comparative case study from China’s cities. Remote Sensing of Environment, 124, 99–107.
- Malarvizhi, K., Kumar, S. V., & Porchelvan, P. (2016). Use of high resolution google earth satellite imagery in landuse map preparation for urban related applications. Procedia Technology, 24, 1835–1842.
- Malinverni, E. S., Tassetti, A. N., Mancini, A., Zingaretti, P., Frontoni, E., & Bernardini, A. (2011). Hybrid object-based approach for land use/land cover mapping using high spatial resolution imagery. International Journal of Geographical Information Science, 25, 1025–1043.
- Man, Q., Dong, P., & Guo, H. (2015a). Pixel- and feature-level fusion of hyperspectral and lidar data for urban land-use classification. International Journal of Remote Sensing, 36, 1618–1644.
- Man, Q., Dong, P., & Guo, H. (2015b). Pixel-and feature-level fusion of hyperspectral and lidar data for urban land-use classification. International Journal of Remote Sensing, 36, 1618–1644.
- Masiliūnas, D., Tsendbazar, N.-E., Herold, M., Lesiv, M., Buchhorn, M., & Verbesselt, J. (2021). Global land characterisation using land cover fractions at 100 m resolution. Remote Sensing of Environment, 259, 112409.
- Matthews, R. B., Gilbert, N. G., Roach, A., Polhill, J. G., & Gotts, N. M. (2007). Agent-based land-use models: A review of applications. Landscape Ecology, 22, 1447–1459.
- Mesev, T., Longley, P. A., Batty, M., & Xie, Y. (1995). Morphology from imagery: Detecting and measuring the density of urban land use. Environment & Planning A, 27, 759–780.
- Mikolov, T., Sutskever, I., Chen, K., Corrado, G., & Dean, J. (2013). Distributed representations of words and phrases and their compositionality. arXiv Preprint arXiv, 1310, 4546.
- Myint, S. W., Gober, P., Brazel, A., Grossman-Clarke, S., & Weng, Q. (2011). Per-pixel vs. object-based classification of urban land cover extraction using high spatial resolution imagery. Remote Sensing of Environment, 115, 1145–1161.
- Nations, U. (2018). 2018 Revision of World Urbanization Prospects. In. New York: The Population Division of the Department of Economic and Social Affairs.
- Özkan, C., & Sunar Erbek, F. (2005). Comparing feature extraction techniques for urban land‐use classification. International Journal of Remote Sensing, 26, 747–757.
- Pacifici, F., Chini, M., & Emery, W. J. (2009). A neural network approach using multi-scale textural metrics from very high-resolution panchromatic imagery for urban land-use classification. Remote Sensing of Environment, 113, 1276–1292.
- Pan, G., Qi, G., Wu, Z., Zhang, D., & Li, S. (2012). Land-use classification using taxi GPS traces. IEEE Transactions on Intelligent Transportation Systems, 14, 113–123.
- Pan, S. J., & Yang, Q. (2009). A survey on transfer learning. IEEE Transactions on Knowledge and Data Engineering, 22, 1345–1359.
- Pan, Y., Zeng, W., Guan, Q., Yao, Y., Liang, X., Yue, H., … Wang, J. (2020). Spatiotemporal dynamics and the contributing factors of residential vacancy at a fine scale: A perspective from municipal water consumption. Cities, 103, 102745.
- Paola, J. D., & Schowengerdt, R. A. (1995). A detailed comparison of backpropagation neural network and maximum-likelihood classifiers for urban land use classification. IEEE Transactions on Geoscience and Remote Sensing, 33, 981–996.
- Parker, D. C., Manson, S. M., Janssen, M. A., Hoffmann, M. J., & Deadman, P. (2003). Multi-agent systems for the simulation of land-use and land-cover change: A review. Annals of the Association of American Geographers, 93, 314–337.
- Patz, J. A., Daszak, P., Tabor, G. M., Aguirre, A. A., Pearl, M., Epstein, J., … Molyneux, D. (2004). Unhealthy landscapes: Policy recommendations on land use change and infectious disease emergence. Environmental Health Perspectives, 112, 1092–1098.
- Pei, T., Sobolevsky, S., Ratti, C., Shaw, S.-L., Li, T., & Zhou, C. (2014). A new insight into land use classification based on aggregated mobile phone data. International Journal of Geographical Information Science, 28, 1988–2007.
- Pelizari, P. A., Spröhnle, K., Geiß, C., Schoepfer, E., Plank, S., & Taubenböck, H. (2018). Multi-sensor feature fusion for very high spatial resolution built-up area extraction in temporary settlements. Remote Sensing of Environment, 209, 793–807.
- Pesaresi, M., Huadong, G., Blaes, X., Ehrlich, D., Ferri, S., Gueguen, L., … Lu, L. (2013). A global human settlement layer from optical HR/VHR RS data: Concept and first results. IEEE Journal of Selected Topics in Applied Earth Observations and Remote Sensing, 6, 2102–2131.
- Pielke Sr, R. A., Pitman, A., Niyogi, D., Mahmood, R., McAlpine, C., Hossain, F., … Fall, S. (2011). Land use/land cover changes and climate: Modeling analysis and observational evidence. Wiley Interdisciplinary Reviews: Climate Change, 2, 828–850.
- Poghosyan, A., & Golkar, A. (2017). CubeSat evolution: Analyzing CubeSat capabilities for conducting science missions. Progress in Aerospace Sciences, 88, 59–83.
- Puig-Suari, J., Turner, C., & Ahlgren, W. (2001). Development of the standard CubeSat deployer and a CubeSat class PicoSatellite. In, 2001 IEEE aerospace conference proceedings (Cat. No. 01TH8542) (pp. 1/347–341/353 vol. 341): IEEE, Big Sky, MT, USA.
- Rockström, J., Steffen, W., Noone, K., Persson, Å., Chapin III, F. S., Lambin, E., … Schellnhuber, H. J. (2009). Planetary boundaries: Exploring the safe operating space for humanity. Ecology and Society, 14, 32.
- Rogers, A., & Kearney, M. (2004). Reducing signature variability in unmixing coastal marsh Thematic Mapper scenes using spectral indices. International Journal of Remote Sensing, 25, 2317–2335.
- Ruiz Hernandez, I. E., & Shi, W. (2018). A Random Forests classification method for urban land-use mapping integrating spatial metrics and texture analysis. International Journal of Remote Sensing, 39, 1175–1198.
- Running, S. W. (2008). Ecosystem disturbance, carbon, and climate. Science, 321, 652–653.
- Sakieh, Y., Salmanmahiny, A., Jafarnezhad, J., Mehri, A., Kamyab, H., & Galdavi, S. (2015). Evaluating the strategy of decentralized urban land-use planning in a developing region. Land Use Policy, 48, 534–551.
- Schmidhuber, J. (2015). Deep learning in neural networks: An overview. Neural Networks, 61, 85–117.
- Schneider, A., Friedl, M. A., & Potere, D. (2010). Mapping global urban areas using MODIS 500-m data: New methods and datasets based on ‘urban ecoregions’. Remote Sensing of Environment, 114, 1733–1746.
- Schneider, A., & Woodcock, C. E. (2008). Compact, dispersed, fragmented, extensive? A comparison of urban growth in twenty-five global cities using remotely sensed data, pattern metrics and census information. Urban Studies, 45, 659–692.
- Seto, K. C., & Fragkias, M. (2005). Quantifying spatiotemporal patterns of urban land-use change in four cities of China with time series landscape metrics. Landscape Ecology, 20, 871–888.
- Shi, Y., Ren, C., Lau, K. K.-L., & Ng, E. (2019). Investigating the influence of urban land use and landscape pattern on PM2. 5 spatial variation using mobile monitoring and WUDAPT. Landscape and Urban Planning, 189, 15–26.
- Silva, E. A., & Clarke, K. C. (2002). Calibration of the SLEUTH urban growth model for Lisbon and Porto, Portugal. Computers, Environment and Urban Systems, 26, 525–552.
- Son, J.-Y., Kim, H., & Bell, M. L. (2015). Does urban land-use increase risk of asthma symptoms? Environmental Research, 142, 309–318.
- Song, Y., Chen, B., & Kwan, M.-P. (2020). How does urban expansion impact people’s exposure to green environments? A comparative study of 290 Chinese cities. Journal of Cleaner Production, 246, 119018.
- Song, Y., Huang, B., Cai, J., & Chen, B. (2018). Dynamic assessments of population exposure to urban greenspace using multi-source big data. Science of the Total Environment, 634, 1315–1325.
- Srivastava, S., Vargas-Munoz, J. E., & Tuia, D. (2019). Understanding urban landuse from the above and ground perspectives: A deep learning, multimodal solution. Remote Sensing of Environment, 228, 129–143.
- Stone, B., & Norman, J. M. (2006). Land use planning and surface heat island formation: A parcel-based radiation flux approach. Atmospheric Environment, 40, 3561–3573.
- Su, M., Guo, R., Chen, B., Hong, W., Wang, J., Feng, Y., & Xu, B. (2020). Sampling Strategy for Detailed Urban Land Use Classification: A Systematic Analysis in Shenzhen. Remote Sensing, 12, 1497.
- Sun, J., Wang, H., Song, Z., Lu, J., Meng, P., & Qin, S. (2020). Mapping Essential Urban Land Use Categories in Nanjing by Integrating Multi-Source Big Data. Remote Sensing, 12, 2386.
- Tateishi, R., Uriyangqai, B., Al-Bilbisi, H., Ghar, M. A., Tsend-Ayush, J., Kobayashi, T., … Alsaaideh, B. (2011). Production of global land cover data–GLCNMO. International Journal of Digital Earth, 4, 22–49.
- Theobald, D. M. (2014). Development and Applications of a Comprehensive Land Use Classification and Map for the US. PLoS ONE, 9, e94628.
- Theobald, D. M., Kennedy, C., Chen, B., Oakleaf, J., Baruch-Mordo, S., & Kiesecker, J. (2020). Earth transformed: Detailed mapping of global human modification from 1990 to 2017. Earth System Science Data, 12, 1953–1972.
- Treitz, P., & Rogan, J. (2004). Remote sensing for mapping and monitoring land-cover and land-use change-an introduction. Progress in Planning, 61, 269–279.
- Tu, Y., Chen, B., Yu, L., Xin, Q., Gong, P., & Xu, B. (2021). How does urban expansion interact with cropland loss? A comparison of 14 Chinese cities from 1980 to 2015. Landscape Ecology, 36, 243–263.
- Tu, Y., Chen, B., Zhang, T., & Xu, B. (2020). Regional Mapping of Essential Urban Land Use Categories in China: A Segmentation-Based Approach. Remote Sensing, 12, 1058.
- Tucker, C. J. (1979). Red and photographic infrared linear combinations for monitoring vegetation. Remote Sensing of Environment, 8, 127–150.
- Turner, B. L., Lambin, E. F., & Reenberg, A. (2007). The emergence of land change science for global environmental change and sustainability. Proceedings of the National Academy of Sciences, 104, 20666–20671.
- Uriarte, M., Yackulic, C. B., Lim, Y., & Arce-Nazario, J. A. (2011). Influence of land use on water quality in a tropical landscape: A multi-scale analysis. Landscape Ecology, 26, 1151–1164.
- van de Coevering, P., & Schwanen, T. (2006). Re-evaluating the impact of urban form on travel patternsin Europe and North-America. Transport Policy, 13, 229–239.
- Verbesselt, J., Hyndman, R., Newnham, G., & Culvenor, D. (2010). Detecting trend and seasonal changes in satellite image time series. Remote Sensing of Environment, 114, 106–115.
- Verburg, P. H., Van De Steeg, J., Veldkamp, A., & Willemen, L. (2009). From land cover change to land function dynamics: A major challenge to improve land characterization. Journal of Environmental Management, 90, 1327–1335.
- Wakamiya, S., Lee, R., & Sumiya, K. (2011). Urban area characterization based on semantics of crowd activities in twitter. In International Conference on GeoSpatial Sematics (pp. 108–123): Springer, Brest, France.
- Wang, J., Lin, Y., Glendinning, A., & Xu, Y. (2018). Land-use changes and land policies evolution in China’s urbanization processes. Land Use Policy, 75, 375–387.
- Wang, P., Huang, C., Brown De Colstoun, E., Tilton, J., & Tan, B. (2017). Global Human Built-up And Settlement Extent (HBASE) Dataset From Landsat. Palisades, NY: NASA Socioeconomic Data and Applications Center (SEDAC)..
- Wang, Y., Wang, T., Tsou, M.-H., Li, H., Jiang, W., & Guo, F. (2016). Mapping dynamic urban land use patterns with crowdsourced geo-tagged social media (Sina-Weibo) and commercial points of interest collections in Beijing, China. Sustainability, 8, 1202.
- Weng, Q., & Yang, S. (2006). Urban air pollution patterns, land use, and thermal landscape: An examination of the linkage using GIS. Environmental Monitoring and Assessment, 117, 463–489.
- White, R., Uljee, I., & Engelen, G. (2012). Integrated modelling of population, employment and land-use change with a multiple activity-based variable grid cellular automaton. International Journal of Geographical Information Science, 26, 1251–1280.
- Whitmee, S., Haines, A., Beyrer, C., Boltz, F., Capon, A. G., de Souza Dias, B. F., … Head, P. (2015). Safeguarding human health in the Anthropocene epoch: Report of The Rockefeller Foundation–Lancet Commission on planetary health. The Lancet, 386, 1973–2028.
- Wong, N. H., Jusuf, S. K., Syafii, N. I., Chen, Y., Hajadi, N., Sathyanarayanan, H., & Manickavasagam, Y. V. (2011). Evaluation of the impact of the surrounding urban morphology on building energy consumption. Solar Energy, 85, 57–71.
- Wu, F. (2002). Calibration of stochastic cellular automata: The application to rural-urban land conversions. International Journal of Geographical Information Science, 16, 795–818.
- Xie, Y., & Weng, Q. (2016). World energy consumption pattern as revealed by DMSP-OLS nighttime light imagery. GIScience & Remote Sensing, 53, 265–282.
- Xu, B., & Gong, P. (2007). Land-use/land-cover classification with multispectral and hyperspectral EO-1 data. Photogrammetric Engineering & Remote Sensing, 73, 955–965.
- Xu, B., & Gong, P. (2008). Noise estimation in a noise-adjusted principal component transformation and hyperspectral image restoration. Canadian Journal of Remote Sensing, 34, 271–286.
- Xu, H. (2006). Modification of normalised difference water index (NDWI) to enhance open water features in remotely sensed imagery. International Journal of Remote Sensing, 27, 3025–3033.
- Xu, H. (2008). A new index for delineating built‐up land features in satellite imagery. International Journal of Remote Sensing, 29, 4269–4276.
- Yan, Y., Schultz, M., & Zipf, A. (2019). An exploratory analysis of usability of Flickr tags for land use/land cover attribution. Geo-Spatial Information Science, 22, 12–22.
- Yao, Y., Li, X., Liu, X., Liu, P., Liang, Z., Zhang, J., & Mai, K. (2017a). Sensing spatial distribution of urban land use by integrating points-of-interest and Google Word2Vec model. International Journal of Geographical Information Science, 31, 825–848.
- Yao, Y., Liu, X., Li, X., Liu, P., Hong, Y., Zhang, Y., & Mai, K. (2017b). Simulating urban land-use changes at a large scale by integrating dynamic land parcel subdivision and vector-based cellular automata. International Journal of Geographical Information Science, 31, 2452–2479.
- Yu, B., Shi, K., Hu, Y., Huang, C., Chen, Z., & Wu, J. (2015). Poverty evaluation using NPP-VIIRS nighttime light composite data at the county level in China. IEEE Journal of Selected Topics in Applied Earth Observations and Remote Sensing, 8, 1217–1229.
- Yu, X., Zhao, G., Chang, C., Yuan, X., & Heng, F. (2019). Bgvi: A new index to estimate street-side greenery using baidu street view image. Forests, 10, 3.
- Yuan, C., Ng, E., & Norford, L. K. (2014). Improving air quality in high-density cities by understanding the relationship between air pollutant dispersion and urban morphologies. Building and Environment, 71, 245–258.
- Yuan, J., Zheng, Y., & Xie, X. (2012). Discovering regions of different functions in a city using human mobility and POIs. In Proceedings of the 18th ACM SIGKDD international conference on Knowledge discovery and data mining (pp. 186–194), Edmonton Alberta, Canada.
- Zahnow, R. (2018). Mixed land use: Implications for violence and property crime. Los Angeles, CA: SAGE Publications Sage CA.
- Zha, Y., Gao, J., & Ni, S. (2003). Use of normalized difference built-up index in automatically mapping urban areas from TM imagery. International Journal of Remote Sensing, 24, 583–594.
- Zhai, W., Bai, X., Shi, Y., Han, Y., Peng, Z.-R., & Gu, C. (2019). Beyond Word2vec: An approach for urban functional region extraction and identification by combining Place2vec and POIs. Computers, Environment and Urban Systems, 74, 1–12.
- Zhang, C., Sargent, I., Pan, X., Li, H., Gardiner, A., Hare, J., & Atkinson, P. M. (2018). An object-based convolutional neural network (OCNN) for urban land use classification. Remote Sensing of Environment, 216, 57–70.
- Zhang, J., Li, X., Yao, Y., Hong, Y., He, J., Jiang, Z., & Sun, J. (2021). The Traj2Vec model to quantify residents’ spatial trajectories and estimate the proportions of urban land-use types. International Journal of Geographical Information Science, 35, 193–211.
- Zhang, M. (2004). The role of land use in travel mode choice: Evidence from Boston and Hong Kong. Journal of the American Planning Association, 70, 344–360.
- Zhang, Q., & Seto, K. C. (2011). Mapping urbanization dynamics at regional and global scales using multi-temporal DMSP/OLS nighttime light data. Remote Sensing of Environment, 115, 2320–2329.
- Zhang, R., & Ma, J. (2009). Feature selection for hyperspectral data based on recursive support vector machines. International Journal of Remote Sensing, 30, 3669–3677.
- Zhang, W., Li, W., Zhang, C., Hanink, D. M., Li, X., & Wang, W. (2017a). Parcel-based urban land use classification in megacity using airborne LiDAR, high resolution orthoimagery, and Google Street View. Computers, Environment and Urban Systems, 64, 215–228.
- Zhang, X., Chen, G., Wang, W., Wang, Q., & Dai, F. (2017b). Object-based land-cover supervised classification for very-high-resolution UAV images using stacked denoising autoencoders. IEEE Journal of Selected Topics in Applied Earth Observations and Remote Sensing, 10, 3373–3385.
- Zhang, X., Liu, L., Chen, X., Gao, Y., Xie, S., & Mi, J. (2020a). GLC_FCS30: Global land-cover product with fine classification system at 30 m using time-series Landsat imagery. Earth System Science Data Discussions, 13, 1–31.
- Zhang, X., Liu, L., Wu, C., Chen, X., Gao, Y., Xie, S., & Zhang, B. (2020b). Development of a global 30 m impervious surface map using multisource and multitemporal remote sensing datasets with the Google Earth Engine platform. Earth System Science Data, 12, 1625–1648.
- Zhang, Y., Li, Q., Huang, H., Wu, W., Du, X., & Wang, H. (2017c). The combined use of remote sensing and social sensing data in fine-grained urban land use mapping: A case study in Beijing, China. Remote Sensing, 9, 865.
- Zhong, Y., Su, Y., Wu, S., Zheng, Z., Zhao, J., Ma, A., … Pellikka, P. (2020). Open-source data-driven urban land-use mapping integrating point-line-polygon semantic objects: A case study of Chinese cities. Remote Sensing of Environment, 247, 111838.
- Zhou, H., & Gao, H. (2020). The impact of urban morphology on urban transportation mode: A case study of Tokyo. Case Studies on Transport Policy, 8, 197–205.
- Zhou, W. (2013). An object-based approach for urban land cover classification: Integrating LiDAR height and intensity data. IEEE Geoscience and Remote Sensing Letters, 10, 928–931.
- Zhu, Z., & Woodcock, C. E. (2014). Continuous change detection and classification of land cover using all available Landsat data. Remote Sensing of Environment, 144, 152–171.
- Zong, L., He, S., Lian, J., Bie, Q., Wang, X., Dong, J., & Xie, Y. (2020). Detailed Mapping of Urban Land Use Based on Multi-Source Data: A Case Study of Lanzhou. Remote Sensing, 12, 1987.