
ABSTRACT
Urban green space (UGS) is essential for sustainable urbanization and human well-being. The utilization status of UGS is closely related to the provision of ecosystem services for urban residents. Limitations on data availability, however, have led to the absence of a comprehensive approach for evaluating the actual utilization status of UGS at a large scale. Furthermore, differences in actual UGS utilization between intra-urban and peri-urban areas have not received enough attention. This study used big data analysis by combining point of interest (POI) and land use and cover change (LUCC) to quantify the spatial patterns of UGS utilization, and to evaluate the actual utilization status of UGS in 366 cities on the Chinese mainland. We also explored the differences in the actual utilization of UGS in intra-urban and peri-urban areas. The results showed that 94.01% of UGS resources in China had not been utilized. There was a clear pattern of spatial mismatch between the stock and the actual utilization of UGS, especially in the northwestern region indicated by the Hu Huanyong Line. The actual utilization rate of UGS was closely related to the regional development level. There was a certain mismatch between the actual utilization and stock of intraurban green space (IUGS). The hot spots of the actual utilization rate of IUGS were in Yunnan, Guizhou, and Sichuan Provinces in southwestern China. The differences in UGS actual utilization rates between IUGS and peri-urban green space (PUGS) were small in eastern China, but large in southwestern and northwestern China. The actual utilization rate of IUGS in most Chinese cities was significantly larger than that of PUGS, indicating that PUGS were not well utilized. Our results provide scientific support for urban and regional planners in targeting specific areas for UGS design and development, and in optimizing future UGS planning in China.
1. Introduction
Urban green space (UGS) is the natural environment in city connecting humans with nature such as parks, forests, grasslands, river corridors, and wetlands (Chiesura, Citation2004; Dai, Citation2011; Wolch, Byrne, & Newell, Citation2014). UGS provides cities with many ecosystem services, including preventing urban waterlogging, reducing the urban heat island effect, and purifying air and water (Bolund & Hunhammar, Citation1999; Graca et al., Citation2018). These contribute to the resilience and sustainability of urban communities (Hartig et al., Citation2014; Zhang et al., Citation2020). UGS also provides leisure, entertainment, fitness, aesthetics, noise reduction, and other services to the population, reduces the prevalence of chronic diseases (Cole, Triguero-Mas, Connolly, & Anguelovski, Citation2019; Tamosiunas et al., Citation2014), and improves people’s physical and psychological health (Carter and Horwitz, Citation2014; Gascon et al., Citation2015), which is essential to the improvement of human well-being. There has, therefore, been considerable research into UGS. Previous studies have usually described UGS by number (Cetin, Citation2015; Zhang et al., Citation2020), distance (Dai, Citation2011), class (Wende, Zarger, & Mihelcic, Citation2012), size (Dai, Citation2011), quality (Zhang et al., Citation2020), among other characteristics. Because it is an important ecological infrastructure and a crucial provider of nature-based solutions, UGS has recently attracted increasing research (Dorst, van der Jagt, Raven, & Runhaar, Citation2019; Escobedo, Giannico, Jim, Sanesi, & Lafortezza, Citation2019; Qureshi, Kazmi, & Breuste, Citation2010; Wu et al., Citation2020).
The spatial patterns of actual utilization status may differ from the natural UGS stock because people may not fully utilize the existing UGS. As a result, some people who need UGS services cannot benefit from UGS provision, and this may result in a “green justice” issue (Wolch et al., Citation2014). Researchers generally use a post-occupancy evaluation (POE) method, based on questionnaires and interviews, to evaluate the actual utilization status of UGS (Wende et al., Citation2012). It is, however, difficult to describe actual utilization status because there are disputes about what to include in the evaluation. Researchers have tended to use multiple indicators for a comprehensive evaluation of UGS actual utilization status; for example, Wenda et al. assessed the actual utilization status of UGS, taking into account amenities offered (e.g. playground equipment, benches, exercise equipment, bathroom facilities) and assessment of overall maintenance (e.g. excellent, good, average and poor) (Wende et al., Citation2012). Limitations of data availability have meant that the traditional description of the actual utilization status of UGS has been limited to small-scale sampling surveys, which cannot provide large-scale panoramic analyses; and sporadic results cannot provide a comprehensive perspective for the public and decision-makers. The actual utilization status of UGS is closely associated with human needs and expectations (e.g. whether urban residents can obtain better UGS services). It is, therefore, important to make a comprehensive evaluation of the actual utilization status of UGS at a large scale. There has been a rise in the use of point of interest (POI) data – a type of social and economic big data – in recent years, and this has been widely used in spatial assessment research (Lu et al., Citation2020; Shi, Chang, Chen, Wu, & Yu, Citation2020; Yuan et al., Citation2020). The rich data that POI delivers may provide solutions to the above problems. Furthermore, numerous publications have reported rapid land use transformation and its driving forces in urban areas and peripheries in Chinese cities (Fan, Xu, Yue, & Chen, Citation2017; Song, Zenou, & Ding, Citation2008; Tian, Chen, & Yu, Citation2014). Insufficient attention has been paid to differences in the actual utilization status of UGS between intra-urban and peri-urban areas, though, and these differences may lead to disparities in residents’ ability to access UGS services.
Our main objective was to carry out a comprehensive evaluation of UGS use at a national scale based on big data analysis, and also to consider the differences in actual utilization status of UGS between intra-urban and peri-urban areas. We included 366 cities in mainland China to capture the full picture of the actual utilization status of UGS at the national scale. First, we combined the big data of POI and land use and cover change (LUCC) to construct three UGS indicators: stock, actual utilization, and actual utilization rate of UGS. Second, we calculated these indicators in city, intra-urban area, and peri-urban area. The city refers to the urban administrative area. The intra-urban area is the buffer zone with the urban built-up area as the center and 1 km radius. The area outside the 1 km buffer zone of the urban built-up area is defined as the peri-urban area. Finally, we explored the spatial patterns of these UGS indicators through hot spot analysis. Our study provided a new approach for rapid assessment of the actual utilization status of UGS at a large scale. The results contribute to the scientific optimization of China’s future UGS planning, and especially to the coordination of rational development and distribution of UGS resources between regions and neighboring cities.
2. Study area and data sources
2.1. Study area
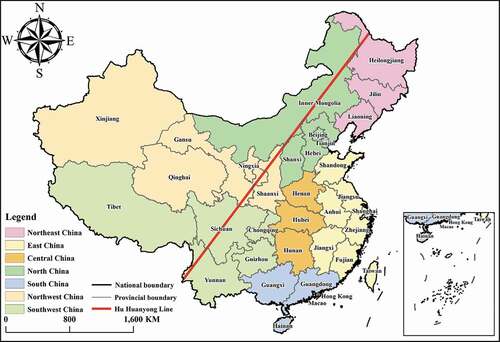
In this study, all the 366 cities in mainland China were selected as samples. The cities include 341 prefecture-level administrative units, 21 province directly administrating counties, and 4 provincial cities. China has seven geographical regions (). The Hu Huanyong Line indicates an important division of population density which divides mainland China into southeastern and northwestern regions (Chen, Gong, Li, Lu, & Zhang, Citation2016; Chen et al., Citation2019).
Figure 1. Locations of provinces and regions in China
2.2. Data
UGS data at a spatial resolution of 1 km × 1 km were extracted from the 2015 LUCC data set at the Data Center for Resources and Environmental Sciences, Chinese Academy of Sciences (RESDC) (http://www.resdc.cn) (). LUCC types included six categories and 25 subcategories (). Ecological land (e.g. forests, grassland, rivers/canals, reservoirs, snow and ice, lakes, beaches, and tidal flats) within the administrative boundary of a city were all regarded as UGS, in addition to the urban built-up area, rural settlement, other construction lands, arable land, and unused land. Our analysis found that UGS in mainland China covered 5,471,292 km2, accounting for 56.99% of the total area.
Figure 2. Areas in China covered by urban green space, 2015 (National Geomatics Center of China; http://ngcc.sbsm.gov.cn). Spatial scale 1:4,000,000
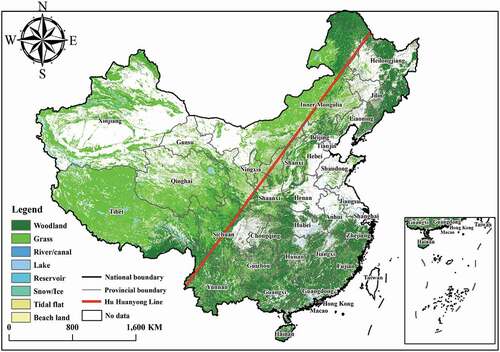
Table 1. Types of land use and cover change
We downloaded the POI of each Chinese city in 2015 from the Chinese web map service, AutoNavi Map (https://www.amap.com/). The POI data contained 44 layers () and 16,602,978 points. POI represents things in geospatial space, and each POI has four items of information: name, category, coordinate, and classification. We selected and extracted POI points that were closely related to the actual utilization status of UGS services (). We selected POI points related to the actual utilization status of UGS according to the following criteria. When there is UGS near to facility represented by POI, people will prefer to choose the facility. This is because people who use the facilities can access the UGS to get services, such as relieving stress, strengthening physical exercise, and UGS provides additional values for the facility. Therefore, we think the facility has used UGS services. If there are corresponding facilities nearby the UGS, we think the UGS has been used.
Table 2. Points of interest layers
Table 3. Points of interest related to the actual utilization status of urban green space
3. Method
3.1. UGS indicators
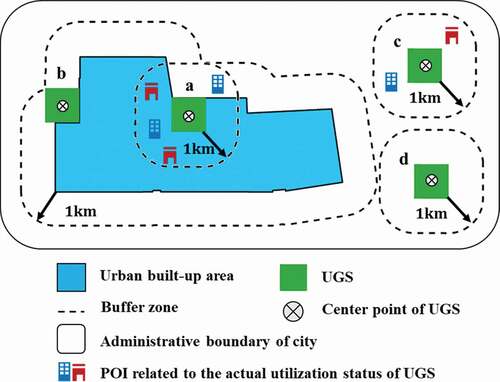
We combined LUCC data and POI big data and constructed three indicators for evaluating the actual utilization of UGS (). The first indicator was stock, which represented the total area of UGS within the administrative boundary of a city (i.e. the sum of areas a, b, c, and d in ). The second indicator was actual utilization, which represented the total area of UGS actually used in a city. We defined the UGS grid actually utilized as follows: a buffer zone with a radius of 1 km was generated surrounding the center of each UGS grid (1 km2). If any POI related to UGS actual utilization () was in the buffer zone, then the UGS grid was regarded as being actually utilized (e.g. ). , in contrast, indicate UGS that had not actually been utilized. We took 1 km is as the radius of the UGS grid buffer zone because it represented the distance accessible by a person walking daily for approximately 10 mins: this ensured good pedestrian accessibility between the UGS and the supporting facilities. The third indicator was actual utilization rate, which represented the actual rate of utilization of UGS in a city (i.e. in the percentage of sum of UGS a and UGS c in the sum of UGS a, UGS b, UGS c and UGS d). The ratio of the used UGS area and the total UGS area in each city was calculated to obtain the actual utilization rate indicator. In making this calculation, more than 5 million UGS grids were individually evaluated in ArcGIS10.5 using Python 2.7.3 programming.
Figure 3. Urban green space indicators for assessing actual utilization. (a) utilized intra-urban green space; (b) intra-urban green space not utilized; (c) utilized peri-urban green space; and (d) peri-urban green space not utilized
3.2. Differences in the utilization status of UGS in intra-urban and peri-urban areas
We first divided UGS into intra-urban green space (IUGS) and peri-urban green space (PUGS). A buffer zone with a radius of 1 km was constructed around urban built-up areas, and the UGS within the buffer zone was regarded as the IUGS (). The UGS outside the buffer zone and within the administrative boundary of the city was regarded as the PUGS (). We next calculated stock, actual utilization, and actual utilization rate for the two types of UGS. Finally, the differences in the actual utilization rate of IUGS and PUGS were compared to depict the spatial patterns of actual utilization status of UGS in intra-urban and peri-urban areas.
3.3. Spatial patterns of actual UGS utilization status in China
Hot spot analysis (Getis-Ord Gi*) is a spatial statistical method proposed by Getis and Ord (Giles-Corti et al., Citation2005) that can effectively identify cold and hot spots with statistical significance in space. The basic principle of hot spot analysis is to calculate the Gi* value of each spatial object, and to delimit the high and low clustering through the standard normal distribution. Both Z-score and p-value are used to measure the statistical significance and to judge whether to reject the null hypothesis. The Gi* statistic returned by each spatial object in the data set was the Z-score. For a statistically significant positive Z-score, as the Z-score increases, the clustering of high values becomes closer (“High–High” aggregation, hot spots). For a statistically significant negative Z-score, as the Z-score decreases, the clustering of low values becomes closer (“Low–Low” aggregation, cold spots). In this study, hot spot analysis was used to explore the spatial patterns of the actual utilization status of UGS, IUGS, and PUGS in China in 2015.
4. Results
4.1. Spatial patterns of UGS and its actual utilization in China
There was clear spatial heterogeneity in the stock of UGS among different cities in China in 2015 (). The spatial patterns of the stock indicator showed that the UGS resources in China were higher in the northwestern region indicated by the Hu Huanyong Line than in the southeastern region. The lowest stock value appeared in Luohe, Henan Province, which had a UGS area of 35 km2. The city with the largest UGS resources was Naqu, Tibet, with a UGS area of 322,442 km2, approximately 9,000 times greater than that of Luohe. The results of hot spot analysis showed that “High–High” aggregation of the stock indicator was mainly concentrated in northeastern Inner Mongolia, Tibet, Qinghai, and southern Xinjiang. “Low–Low” aggregation appeared in Shandong, Henan, Hebei, Anhui, Jiangsu, and Hainan ().
Figure 4. Spatial patterns of urban green space and its actual utilization at the city level in China
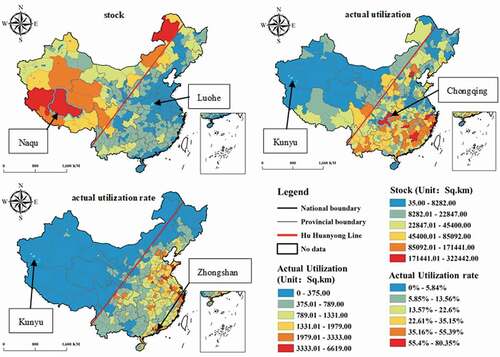
Figure 5. Hot spot analysis of urban green space and its actual utilization at the city level in China
A pattern of significant spatial mismatch was found between the stock and the actual utilization of UGS in China. The spatial distribution of the actual utilization indicator showed a pattern indicating that the value in the northwestern region indicated by the Hu Huanyong Line was lower than that in the southeastern region. The highest actual utilization value appeared in Chongqing (6,619 km2), while the lowest value appeared in Kunyu (0 km2), Xinjiang. The results of the hot spot analysis also showed that a hot spot of the actual utilization indicator appeared in southern China and northeastern Inner Mongolia. There was a certain overlap between the cold spot regions of stock with the actual utilization indicators. The cold spot areas of actual utilization mainly appeared in Hainan, Shandong, Henan, Anhui, northwestern Jiangsu, Heilongjiang, Inner Mongolia, Gansu, and Xinjiang. This indicated that the low actual utilization was, to some extent, due to the lack of UGS resources. We also found that unused UGS resources accounted for a very high proportion. Our results showed that the area of UGS actually utilized was approximately 327,747 km2 although the total area of UGS stock was 5,471,292 km2, and that the UGS actually utilized only accounted for around 6%.
The spatial pattern of the actual utilization rate was significantly different from the above two indicators. High values of the actual utilization rate indicator were mostly concentrated in eastern China: the highest value was 80.35% in Zhongshan, Guangdong, and the lowest was 0% in Kunyu, Xinjiang. The actual utilization rate of cities in China was generally low, with only 18 cities (accounting for 4.90%) reaching more than 50%. There were 253 cities with an actual utilization rate below 20%, accounting for 68.93% of the total. Hot spot analysis results clearly showed that hot spots were mainly concentrated in eastern China: Hebei, Henan, Shandong, Anhui, Jiangsu, Hunan, Hubei, Jiangxi, Fujian, and Guangdong. The cold spot area was large and mainly concentrated in northeastern, southwestern, and northwestern China, where there were considerable UGS resources.
4.2. Spatial patterns of IUGS and its actual utilization in China
The spatial distribution of IUGS stock and actual utilization indicators was similar at the city level (). The highest stock value of IUGS (701 km2) appeared in Hulunbeier, Inner Mongolia, while the lowest appeared in Shennongjia, Hubei; Kekedala, Kunyu; and Huyanghe, Xinjiang (0 km2). The highest actual utilization IUGS value (414 km2) appeared in Shenzhen, Guangdong, and the lowest in Shennongjia, Kekedala, Kunyu, and Huyanghe. The high values of these two indicators were mainly concentrated in southern and northeastern China. Hot spot analysis results showed that their spatial distribution was similar and mainly concentrated in southeastern China including Sichuan, Chongqing, Hunan, Zhejiang, Fujian, Guangdong, and Inner Mongolia. Their cold spot distribution was similar and mainly concentrated in Hainan, and central and western China. The spatial patterns of stock and actual utilization indicators were similar except in Hulunbeier, Inner Mongolia, where the actual utilization indicator did not show a hot spot ().
Figure 6. Spatial patterns of intra-urban green space and its actual utilization at the city level in China
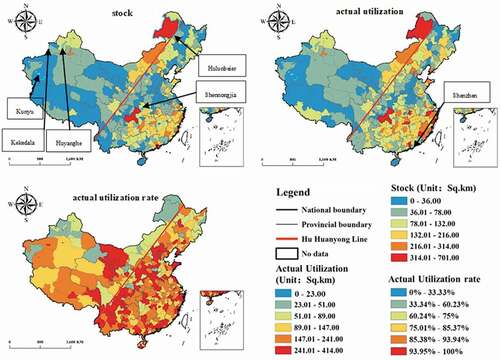
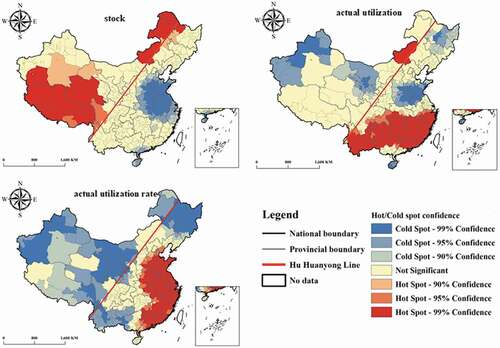
Figure 7. Hot spot analysis of intra-urban green space and its actual utilization at the city level in China
The actual utilization rate of IUGS in China was generally high and 77.66% of the cities reached more than 80%. In only 5.18% of the cities was the actual utilization rate below 60%. The spatial pattern of the actual utilization rate indicator was quite different from that of the two other indicators. The hot spots mainly appeared in southwestern China, including Yunnan, Sichuan, and Guizhou. There were also some hot spots in Hubei, Henan, northeastern Guangdong, south Jiangxi, and southwestern Fujian. The cold spots appeared in northeastern and southwestern China, including Heilongjiang, Inner Mongolia, northern Qinghai, and northwestern Xinjiang.
4.3. Spatial patterns of PUGS and its actual utilization in China
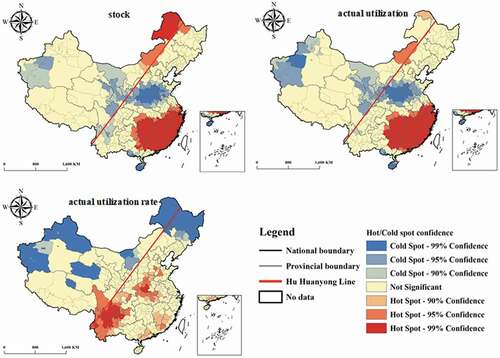
The spatial patterns of the three PUGS indicators were similar to those of the UGS. The stock indicator of PUGS in the northwestern region indicated by the Hu Huanyong Line was higher than that in the southeastern region (). The highest value also appeared in Naqu, Tibet, where it was as high as 32,242 km2; and the lowest value, which appeared in Luohe, Henan Province, was only 30 km2. The spatial pattern of the actual utilization indicator was lower in the northwestern region indicated by the Hu Huanyong Line than in the southeastern region. The highest actual utilization value appeared in Chongqing (6,245 km2), and the lowest in Kunyu (0 km2). High actual utilization rate values were also concentrated in eastern China, with the lowest value in Kunyu (0%) and the highest in Zhongshan (72.54%). The hot spot distribution of the three PUGS indicators was similar to that of the UGS, except for some differences in the confidence level of cold and hot spots in some cities ().
Figure 8. Spatial patterns of peri-urban green space and its actual utilization at the city level in China
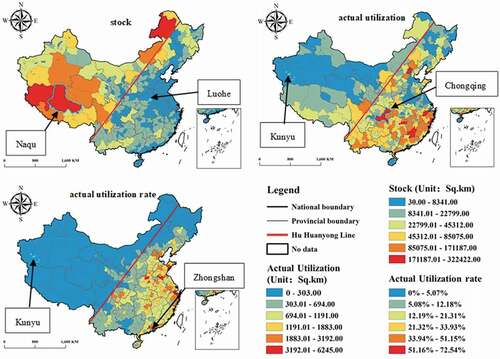
Figure 9. Hot spot analysis of peri-urban green space and its actual utilization at the city level in China

4.4. Spatial patterns of utilization differences between IUGS and PUGS
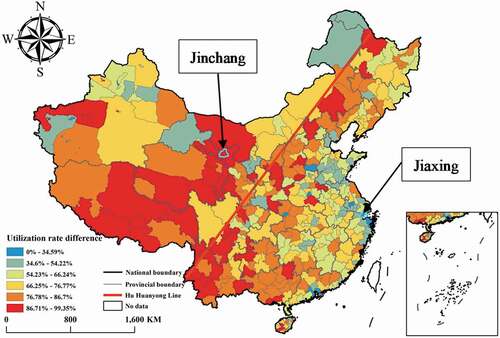
The differences in the actual utilization rate of IUGS and PUGS represent the differences in UGS’s actual utilization status between intra-urban and peri-urban areas. Low values were mainly in eastern China and high values mainly in western China (). Except for the zero value, the lowest value (26.30%) appeared in Jiaxing, Zhejiang, which meant that there was little difference in the actual utilization rate of UGS inside and outside the urban area in Jiaxing City. The highest value (99.35%) was found in Jinchang, Gansu Province, which indicated that PUGS were largely undeveloped. We found a difference of more than 60% in the actual utilization rate of IUGS and PUGS in 281 cities (76.57%). In 117 cities (31.88%) there was a difference of more than 80% in the actual utilization rate of IUGS and PUGS. The actual utilization of IUGS and PUGS in most cities was clearly different, and UGS utilization in peri-urban areas was, in general, behind that in urban areas.
Figure 10. The differences in actual utilization rates between intra-urban green space and peri-urban green space at the city level in China
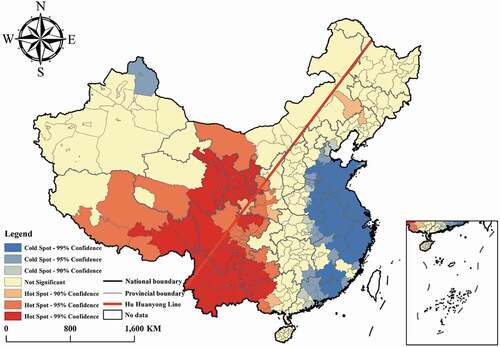
Hot spot analysis results showed that cold spots were mainly concentrated in eastern China (). There was little difference in the actual utilization rate of IUGS and PUGS in these areas. The hot spots mainly appeared in western China, including eastern Qinghai, Gansu, western Inner Mongolia, and Ningxia. In hot spot areas, the actual utilization of UGS in intra-urban and peri-urban areas was significantly different. PUGS had not been well utilized in China.
Figure 11. Hot spot analysis of actual utilization rate difference between intra-urban green space and peri-urban green space at the city level in China
5. Discussion
5.1. Advantages and shortage of UGS big data analysis
Our innovative evaluation combined POI and LUCC data to quantify the actual utilization status of UGS in all cities in mainland China, exploring the differences in intra-urban and peri-urban areas. Our method of analyzing big data has several advantages that suggest its general use will be beneficial. (1) It illustrates the actual utilization status of UGS because it uses only the presence or absence of supporting facilities as the measure of UGS utilization status. (2) It can overcome the limitations of data availability and quickly evaluate the actual utilization status of UGS to provide an overall, large-scale picture. (3) As POI and LUCC data are continuously updated, it can be further used to explore the dynamics of the spatial patterns of the actual utilization status of UGS. However, our method of analyzing big data also had some limitations. Our indicators may have underestimated the actual utilization of UGS resources because the POI may be an entrance to a large park or landscape that may extend beyond the 1 km buffer zone. Next, we only considered a walk of 10 mins to UGS as the radius of the buffer zone of the UGS grid. Urban residents, however, have several transportation options (e.g. cycling, driving, and public transport) and these imply several accessibility distances. Finally, in addition to the presence of supporting facilities around the UGS, more factors should be considered to evaluate the actual utilization of UGS comprehensively in future studies, such as the type and number of supporting facilities and the convenience of transportation for access to UGS.
5.2. Possible drivers of spatial patterns of actual UGS utilization in China
Our study clearly mapped and revealed the spatial mismatch pattern of the stock, actual utilization, and actual utilization rate of UGS in China. UGS in the northwestern region indicated by the Hu Huanyong Line had more stock but utilization was poor, while UGS in the southeastern region had less stock but utilization was good. We found that 94.01% of the UGS stock was not well developed, especially in the northwestern region indicated by the Hu Huanyong Line. The hot spots of UGS utilization were consistent with regions having high levels of social and economic development. The cold spots were concentrated in the less developed regions in western China. The UGS stock distribution pattern clearly indicates that the actual utilization of UGS was largely driven by the level of local social and economic development. Not all UGS, however, are suitable for development and utilization. For example, the actual utilization of UGS in state-owned forest farms and nature reserves is officially forbidden. The differences in the rate of actual utilization between IUGS and PUGS were small in eastern China but large in western China. This may have been due to imbalances in the urbanization of eastern and western China (Cao, Lv, Zheng, & Wang, Citation2014; Wang, Shao, & Li, Citation2019; Xiong et al., Citation2021). In eastern China, urbanization has entered a mature stage, with the integration of urban and rural development and little difference between urban and rural areas. However, in western China, urbanization has entered a stage of rapid development, and there is a considerable difference between urban and rural development. Furthermore, Major Function Oriented Zone planning and policy has a great impact on the spatial patterns of UGS utilization. Major Function Oriented Zoning is a guideline for optimizing the spatial patterns of regional development in China, and is based on each region’s different major functions (e.g. urbanization, industrialization, ecological construction, grain production, and protection of the natural and cultural heritage) (Fan & Li, Citation2009; Fan, Sun, Zhou, & Chen, Citation2012; Xia et al., Citation2020).
6. Conclusion
UGS is essential for urban development and human well-being, and the actual utilization of UGS is closely related to access to UGS services. Limitations in data availability have led to a lack of comprehensive evaluations of the actual utilization status of UGS at a large scale. Furthermore, the differences in the actual utilization status of UGS between intra-urban and peri-urban areas have not received enough attention. We combined POI big data from an online map service and LUCC data interpreted from remote sensing to analyze the spatial patterns of actual UGS utilization status. The spatial patterns of the three UGS indicators stock, actual utilization, and actual utilization rate of UGS of 366 cities in mainland China were calculated and mapped, revealing a complete picture at the national scale. We also explored the differences between the actual utilization status of UGS between intra-urban and peri-urban areas. We found that cities in China have great UGS resources but most were not well developed, and the proportion of unutilized UGS resources reached 94.01%. There was a clear spatial mismatch between the Stock and Actual Utilization of UGS, especially in the northwestern region indicated by the Hu Huanyong Line, where there was great development potential. The actual rate of UGS utilization was largely driven by the level of local economic development. The imbalance between urbanization in eastern and western China led to differences in actual UGS utilization between urban and peri-urban areas, which were small in eastern China but large in western China. In most cities, there was a significant difference in the actual utilization of UGS between intra-urban and peri-urban areas: UGS development in peri-urban areas was far behind that in intra-urban areas. Our study provides scientific information for decision-makers and planners and will promote a comprehensive understanding of the spatial patterns of UGS development in each city of mainland China. It will allow cities with mismatched UGS utilization and stock to be accurately identified, and promote appropriate UGS protection and utilization policies.
Data availability statement
The data that support the findings of this study are openly available in ScienceDB at https://doi.org/10.11922/sciencedb.j00076.00076.
Disclosure statement
No potential conflict of interest was reported by the author(s).
Additional information
Funding
Notes on contributors

Yiyi Huang
Yiyi Huang is a joint Ph.D. student of Xiamen University and Institute of Urban Environment, Chinese Academy of Sciences. He is currently working toward a Ph.D. degree in Marine Affairs at Xiamen University, China. His research interests include coastal and ocean management, urban ecology, environmental management and planning, and big data analysis.

Tao Lin
Tao Lin is a Professor at the Institute of Urban Environment, Chinese academy of sciences. His main research interests include urban ecology, environmental management, and planning, smart city, and big data analysis. Dr. Lin was a visiting scholar at Arizona State University, Central Arizona-Phoenix Long-Term Ecological Research. He has authored or co-authored more than 100 publications and his publications have appeared in Environment International, Environmental Pollution, Ecological Indicators, and so on. He has served as the Guest Editor of Remote Sensing, International Journal of Sustainable Development and World Ecology.

Guoqin Zhang
Guoqin Zhang is an Associate Professor of Urban Geography and Environmental Management in the Institute of Urban Environment, Chinese Academy of Sciences (CAS). He received his master degree from the Institute of Geographic Sciences and Natural Resources Research, CAS in 2007 and a Ph.D. degree from the Institute of Urban Environment, CAS in 2011. He has been working at the Institute of Urban Environment, CAS since 2007. Professor Zhang’s research interests include geography of urbanization, urban public services, urban metabolism, and environment. He has received several grants from the National Natural Science Foundation of China, the National Key R&D Program, and the Natural Science Foundation of Fujian Province, China. Professor Zhang has published 40 peer-reviewed journal articles (including 20 SCI papers) and has obtained 2 invention patents and 10 software registrations. He is currently the reviewer of a few international journals including Landscape and Urban Planning, Science of the Total Environment, Journal of Cleaner Production and et al.
Yongguan Zhu
Yongguan Zhu is a Professor in biogeochemistry and environmental soil science, and an Academician of the Chinese Academy of Sciences. Prof. Zhu obtained his Ph.D. degree in environmental biology from Imperial College, London in 1998. He is currently the Director for Education/Internationalization of the Institute of Urban Environment, Chinese Academy of Sciences (CAS). Prof. Zhu is a leader in taking multi-scale and multi-disciplinary approaches to soil and environmental problems, such as arsenic biogeochemistry and antimicrobial resistance. He is currently a Co-Editor-in-Chief of Environment International (Elsevier), and Editorial Members for a few other international journals. He is a scientific committee member for the International Science Council (ISC) program on Human Health and Wellbeing in Changing Urban Environment, and served for nine years as a member of Standing Advisory Group for Nuclear Application, International Atomic Energy Agency (2004-2012).

Zhiwei Zeng
Zhiwei Zeng received his B.A. degree in the School of Chinese Literature, Zhangzhou Normal University, China, in 2009 and received the B.B.A. degree in the School of Management, Xiamen University, in 2016. He is currently working toward a Ph.D. degree at the Institute of Urban Environment (IUE), Chinese Academy of Sciences (CAS), China. His research interests include sustainable urban systems, evaluation index systems of urban sustainable development.

Hong Ye
Hong Ye is currently a Professor of urban ecology science at the Institute of Urban Environment, Chinese Academy of Sciences (CAS). Professor Ye’s research mainly focuses on urban form, urban function, and their impacts on urban environmental problems, such as urban building energy carbon emission urban form driving mechanism and urban low carbon city green infrastructure construction approach. Prof. Ye obtained her Ph.D. degree from Peking University in 2007. She visited the University of California, Los Angeles in 2014 as a high-level research scholar. Prof. Ye is a member of the Chinese branch of the World Ecological Society Council. She is currently a reviewer for a few international journals including Environment International, Journal of Cleaner Production and et al. Prof. Ye has published over 60 papers in international journals, invented 4 patents and 13 software, and obtained more than 70 projects funded from the Ministry of science and technology, National Natural Science Foundation of China (NSFC), and local government.
References
- Bolund, P., & Hunhammar, S. (1999). Ecosystem services in urban areas. Ecological Economics, 29(2), 293–301.
- Cao, S. X., Lv, Y., Zheng, H., & Wang, X. (2014). Challenges facing China’s unbalanced urbanization strategy. Land Use Policy, 39, 412–415.
- Carter, M., & Horwitz, P. (2014). Beyond proximity: The importance of green space useability to self-reported health. Ecohealth, 11(3), 322–332.
- Cetin, M. (2015). Using GIS analysis to assess urban green space in terms of accessibility: Case study in Kutahya. International Journal of Sustainable Development and World Ecology, 22(5), 420–424.
- Chen, D., Zhang, Y., Yao, Y., Hong, Y., Guan, Q., & Tu, W. (2019). Exploring the spatial differentiation of urbanization on two sides of the Hu Huanyong Line -- based on nighttime light data and cellular automata. Applied Geography, 112, 102081.
- Chen, M., Gong, Y., Li, Y., Lu, D., & Zhang, H. (2016). Population distribution and urbanization on both sides of the Hu Huanyong Line: Answering the Premier’s question. Journal of Geographical Sciences, 26(11), 1593–1610.
- Chiesura, A. (2004). The role of urban parks for the sustainable city. Landscape and Urban Planning, 68(1), 129–138.
- Cole, H. V. S., Triguero-Mas, M., Connolly, J. J. T., & Anguelovski, I. (2019). Determining the health benefits of green space: Does gentrification matter? Health & Place, 57, 1–11.
- Dai, D. (2011). Racial/ethnic and socioeconomic disparities in urban green space accessibility: Where to intervene? Landscape and Urban Planning, 102(4), 234–244.
- Dorst, H., van der Jagt, A., Raven, R., & Runhaar, H. (2019). Urban greening through nature-based solutions – Key characteristics of an emerging concept. Sustainable Cities and Society, 49, 101620.
- Escobedo, F. J., Giannico, V., Jim, C. Y., Sanesi, G., & Lafortezza, R. (2019). Urban forests, ecosystem services, green infrastructure and nature-based solutions: Nexus or evolving metaphors? Urban Forestry & Urban Greening, 37, 3–12.
- Fan, J., & Li, P. (2009). The scientific foundation of major function oriented zoning in China. Journal of Geographical Sciences, 19(5), 515–531.
- Fan, J., Sun, W., Zhou, K., & Chen, D. (2012). Major function oriented zone: New method of spatial regulation for reshaping regional development pattern in China. Chinese Geographical Science, 22(2), 196–209.
- Fan, P. L., Xu, L., Yue, W., & Chen, J. (2017). Accessibility of public urban green space in an urban periphery: The case of Shanghai. Landscape and Urban Planning, 165, 177–192.
- Gascon, M., Triguero-Mas, M., Martínez, D., Dadvand, P., Forns, J., Plasència, A., & Nieuwenhuijsen, M. (2015). Mental health benefits of long-term exposure to residential green and blue spaces: A systematic review. International Journal of Environmental Research and Public Health, 12(4), 4354–4379.
- Giles-Corti, B., Broomhall, M. H., Knuiman, M., Collins, C., Douglas, K., Ng, K., & Donovan, R. J. (2005). Increasing walking - How important is distance to, attractiveness, and size of public open space? American Journal of Preventive Medicine, 28(2), 169–176.
- Graca, M., Alves, P., Gonçalves, J., Nowak, D. J., Hoehn, R., Farinha-Marques, P., & Cunha, M. (2018). Assessing how green space types affect ecosystem services delivery in Porto, Portugal. Landscape and Urban Planning, 170, 195–208.
- Hartig, T., Mitchell, R., de Vries, S., & Frumkin, H. (2014). Nature and Health. In J. E. Fielding (Ed.), Annual Review of Public Health, Vol 35 (Vol. 35, pp. 207-+). Palo Alto: Annual Reviews. doi:https://doi.org/10.1146/annurev-publhealth-032013-182443
- Lu, C., Pang, M., Zhang, Y., Li, H., Lu, C., Tang, X., & Cheng, W. (2020). Mapping urban spatial structure based on POI (Point of Interest) data: A case study of the Central City of Lanzhou, China. ISPRS International Journal of Geo-Information, 9(2), 92.
- Qureshi, S., Kazmi, S. J. H., & Breuste, J. H. (2010). Ecological disturbances due to high cutback in the green infrastructure of Karachi: Analyses of public perception about associated health problems. Urban Forestry & Urban Greening, 9(3), 187–198.
- Shi, K., Chang, Z., Chen, Z., Wu, J., & Yu, B. (2020). Identifying and evaluating poverty using multisource remote sensing and point of interest (POI) data: A case study of Chongqing, China. Journal of Cleaner Production, 255, 120245.
- Song, Y., Zenou, Y., & Ding, C. (2008). Let’s not throw the baby out with the bath water: The role of urban villages in housing rural migrants in China. Urban Studies, 45(2), 313–330.
- Tamosiunas, A., Grazuleviciene, R., Luksiene, D., Dedele, A., Reklaitiene, R., Baceviciene, M., & Nieuwenhuijsen, M. J. (2014). Accessibility and use of urban green spaces, and cardiovascular health: Findings from a Kaunas cohort study. Environmental Health, 13(1). doi:https://doi.org/10.1186/1476-069X-13-20
- Tian, L., Chen, J., & Yu, S. X. (2014). Coupled dynamics of urban landscape pattern and socioeconomic drivers in Shenzhen, China. Landscape Ecology, 29(4), 715–727.
- Wang, X., Shao, S., & Li, L. (2019). Agricultural inputs, urbanization, and urban-rural income disparity: Evidence from China. China Economic Review, 55, 67–84.
- Wende, H. E. W., Zarger, R. K., & Mihelcic, J. R. (2012). Accessibility and usability: Green space preferences, perceptions, and barriers in a rapidly urbanizing city in Latin America. Landscape and Urban Planning, 107(3), 272–282.
- Wolch, J. R., Byrne, J., & Newell, J. P. (2014). Urban green space, public health, and environmental justice: The challenge of making cities ‘just green enough’. Landscape and Urban Planning, 125, 234–244.
- Wu, X., Zhang, J., Geng, X., Wang, T., Wang, K., & Liu, S. (2020). Increasing green infrastructure-based ecological resilience in urban systems: A perspective from locating ecological and disturbance sources in a resource-based city. Sustainable Cities and Society, 61, 102354.
- Xia, H., Zhang, W., He, L., Ma, M., Peng, H., Li, L., … Wang, X. (2020). Assessment on China’s urbanization after the implementation of main functional areas planning. Journal of Environmental Management, 264. doi:https://doi.org/10.1016/j.jenvman.2020.110381
- Xiong, G., Cao, X., Hamm, N. A. S., Lin, T., Zhang, G., & Chen, B. (2021). Unbalanced development characteristics and driving mechanisms of regional urban spatial form: A case study of Jiangsu Province, China. Sustainability, 13(6), 3121.
- Yuan, G., Chen, Y., Sun, L., Lai, J., Li, T., & Liu, Z. (2020). Recognition of functional areas based on call detail records and point of interest data. Journal of Advanced Transportation, 2020, 1–16.
- Zhang, J., Yu, Z., Cheng, Y., Chen, C., Wan, Y., Zhao, B., & Vejre, H. (2020). Evaluating the disparities in urban green space provision in communities with diverse built environments: The case of a rapidly urbanizing Chinese city. Building and Environment, 183, 107170.