
 ?Mathematical formulae have been encoded as MathML and are displayed in this HTML version using MathJax in order to improve their display. Uncheck the box to turn MathJax off. This feature requires Javascript. Click on a formula to zoom.
ABSTRACT
The detection of informal settlements is the first step in planning and upgrading deprived areas in order to leave no one behind in SDGs. Very High-Resolution satellite images (VHR), have been extensively used for this purpose. However, as a cost-prohibitive data source, VHR might not be available to all, particularly nations that are home to many informal settlements. This study examines the application of open and freely available data sources to detect the structure and pattern of informal settlements. Here, in a case study of Jakarta, Indonesia, Medium Resolution satellite imagery (MR) derived from Landsat 8 (2020) was classified to detect these settlements. The classification was done using Random Forest (RF) classifier through two complementary approaches to develop the training set. In the first approach, available survey data sets (Jakarta’s informal settlements map for 2015) and visual interpretation using High-Resolution Google Map imagery have been used to build the training set. Throughout the second round of classification, OpenStreetMap (OSM) layers were used as the complementary approach for training. Results from the validation test for the second round revealed better accuracy and precision in classification. The proposed method provides an opportunity to use open data for informal settlements detection, when: 1) more expensive high resolution data sources are not accessible; 2) the area of interest is not larger than a city; and 3) the physical characteristics of the settlements differ significantly from their surrounding formal area. The method presents the application of globally accessible data to help the achievement of resilience and SDGs in informal settlements.
1. Introduction
Urbanisation involves uneven development with significant population shifts in a short space of time. Currently about 55% of the world’s population live in urban areas. The share for urban population will increase up to 60% until 2030. This will be more pronounced in developing countries, which will have the bulk of the world’s population growth – estimated at 95% – by 2030 (United Nations, Citation2018).
Urbanisation and unchecked population growth are putting a high demand for and pressure on housing and the available land. In developing countries, this trend takes the form of land-use change, informal land transactions, and the expansion of informal settlements (Lavigne & Durand-Lasserve, Citation2009). Informal settlements – otherwise known as slums – emerge as unplanned, illegal, and irregularly structured built-up areas with a distinct physical pattern of road networks and building sub-divisions within the city limits that do not have access to basic infrastructure and urban services (Mclaren, Coleman, & Mayunga, Citation2005).
Informal settlements might form as a consequence of rural-urban migration, which is called “inserting”. This type of living arrangement mainly grows in peri-urban areas (city fringes) and refers to the development that occurs on vacant lands (Dovey & King, Citation2011). Another type of settlement that is perceived and treated as being informal concerns the autochthonous villages that are surrounded by built-up areas during the urbanisation process. This type of informal settlement formation is called “settling”, which means living on unregistered and unbounded lands as a village (Counihan, Citation2017). During the urbanisation process, these villages are typically considered self-governing settlements. This results in the settlements being isolated and characterised by a lack of much needed metropolitan services and infrastructure.
The Asia-Pacific region is home to the world’s largest concentrations of urban slum populations and people living below the poverty line. Collectively, these settlements pose a major challenge for the attainment of sustainable development (UN-Habitat, Citation2015). Asia has the largest population of both types of informal settlements’ inhabitants with over 80% of slum dwellers in southern and eastern countries. Since the 1970s governments have implemented policies to limit the spread of informal settlements in these countries (Sweeting, Citation2017). Indonesia currently has 29 million informal settlement inhabitants who lack access to urban services (The World Bank, Citation2016). Since 1969, beginning with Jakarta, the largest city and the economic centre of Indonesia (Alzamil, Citation2018), upgrading the infrastructure in informal settlements has been undertaken under the Kampung Improvement Program (KIP). Informal settlements in Jakarta that are also referred to as “kampung” are of the settling type. They are urban villages in which millions of people live and work but are deprived of civic services (Garr, Citation1986).
Kampung areas, and informal settlements in general, are vulnerable to disasters due to poorly constructed houses and unsuccessful integration into an urban life style (Rumbach & Shirgaokar, Citation2017). As is the case in most areas of urban deprivation, Kampung areas are characterised by communities lacking access to services in times of extreme events (UN-Habitat, Citation2014). The current COVID-19 pandemic crisis has exposed the inequality and vulnerability of the urban poor due to the challenges of tracking and controlling the virus, access to healthcare services, transportation infrastructure, and water and sanitation (UN-Habitat, Citation2020). Considering the large number of inhabitants living in informal settlements and the high level of risk and vulnerability, monitoring these settlements is necessary if disasters are to be recovered from (Hofmann, Strobl, Blaschke, & Kux, Citation2008), and the COVID-19 pandemic is no exception.
So far, several frameworks have been proposed to monitor and quantitatively analyse the level of resilience in urban areas (for more details see (Assarkhaniki, Rajabifard, & Sabri, Citation2020)). In addition, in the last decade, global efforts have been made to manage urbanisation in order to improve resilience to ongoing changes and sustainability of development. This is because, despite the negative externalities of this process, it can act as a double-edged sword for the environment, social welfare and the economy, depending on how it is managed (The World Bank, Citation2000). The United Nation’s (UN) 2030 Agenda for Sustainable Development (United Nations, Citation2015d), the Sendai Framework for Disaster Risk Reduction (United Nations, Citation2015c), the Addis Ababa Action Agenda (United Nations, Citation2015b), the Paris Agreement (United Nations, Citation2015a), and the New Urban Agenda (United Nations, Citation2017) are among the efforts to manage urbanisation.
The 2030 Agenda, adopted by the UN in 2015, represents a set of 17 sustainable development goals (SDGs), 196 targets, and 231 indicators as a standard framework to measure and monitor sustainable development (UNSD, Citation2020; UNDP, Citation2016; Filho et al., Citation2019; United Nations, Citation2015c). This broadly followed framework to achieve sustainable development in all social, environmental, and economic aspects of all communities, has left informal settlements behind due to the lack of data (Jones, Citation2017). The main challenge is the paucity of statistical and census data in informal settlements. Here, the role of remote sensing is central to enable monitoring and planning of informal settlements in order to improve the lives of their inhabitants, aligned with the global efforts to reach sustainable development and get on track to achieve SDGs by 2030 (Mayunga, Coleman, & Zhang, Citation2007).
Generally, remote sensing and specifically satellite imagery has been widely used as an alternative source of data to monitor urban areas. In recent decades, the use of satellite imagery has been increasingly investigated to estimate urban population and density (Wang, Fan, & Wang, Citation2020; Lu, Jungho, Quackenbush, & Halligan, Citation2010; Hillson et al., Citation2019; Ogrosky, Citation1975; Dittakan, Coenen, Christley, & Wardeh, Citation2013), mapping land cover and land-use in urban areas (Carleer & Wolff, Citation2006; Gamba et al., Citation2007; Movia, Beinat, & Crosilla, Citation2016; Novack et al., Citation2003; Ouyang et al., Citation2011; Voorde, Van, William, & Canters, Citation2007), and also for tracking changes in the urban landscape (Volpi, Tuia, Bovolo, Kanevski, & Bruzzone, Citation2013; Zhang, Peng, & Huang, Citation2018; Lv, Liu, & Benediktsson, Citation2020). Remote sensing has also been used to detect informal settlements in urban areas, which is the first step to upgrade the most vulnerable communities (Fallatah, Jones, & Mitchell, Citation2020; Weir, McQuillan, & Francis, Citation2019).
1.1. Remote sensing data for detecting informal settlements
According to the UN, settlements can be defined as informal if they have at least one of the three following criteria: a) lack of security of tenure; b) deprivation of basic services and infrastructure; and c) housing that does not meet current planning and building regulations (UN-Habitat, Citation2013a). The first feature relates to the legal aspect of informal settlements, while the last two features consider the physical structures and can be examined using remote sensing data. For instance, the lack of quality roads that constitute a basic infrastructure can be observed in the satellite images.
Several efforts have been made to use remote sensing technologies and data, such as active sensors (Wurm, Taubenböck, Weigand, & Schmitt, Citation2017) and satellite imageries, to detect informal settlements based on their physical features (Du, Zhang, & Zhang, Citation2015; Dubovyk, Sliuzas, & Flacke, Citation2011; Hofmann et al., Citation2008; Mayunga et al., Citation2007; Owen & Wong, Citation2013). However, in almost all the efforts made so far to detect and map informal settlements, Very High Resolution (VHR) and High Resolution (HR) satellite imagery has been employed. One of the weaknesses of VHR/HR is that it is a very expensive source of data and might be not be available due to budget/funding shortages, especially in developing countries. Besides, despite the high cost and high accuracy of the informal settlements detection by VHR/HR, misclassification of formal areas as informal occurs in the results (Prabhu, Parvathavarthini, & Alagu Raja, Citation2021). The limitation associated with VHR/HR initiated the growing interest among researchers to use open data sources to detect informal settlements.
1.2. Open data for detecting informal settlements
Open data sources that have been used to detect informal settlements can be categorised to two groups: (1) open and freely available to public census and statistical data that are collected by governments and non-profit organisations through surveys, and (2) open spatial data including freely available Medium Resolution satellite imageries (MR) and OpenStreetMap (OSM). The second group of open data are mainly used to detect informal settlements based on their physical features.
Soman, Beukes, Nederhood, Marchio, and Bettencourt (Citation2020) have conducted street block analysis in 120 low and middle income countries to detect informal settlements based on the lack of public street access (Soman et al., Citation2020). The method relies on OSM data that can have different levels of accuracy in different countries. Mahabir et al. (Citation2020) have mixed the data from OSM and MR with open census and statistical data to identify the most suitable indicators, such as the level of vegetation, road type, etc., to detect informal settlements in the context of Kenya (Mahabir et al., Citation2020). However, informal settlement detection in this study has been conducted based on both physical and socioeconomic features that requires a high volume of data. Gram-Hansen et al. (Citation2019) has used Sentinel-2 to detect informal settlements. However, they have used VHR to enhance the accuracy of detection (Gram-Hansen et al., Citation2019). On the other hand, Verma, Jana, and Ramamritham (Citation2019) compared the performance of transfer learning model for detecting informal settlements on MR and VHR at the city scale. Their results showed unexpectedly high performance of MR in the detection of informal settlements and suggested further studies on ensemble methods in machine learning to enhance the classification accuracy (Verma et al., Citation2019). In this paper, we investigate the possibility of using open data, including MR and OSM, as a cost-effective and open-to-all approach to detect informal settlements at the city scale by applying machine learning methods.
1.3. Satellite image classification for informal settlement detection
Apart from visual interpretation, image classification is the most applied method for mapping the physical features of informal settlements using satellite imagery. Satellite image classification refers to the process of categorising the pixels of images to meaningful classes (Karlsson, Citation2003). There are generally two approaches for the classification: pixel-based classification (PBC) and object-based classification (OBC). PBC analyses the spectral properties of every pixel within an area of interest, without considering contextual information, such as shape (Makinde, Salami, Olaleye, & Okewusi, Citation2016). This approach does not produce accurate results when analysing VHR (Toll, Citation1984; Xia, Citation2007), which is due to the high spectral variability in VHR imagery. Greatly improving the quality and resolution of satellite images, OBC was introduced in the 1970s as an alternative way to classify VHR. OBC analyses objects rather than pixels by extracting homogeneous regions and incorporating contextual information (Ouyang et al., Citation2011) ().
Figure 1. Schematic comparison of Pixel-Based Classification (PBC) and Object-Based Classification (OBC). Top Row: on VHR, OBC more accurately detects vegetation, while PBC comprises mix pixels. Bottom Row: Spatial resolution and size of the pixels define either OBC or PBC can be more effective. Regarding MR, OBC is inefficient as a pixel contains more than one object, while PBC still detects vegetation (Source for the background satellite image: Google Earth Engine)
It is generally conceived that OBC produces more accurate results than PBC. However, the high accuracy can be achieved when classifying HR/VHR (Blaschke, Citation2010; Hofmann et al., Citation2008; Mayunga et al., Citation2007). In a comparative study on the accuracy of the classification of HR by OBC and PBC, Duro, Franklin, and Dubé (Citation2012) suggest that both classifiers perform well when applying similar machine learning algorithms (Duro et al., Citation2012). However, OBC has proved to be inefficient in analysing medium- and low-resolution satellite images, while PBC performs quite well (Blaschke, Citation2010; Makinde et al., Citation2016). This is because, as shown in , when decreasing the resolution every pixel might encompass more than one class (e.g. build-up and vegetation).
In several studies OBC has been used to detect informal settlements through HR/VHR classification based on defining a group of image-based proxies to differentiate land-use classes (Fallatah et al., Citation2020; Hernandez, Ruiz, & Shi, Citation2018; Hofmann et al., Citation2008; Ranguelova et al., Citation2019). On the other hand, PBC, that effectively classifies MR, has rarely been applied to detect informal settlements. Jain (Citation2007) has explored the application of PBC for this purpose. However, the analysis has been conducted on IKONOS data which is a type of VHR (Jain, Citation2007). Similarly, Kit, Lüdeke, and Reckien (Citation2012) applied PBC on QuickBird VHR data (Kit et al., Citation2012).
Here, as indicated earlier, PBC using machine learning techniques can enable highly accurate informal settlement detection on MR.
1.4. Pixel-based classification (PBC) using machine learning techniques
Several methods have been proposed to classify satellite images. These methods range from parametric (based on any assumptions about data distribution) algorithms such as maximum likelihood (Nilsson, Citation1965) to non-parametric machine learning algorithms, including decision tree (DT) (Brodley & Friedl, Citation1997; Pal & Mather, Citation2003), support vector machine (SVM) (Rodriguez-Galiano, Sanchez-Castillo, Chica-Olmo, & Chica-Rivas, Citation2015), k-Nearest Neighbors (kNN), artificial neural networks (ANN) (Rumelhart, Hintont, Hiinton, & Williams, Citation1986) as well as a combination of other classifiers that are referred to as ensemble classifiers, such as Random Forest (RF) (Breiman, Citation1996).
Among the classification methods, nonparametric machine learning algorithms are deemed to be more accurate, particularly for large-scale mapping. The algorithms demonstrate high capability in learning a large number of functional forms regarding the training data. This is due to not making any assumption about the data and underlying function (Rodriguez-Galiano, Ghimire, Rogan, Chica-Olmo, & Rigol-Sanchez, Citation2012).
Several studies have been conducted to compare non-parametric machine learning algorithms in terms of accuracy and effectiveness. Generally, with the exception of DT, which is found to be a less effective classifier with the tendency to overfit in, and having high sensitivity to the training data (Breiman, Citation2001), all other classifiers are similar in terms of accuracy (Dixon & Candade, Citation2008; Noi & Kappas, Citation2017; Pal, Citation2005). However, RF has several advantages over the rest (Rodriguez-Galiano et al., Citation2012; Teluguntla et al., Citation2018) that make it a better choice for land-use classification and more particularly informal settlement detection.
In comparison to other non-parametric algorithms, the RF algorithm is more robust due to minimal supervision and fewer user-defined parameters, less sensitivity to the training data, and faster analysis processing (Ming, Zhou, Wang, & Tan, Citation2016; Rodriguez-Galiano & Chica-Rivas, Citation2014; Rodriguez-Galiano et al., Citation2012; Teluguntla et al., Citation2018; Dixon & Candade, Citation2008; Noi & Kappas, Citation2017). For instance, ANN is sensitive to the number of hidden nodes; kernel parameters affect the accuracy in SVM; and accuracy in kNN depends on the ideal value of k, which is difficult to set (Dixon & Candade, Citation2008; Noi & Kappas, Citation2017). In addition, results from a study by Rodriguez-Galiano et al. (Citation2012) show that RF delivers more variety among different land-use/land cover classes than traditional classification approaches, such as a simple decision tree (Rodriguez-Galiano & Chica-Rivas, Citation2014). The differentiation among similar land-use classes is of great importance in the case of informal settlement detection. This is because categorising the similar land-use classes, such as formal and informal built-up areas is less manageable than the noticeably distinct ones (e.g. built-up zones and green spaces).
RF proposed by Breiman (Citation2001) is a classifier comprising a collection of (K) independent random tree-structured classifiers (or decision trees) , where is the input data and
denotes a family of identical and independently distributed random vectors (Breiman, Citation2001). To classify a pixel, RF will assign the pixel to the land cover class that receives the most votes from all the trees in the ensemble (Hermosilla, Wulder, White, Coops, & Hobart, Citation2018) ().
Figure 2. Random forest algorithm’s schematic function in image classification. The classifier consists of a collection of individual trees. Each tree independently offers a class prediction. The class with the most votes becomes the model prediction for image classification
1.5. Methods for developing the training set and the application of open data
The most traditional method for developing the training set is in situ data collection. This method, in addition to being considered time-consuming, is also cost-prohibitive for large areas (Zhou, Okin, & Zhang, Citation2020). One common replacement for this approach is using the available databases as the training input, including existing land classification maps or the survey data. In a recent study by Campos-Taberner et al. (Citation2020), the classification samples originate from in situ surveys provided by the regional government of Valencia in Spain (Campos-Taberner et al., Citation2020). Similarly, Zhu et al. (Citation2016), used the Land Cover Trends (LCT) data produced through the most recent Geological Survey of the US as the training sample (Zhu et al., Citation2016). Although this method relies on highly trusted training input and is a good replacement for in situ data collection, the data might not be available for all areas and purposes.
New era of increasingly available data, open data, provides the opportunity to find a more accessible replacement data source for developing the training set. Here, determining how to benefit from the freely accessible data is crucial. Building the training set based on visually interpreting higher spatial resolution images available in open access platforms, such as Google Earth (https://www.google.com/earth/) and Bing (https://www.bing.com/maps), is one of the common uses of open data (Pontarollo & Mendieta Muñoz, Citation2020). However, the visual interpretation method relies on expert comprehension and might be accompanied by human error.
As a recent approach, Volunteered Geographic Information (VGI) (Goodchild, Citation2007) has been used for developing the training set. One of the most popular VGI initiatives is OSM. OSM is a collaborative project to develop open spatial data worldwide that provides data layers in editable formats, such as shapefile, for further analysis and exploration. Depending on the areas of interest, different data layers might be available on the OSM website (https://www.openstreetmap.org/), such as roads, trails, buildings, etc, which is one of the limitations of using OSM. In addition, its accuracy has widely been questioned as OSM offers a collaborative and editable data source. In response, some case studies have shown that the accuracy of OSM is comparable to those of authoritative sources (Haklay, Citation2010; Jokar Arsanjani, Helbich, & Bakillah, Citation2013). However, in general, OSM suffers from the heterogeneity in inaccuracy from one location to another and among different data layers (Estima & Painho, Citation2015). Therefore, if this type of data is to be relied on, it is essential to carry out data validation.
Literature indicates that OSM has been used in the machine learning supervised land-use and land cover classification (Forget, Linard, & Gilbert, Citation2018; Jokar Arsanjani et al., Citation2013). Forget et al. (Citation2018), used OSM to detect built-up areas in sub-Saharan African cities on Landsat images (Forget et al., Citation2018). Nevertheless, in this practice, OSM has not been used to classify different types of built-up areas such as formal and informal with low intra-class differences. Jokar Arsanjani et al. (Citation2013) used OSM to classify diverse built-up areas, such as low density, medium density, and high-density urban fabrics (Jokar Arsanjani et al., Citation2013). However, they apply the classification on Rapid-Eye images with spatial resolution of 6.25 m which is much higher than the resolution of Landsat 8.
Since different types of built-up areas such as formal and informal settlements or infrastructure (e.g. road network) appear to be very similar in MR, this study is initially aiming to examine the usage of OSM for this sensitive classification. In the next step, the accuracy of the informal settlement detection with and without OSM will be compared to outline which approach is more efficient. The results from this study will contribute to the facilitation of informal settlements detection, particularly in developing countries by using free and accessible open data. Since informal settlements detection is the initial step for monitoring and upgrading urban life in informal areas, this study will also help city planners and policymakers to develop more sustainable cities and communities.
2. Materials and methods
2.1. Study area & data collection
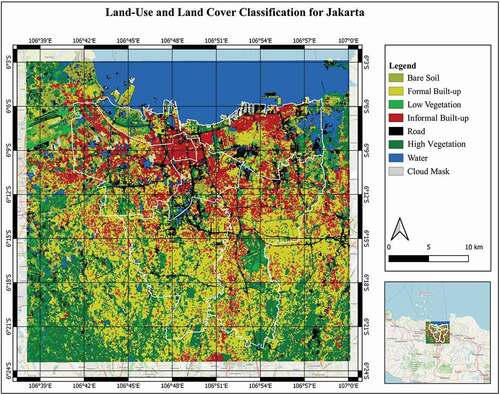
This study selected Jakarta as a case study to explore the application of open data for the detection of informal settlements (). Jakarta, the capital city since Indonesian independence in 1945 (Garr, Citation1986), is located on the island of Java. Indonesia is the world’s fourth most populous country (Counihan, Citation2017). With a population of more than 10 million in 2020, Jakarta is the most populated city in Indonesia and the world’s 10th most populated metropolitan area (Statistics Indonesia- Badan Pusat Statistik (BPS), Citation2020).
Jakarta’s particular importance, apart from its population, comes from its strategic role as the economic hub of Indonesia and it is where the financial and business sectors operate (Rukmana, Citation2008). According to the Indonesia’s Central Bureau of Statistics’ (BPS-Statistics Indonesia, Citation2005), Indonesia’s GDP of the financial and business sector in 2005 was 146.3 trillion rupiahs, 62.1% of which accounted for Jakarta. Despite the social and economic importance of Jakarta, this city is also characterised by being dangerously exposed to flooding disaster and the most vulnerable areas are informal settlements (Kampungs) (The World Bank, Citation2011). The first step for upgrading Jakarta’s informal settlements is mapping this deprived areas.
Figure 3. Study areas. Small rectangles numbered from 1–6 represent 2.4 km2 sample areas for the visualisation and the magnification of the results
To detect kampung areas in Jakarta, we obtained Landsat 8 images that is freely available to the public. Landsat 8 images are multi-spectral data with 11 spectral bands, five of which (bands 1–4 and 8) are visible. The satellite offers seasonal mapping of the entire globe at a spatial resolution of 30 meters for most of the bands (U.S. Geological Survey, Citation2016). We downloaded Landsat 8 images for the study area taken on 24/5/2020 from the Copernicus Open Access Hub (https://scihub.copernicus.eu/). The acquired images were cloud-free as May is the start of the dry season in Indonesia.
In this study, for classification of land-use and land cover, seven bands including visible, near infrared, and shortwave infrared band are used. The bands include: band 1-coastal aerosol, band 2-blue, band 3-green, band 4-red, band 5-near infrared (NIR), and bands 6 & 7-shortwave infrared (SWIR), all with a resolution of 30 meters. Omitted bands with irrelevant applications include band-8 which is a panchromatic band with a resolution of 15 m. It is used for sharpening and visualisation purposes, as well as the thermal and atmospheric bands (9–11) (Loyd, Citation2013).
For training purposes, we obtained the most recent informal settlement map in Jakarta created in 2015 () (The World Bank, Citation2015). We also collected the OSM data for Jakarta from OpenStreetMap Indonesia (https://openstreetmap.id/en/dki-jakarta/). For Jakarta the street, governmental boundaries, and building blocks were available data layers at the time of data collection. Later, we used both survey data and OSM layers for the detection of informal settlements in Jakarta on medium quality satellite images (Landsat 8).
Figure 4. Informal settlements of Jakarta adapted from a map produced in 2015 (The World Bank Citation2015)
2.2. Methods
In this study, we detect Jakarta’s informal settlements on Landsat 8 applying the Random Forest algorithm(RF). As indicated in section 1.4, the RF algorithm is robust as it requires few defined parameters and highly accurate results can be achieved through the default parameters (Duro et al., Citation2012; Zhang & Roy, Citation2017). However, the number of trees (ntree) and the number of variables (mtry) are the parameters that have been set. The ntree is 100 in the default setting and the mtry is the square root of the total number of bands in the image data. In this study, testing a range of values for the two parameters concluded that ntree of 200 and mtry of 2 gives the highest accuracy.
Despite the advantages of RF over other non-parametric algorithms (e.g. kNN, SVM, and ANN, the algorithm), it can still produce overfitting. To cope with the possible overfitting issue and enhancing the accuracy, choice of training method is more important than the algorithm (Abdi, Citation2020; Foody & Arora, Citation1997). Hence, in this study, two complementary training approaches have been applied and the results have been compared. Another factor to reduce overfitting is the sample size. The training sample should be relatively large enough (concerning the area of interest). It is recommended that to reach high accuracy the training sample should cover approximately 0.25% of the total study area (Noi & Kappas, Citation2017) that has been followed in this study. Despite the considerations, overfitting might still happen that will be discussed, and possible solutions will be proposed in section 4.
Through the first approach, two methods have been applied for developing the training set. First is the traditional method of using available databases, such as survey data and available maps (Campos-Taberner et al., Citation2020), while the second involves the visual interpretation method using freely available VHR Google Map Imagery (Pontarollo & Mendieta Muñoz, Citation2020). In the latter approach, the application of OSM, as a complementary source of data, for developing the training set has been tested ().
Figure 5. Overview of the procedure followed to detect informal settlements using medium resolution satellite images (MR), OpenStreetMap (OSM) and random forest machine learning algorithm (RF)
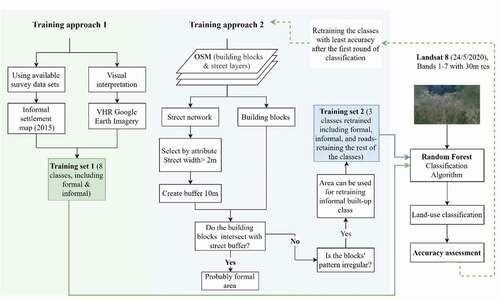
First approach for training: Initially, the informal settlements map for Jakarta (2015) (The World Bank, Citation2015) was used as a reference to develop the training set for the informal built-up areas. Although the 2015 map for the informal settlements in Jakarta is not very recent, based on a review of the slum upgrade programs in Jakarta, changes in the settlements have been mainly practical rather than physical. This includes the provision of basic infrastructure such as sanitation rather than relocating the settlements, reconstructing the houses, and changing street patterns (Pangeran & Akbar, Citation2020).
Considering the insubstantial reduction in the extent and location of informal settlements since 2015, the 2015 map can be relied on for the purpose of this study. However, possible alterations should be considered while selecting the training points to minimise training errors. For this purpose, VHR from Google Earth 2020 for Jakarta has been used as a base map on which a transparent layer of informal settlements polygons detected in 2015 has been overlaid. VHR Google Earth has been used to visually interpret the differences between the informal settlements in 2015 and the same areas in 2020. In a few cases, the areas mapped as informal settlements in 2015 had a regular pattern of building blocks and streets in the 2020 Google Earth image. These areas which might be upgraded or rehabilitated have been excluded when developing the training sets.
After selecting 120 training points for informal built-up areas, to obtain the highest level of accuracy, seven other classes of land-use, each containing a similar number of samples were developed using the same visual interpretation method relying on VHR Google Earth layer as the base map. The higher number of classes increases the depth of the decision tree and leads to higher accuracy (Breiman, Citation2001). Overall, a training sample of 960 points in eight classes was developed ().
Table 1. Proposed classes for the classification of Landsat 8 in Jakarta
Second approach for training: In the next approach for training, OSM layers of building blocks and roads have been used to develop the training set for the “formal build-up”, “informal build-up”, and “road” classes. Due to uncertainty about the OSM accuracy, using the detailed data attributes of OSM, such as the type of material used in building blocks, can be very challenging. In this study, OSM has been used only to extract the physical patterns of built-up areas and the only attribute that we have relied on relates to the road network which, according to a recent survey, is one of the most complete and reliable data layers (Barrington-Leigh & Millard-Ball, Citation2017). Here, the selected training points using OSM layers have been double-checked using high-resolution Google Map imagery.
The application of OSM layers for developing the training set in order to detect informal settlements depends on the context and physical characteristics of the area of interest. Hence, the first step would be defining the physical features of informal settlements in the study area. Later, it can be decided which OSM layers can best reflect the features.
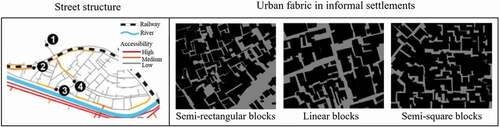
In Indonesia, car ownership is not common among Kampung inhabitants due to their ever-present financial difficulties. Therefore, streets in Kampung areas are very narrow and mainly suitable for pedestrians or motorcycles (Hidayati, Yamu, & Tan, Citation2020). In a study of informal settlements in Jakarta, Alzamil (Citation2018) describes the internal roads as “very narrow, winding, and non-paved” in which emergency vehicles cannot commute (Alzamil, Citation2018). In a similar study, Hidayati et al. (Citation2020) have shown that streets with a width of 2 meters or less are an indication of informal settlement (Hidayati et al., Citation2020) ().
Although the lack of roads or narrow streets with at most 2-meter width is a good indication for informal settlements, such roads might also be found inside the formal built-up areas. Therefore, here the urban fabric of informal settlements has also been considered as the second indication. The fabric can be analysed by the geometry of housing and alleyways (Suhartini & Jones, Citation2020). Geometric order in the urban fabric refers to the regular and hierarchal street patterns as well as the consistent building placement and block patterns (Rubinowicz, Citation2000). Conversely, informal settlements are generally described as irregular forms shaped by residents who do not follow any planning process (Alzamil, Citation2018), with diverse housing patterns comprising different block sizes and shapes (Jones, Citation2019).
Suhartini and Jones (Citation2020), in a study of informal settlements in Indonesia, argue that the outcome of this self-organisation of the space is a disorder or self-made urban order that is organic with a variety of housing sizes and styles within a settlement (Suhartini & Jones, Citation2020). Similarly, Alzamil (Citation2018) describes the fabric of informal settlements in Indonesia as a wavering distribution of blocks that are irregular and tend to be semi-rectangular, linear, or semi-square (6) (Alzamil, Citation2018).
Based on the review of studies conducted on physical features of informal settlements in Jakarta, key features can be described as: a) narrow streets with 2-meter width or less, and b) lack of uniform size and pattern of buildings. After defining the key physical features of informal settlements in Jakarta, the available OSM layers have been reviewed to select those that can best reflect these two features. For Jakarta, the road layer in OSM provides the data for road hierarchy in which roads of less than 2-meter width can be selected.
For reflecting the housing features and fabric of the settlements, building block layers have been used to serve as the secondary data layer for developing the training set.
Figure 6. Left: Street structure in informal settlements in Jakarta. Numbers 1–4 represent the entry points to the informal settlements with no car accessibility (Source: Hidayati et al., Citation2020), Right: Urban fabric in informal settlements (Source: Alzamil, Citation2018)
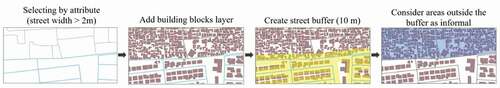
For sampling informal built-up areas using OSM, shapefiles of the building blocks layer and street layer from OSM were imported into QGIS. To perform the sampling based on the physical characteristics of the informal settlements, the selection by attribute function was initially conducted on the street layer to pick wide streets (streets width > 2). Later, a buffer zone was created with the distance of 5 meters since the highest street width measured in Jakarta was 9.8 meters. Next, the building at the intersection of the wide streets’ buffer has been chosen as the formal block. Finally, we inversed the selection to pick informal building block ().
After selecting the informal building blocks based on lack of access to wide streets, they have been visually checked for the second criterion. Here, the regularity and geometry of areas that have been selected as informal were visually checked and the errors were manually resolved. For instance, some building blocks with a regular structure were selected as informal since width attribute was not defined for them. These blocks have been manually removed from the informal area selection. After finalising the layer for informal areas, it has been used as the secondary data layer for training.
Figure 7. Using OpenStreetMap (OSM) for developing the training set for the informal built-up class. The blue areas represent the building with no access to a street or access to narrow streets that have been used to select pixels for informal settlements (Source for data layers: OpenStreetMap)
In the second round of developing the training set, after analysing the OSM layers as explained earlier, 120 samples for “road”, “formal build-up” and “informal build-up” classes were redefined. We retained the samples for other classes from the first round.
To validate the results, due to the literature (Wang, et al., Citation2020; Gram-Hansen et al., Citation2019) and the consideration of our data size, 80% of each class were randomly selected and set as training data and the remaining 20% constructed the test set. To evaluate the performance a confusion matrix was developed and it comprised true positive (TP), true negative (TN), false positive (FP), and false negative (FN) that are later used to calculate accuracy and precision (Lu et al., Citation2004):
After the classification is finalised, post-processing has been performed and the obtained map from both rounds of classification have been filtered for better visualisation (Khorram, Nelson, & Cakir, Citation2013). Here, a median filter with a 5-pixel by 5-pixel window kernel was applied to the classified images to reduce noise and filter isolated pixels.
3. Results
In this section, the results from the first and second round of the classification along with accuracy assessment results will be presented. represents the first round of land-use and land cover classification using supervised RF on Landsat 8. Validation results for the proposed RF machine learning classification results can be found in .
Table 2. Confusion Matrix of RF for the first round of classification. Least accuracy and precision relate to formal built-up in which mainly roads and informal built-up have been wrongly classified as formal
The land-use classification in represents a very close combination of formal and informal settlements in Jakarta. However, formal built-up areas are mostly located in the north and central Jakarta, while informal settlements are mainly detected in west, east, and south Jakarta (). The validation results in show that the lowest level of precision and accuracy relates to formal settlements. Based on the table, informal built-up areas and roads have been mainly misclassified as formal built-up. This outcome suggests that the accuracy and precision of the classification might be improved by upgrading the training process for these three layers.
Figure 8. First round of land-use and land cover classification on Landsat 8
In the next step, the second-round training set has been developed by retraining the roads, informal built-up, and formal built-up classes using OSM layers. The resulting map from the second round of land-use classification is presented in .
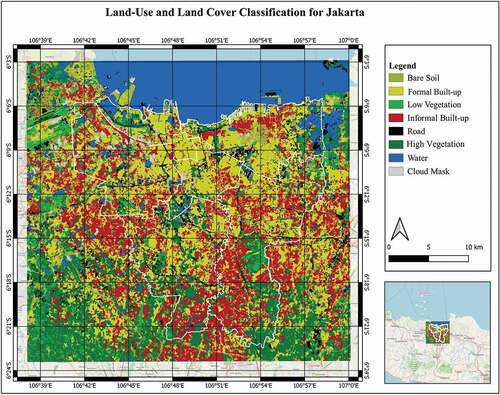
Figure 9. Second round of land-use and land cover classification on Landsat 8 using OSM for developing the training set
The map highlights a significant change in the detected formal and informal areas where the former are mainly focused on south and east Jakarta. In the second round of classification, informal settlements are mainly detected in the west, central, and eastern areas of Jakarta ().
The validation results for the second round of classification calculated by the RF machine learning algorithm is presented in . Based on the table, the accuracy and precision for all three retrained classes have increased. The enhancement is particularly noticeable in the formal-built up class with the increase in precision from 0.58 to 0.79 and the increase in accuracy from 0.88 to 0.94.
Figure 10. Informal (in red) and formal (in yellow) settlements detected in Jakarta. 1. Classification by RF machine learning algorithm through the traditional method of training. 2. Classification by RF which takes advantage of OSM for developing the training set
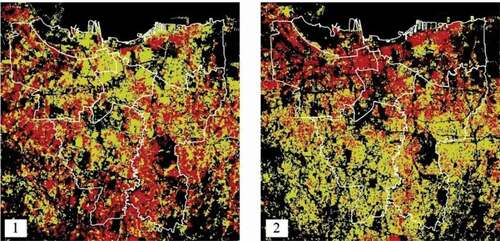
Table 3. Confusion Matrix of RF for the second round of classification
4. Discussion
Informal settlements are among the most challenging areas for conducting fieldwork due to the lack of security or access. This has resulted in leaving these settlements undocumented and overlooked on official maps (Kamalipour, Citation2020). Many studies have suggested the application of VHR to detect and map informal settlements (Fallatah et al., Citation2020; Persello & Stein, Citation2017). However, VHR is, as stated earlier, very expensive and might not be accessible to all.
In this study, the application of MR for the detection of informal settlements by Random Forest classifier has been tested through two complementary approaches. In the first one, similar to what many studies have done, sampling is achieved by visual interpretation and available survey data. In the second approach, training samples have been improved by using OSM. The results showed a higher level of accuracy and precision in informal settlement detection in the second round when OSM was used as a secondary data source for developing the training set.
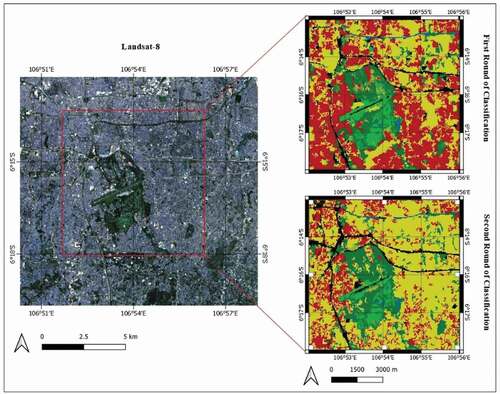
The confusion matrix for the first round of classification () shows that the least accuracy and precision relates to the formal built-up class. Here, mainly roads and informal built-up pixels have been wrongly detected as being formal. In the second round of classification, resampling has been undertaken for the problematic classes, including roads, formal built-up and informal built-up. Results from the second round of classification confirmed a particularly high level of accuracy classification for these three layers (). For instance, the accuracy and precision for the class of “roads” has increased, respectively, from 0.88 and 0.60 () to 0.95 and 0.81 (). This significant boost in both ACC and PPV is also evident in the classified maps, as roads in the second round of classification are more continuous and represent less noise ().
The enhancement has been achieved by reducing visual interpretation errors. In the case of Jakarta, the OSM layer for roads contains the data attribute for the street width. This feature enables the use of the hierarchy of the roads network to pick samples for the roads with higher width in which the central point most likely contains a homogeneous pixel. However, it is very difficult and time-consuming to consider the width of streets during the sampling process through the visual interpretation. As a result, narrow streets might be chosen in which the selected pixels include the tunes of other classes such as vegetation or built-up.
OSM data layers also enhanced the classification of formal and informal built-up areas in the second round of classification. As can be seen in , informal settlements detected in the first round of classification are more dispersed and mainly located in the south of Jakarta. Conversely, the informal settlements detected in the second round by using OSM are more clustered and focused in the northern areas. The most recent informal settlement map in Jakarta created in 2015 (Bank, Citation2015) (see ) also supports the accuracy of the results mapping the most informal settlements in the northern areas. Nevertheless, one limitation of this method is its dependence on the availability of the OSM layers and comprehensiveness of the data attributes for the area of interest (Estima & Painho, Citation2015).
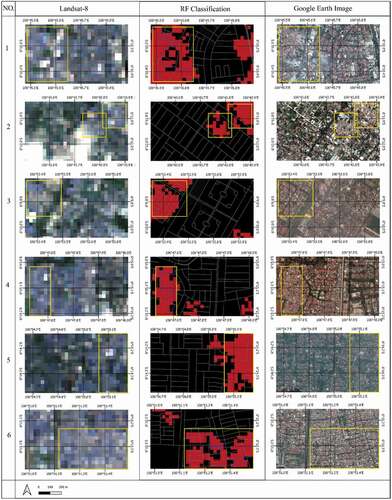
According to the results from the second round of classification, urban areas with small building blocks and narrow streets in between were effectively detected and mapped as informal settlements (Numbers 1–3, 5, and 6, ). The detected areas fit in the simple definition for slums or informal settlements that are “heavily populated urban areas characterised by substandard housing” (UN-Habitat, Citation2007). However, in some poorly developed or deprived areas, both formal and informal settlements might be similar in terms of structural features, such as the size of building blocks and the width of streets. In this case, OSM does not enhance the satellite image classification. Conversely, it might compromise the classification result if the training data is only developed based on the structural features guided by OSM. This is because additional factors should also be considered when developing the training set. For instance, formal settlements might have been built with stronger materials that create different colour compositions on the satellite image. By ignoring the housing quality and rooftop material in the training step, all the settlements might be selected as the training points for one class.
Figure 11. Comparison between the roads detected in the first and second round of classification (roads are mapped as black lines). Roads in the first round of classification are not continuous and represent some noise. Unlike the first-round results, street lines in the second round are mainly unbroken and demonstrate a high level of precision that is represented in
Although this can be considered as a limitation of applying OSM, it can be dealt with by experts who conduct a precise visual interpretation. This finding supports two points regarding the detection of informal settlements through satellite image classification: firstly, the importance of the rigorous sampling that has also been emphasised in previous research (Abdi, Citation2020) by considering all the physical and structural features; and secondly, the potential of using OSM to enhance the diligence of sampling when clear structural differences exist between formal and informal settlements.
In Jakarta, in some areas, the structures of formal and informal settlements are significantly different. These areas are well categorised in the second round of classification. In , samples numbers 1, 2, 4, and 5 represent how the clusters of red pixels (informal settlements) match with visually noticeable irregular built-up areas in VHR Google Earth Image. This suggests that, despite the medium spatial resolution of Landsat 8, the RF algorithm with the help of OSM can perform effectively for the detection of informal settlements.
Conversely, in the case of the complex mixture of formal and informal settlements in the urban fabric (Number 6, ), accurate detection of the informal settlements is not achieved. This is because the two classes are intricately interwoven and they do not produce recognisable colour composites on Landsat 8. In addition, in some areas (Number 3, ) the formal built-up has been selected as informal. From the visual comparison of informal areas detected in FR classification and the pattern of built-up areas in VHR Google Earth Image, it can be inferred that this might be due to the similarity between the colour composite of the pixels in both settlements.
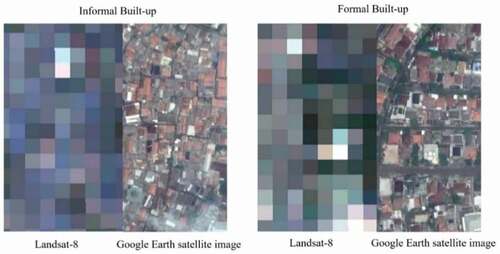
In Jakarta’s informal settlements, roofs are mainly built of grey shaded material (The World Bank, Citation2015). In addition, home blocks are very close to each other without noticeable trees or vegetation (UN-Habitat, Citation2013a). These physical features produce a specific colour composite on Landsat 8 pixels that is more blue and grey. Conversely, the colour composite is more green and brown in the formal built-up areas due to the availability of more green space and type of roofing material (). The formal areas detected wrongly as informal in RF classification demonstrate similar features with a grey shade for roofs and no vegetation (Number 3, ). This similarity, which can be observed in high density urban areas, can be misleading for the algorithm, particularly when classifying medium resolution satellite imagery.
Figure 12. Sample areas (Nos. 1–6) for magnification of the informal settlement detection by RF
Generally, while OSM can boost the detection of structurally distinctive informal settlements, it might deteriorate the classification results if additional physical features, such as the rooftop materials, are ignored during the training time.
Apart from the misclassification and overfitting issues in some areas, the resulting map is also noisy with several dispersed points selected as informal settlements. This is due to the relatively lower level of precision in comparison to accuracy. ACC refers to the level of trueness or bias, which indicates how close the average value of the results is to the true value. On the other hand, PPV shows the noise that ends up as a random component (Lu et al., Citation2004). Given the concept and application of ACC and PPV, several isolated pixels detected in both round 1 and 2 of classification can be omitted. Furthermore, the clusters can be a better representative for informal settlements.
This result suggests that although RF has proven to be effective in the differentiation between similar classes (Rodriguez-Galiano & Chica-Rivas, Citation2014), misclassification can also be observed when applying the algorithm on MR to divide built-up areas into formal or informal settlements. The presented method enhanced the accuracy of the informal settlements when applying RF on Landsat 8. However, due to the diversity of the physical characteristics of the informal settlements, one method will not be applicable to all areas. The application of the presented method will be limited to the areas where formal and informal settlements encompass distinctive structure, pattern, and physical features, such as roof materials. In this study, the training points were developed based on available data sources (2015 Jakarta’s informal settlements map) which should be replaced with visual interoperation in cases where there is no current evidence. Visual interpretation is a process that takes time, especially for larger-scale contexts such as a country. This limits the application of the proposed method to relatively small-scale scenarios, such as a city.
Figure 13. Colour composite of Landsat 8 pixels in formal vs. informal built-up
5. Conclusions
It is estimated that informal settlements accommodate 25% of the urban population (UN-Habitat, Citation2013b). This remarkable share of the world’s urban population is the most vulnerable and least recognised in planning and management practices (Rumbach & Shirgaokar, Citation2017; UN-Habitat, Citation2014). Informal settlements have also received limited acknowledgment in the global efforts to reach Sustainable Development Goals (SDGs), despite its main slogan saying ‘leave no one behind’. This is due to the lack of statistical and census data about the settlements. The initial step to address this is deemed to be the act of detecting informal settlements within urban areas, yet monitoring and upgrading them is one of the biggest challenges.
Although high resolution remotely sensed data and particularly satellite images provide the opportunity to detect informal settlements, the drawback is still the lack of accessibility as a cost-prohibitive data source. In the current study, the application of random forest algorithm (RF) for the detection of informal settlement on freely available Landsat 8 has been tested through two complementary approaches for developing the training set. In the primary approach, the training samples were developed applying two methods: using available databases (the most current map for informal settlements); and visual interpretation method using VHR. In the secondary or complementary approach, OpenStreetMap (OSM) has been used for building the sample set for the classes with the least accuracy and precision in the first round of classification.
The comparison between the results from the first and the second round of classification showed that OSM can be used as a complementary data layer to enhance the rigor of developing the training set, as well as making the detection of informal settlements more accurate. However, the results showed that OSM is helpful when distinctive structural features exist between formal and informal settlements (e.g. different building size or street width). Consequently, the method does not enhance the classification in the areas where formal and informal settlements are structurally similar. Additionally, in case the training relies only on OSM, some physical features such as the rooftop materials that create unique colour composites might be overlooked. So, in this sense visual interpretation is unavoidable.
The final limitation of applying OSM relates to the validation issue of the open data and availability of the data with the required data attributes. Based on the aim of classification, required data might not be available through the OSM of the area of interest. In addition, OSM as a Volunteered Geographic Information (VGI) is less reliable in comparison to the data provided by authorities, such as maps created by government agencies. Nevertheless, the opportunities that OSM provides has made it a competitive source of data. Furthermore, several methods exist that can be used to validate OSM, such as the ground check: comparing with the available data from other sources such as government prepared maps or Google maps for the physical features.
In addition to the limitation of using OSM, the results reveal another impediment that exists in the detection of informal settlements on Landsat 8, which is overfitting and misclassification of formal areas as informal, or vice versa. This is due to the similarity of the Jakarta’s informal and formal areas’ colour composite on Landsat 8. This might happen due to the similarity of the roof materials in both classes, the mixture of formal and informal blocks in some urban areas, or closeness of the building blocks or lack of green spaces in the formal settlements which is mainly a physical attribute of the informal urban fabric.
Overall, the findings confirm the application of the proposed workflow as a cost-effective way to detect informal settlements. However, considering the impediments and the necessity for visual checks, the application of this method best suits the areas not bigger than a city where: 1) informal and formal settlements are structurally diverse; 2) major differentiations exist in roof materials of the settlements; and 3) formal and informal settlements are not well linked, if at all.
The proposed workflow supports the operation of remote sensing to facilitate an inclusive movement towards the achievement of SDGs to develop a more resilient and sustainable future for all communities. However, future studies must be conducted on the validation of OSM to enhance the reliability of this data source.


Data availability statement
Open data used for this study is freely available to public through the Copernicus Open Access Hub (https://scihub.copernicus.eu/) and OpenStreetMap Indonesia (https://openstreetmap.id/en/dki-jakarta/).
Disclosure statement
No potential conflict of interest was reported by the author(s).
Additional information
Funding
Notes on contributors
Zahra Assarkhaniki
Prof. Abbas Rajabifard is Discipline Leader of Geomatics, Director of Smart Sustainable Development and Leader of the Future Infrastructure Research Program, Melbourne School of Engineering. He is also the director of the Centre for Spatial Data Infrastructures and Land Administration (CSDILA) and chair of the Academic Network of the United Nations Global Geospatial Information Management -GGIM. He has a strong track record in research and teaching, academic leadership, and is an internationally recognised scholar and engineer in Surveying and Mapping, Land Administration, and Urban Systems.
Soheil Sabri
Soheil Sabri is a Research Fellow in Urban Analytics at the Centre for Spatial Data Infrastructures and Land Administration at the University of Melbourne. Soheil earned his Master in Urban Planning in 2004 and PhD in Urban & Regional Planning, with focus on Geosimultaion, in 2012. He has extensive and hands-on experience in consultancy, research and teaching about technological innovation and modernisation in urban planning and design, particularly planning support systems, Geosimulation, GeoDesign, and spatial statistics, analysis and modelling.
Abbas Rajabifard
Zahra Assarkhaniki received the M.S. degree in environmental design engineering from the University of Tehran, Iran, in 2014. She has strong records of professional experience in urban planning and design within industry and academia. She is currently pursuing the Ph.D. degree at the Centre for Spatial Data Infrastructures and Land Administration (CSDILA), within the Department of Infrastructure Engineering, the University of Melbourne, Australia. Her research interests include urban analytics, resilient and sustainable urban design, urban planning support system, and deep learning and machine learning.
References
- Abdi, A. M. (2020). Land Cover and Land Use Classification Performance of Machine Learning Algorithms in a Boreal Landscape Using Sentinel-2 Data. GIScience and Remote Sensing, 57(1), 1–20.
- Alzamil, W. S. (2018). Evaluating Urban Status of Informal Settlements in Indonesia: A Comparative Analysis of Three Case Studies in North Jakarta. Journal of Sustainable Development, 11(4), 148.
- Assarkhaniki, Z., Rajabifard, A., & Sabri, S. (2020). The Conceptualisation of Resilience Dimensions and Comprehensive Quantification of the Associated Indicators: A Systematic Approach. International Journal of Disaster Risk Reduction, 51(December), 101840. doi: https://doi.org/10.1016/j.ijdrr.2020.101840.
- Bank, T. W. (2015). DKI Jakarta: Informal Settlement Mapping Jakarta. http://pubdocs.worldbank.org/en/408201444418421010/Output-DKI-JAKARTA-INFORMAL-SETTLEMENT-MAPPING.
- Bank, T. W. (2016). Indonesia: Improving Infrastructure for Millions of Urban Poor 2016. https://www.worldbank.org/en/news/press-release/2016/07/12/indonesia-improving-infrastructure-for-millions-of-urban-poor.
- Barrington-Leigh, C., & Millard-Ball., A. (2017). The World’s User-Generated Road Map Is More than 80% Complete. PLoS ONE, 12(8), 1–20.
- Blaschke, T. (2010). Object Based Image Analysis for Remote Sensing. ISPRS Journal of Photogrammetry and Remote Sensing, 65(1), 2–16.
- BPS-Statistics Indonesia. (2005). Badan Pusat Statistik. https://www.bps.go.id/.
- Breiman, L. (1996). Bagging Predictions. Machine Learning, 24, 123–140.
- Breiman, L. (2001). Random Forests. Machine Learning, 45, 5–32.
- Brodley, C. E., & Friedl, M. A. (1997). Decision Tree Classification of Land Cover from Remotely Sensed Data. Remote Sensing of Environment, 61(3), 399–409.
- Campos-Taberner, M., Francisco Javier, G. H., Beatriz, M., Emma, I.-V., Clement, A., Gustau, C.-V., & María, A. G. (2020). Understanding Deep Learning in Land Use Classification Based on Sentinel-2 Time Series. Scientific Reports, 10(1), 1–12.
- Carleer, A. P., & Wolff, E. (2006). Urban Land Cover Multi ‐ Level Region ‐ Based Classification of VHR Data by Selecting Relevant Features. International Journal of Remote Sensing, 1161. doi:https://doi.org/10.1080/01431160500297956.
- Counihan, C. H. (2017). An Incremental Intervention. In Jakarta : An Empowering Infrastructural Approach For Upgrading Informal Settlements, Masters Theses. 500. doi: https://doi.org/10.7275/10099007.
- Dittakan, K., Coenen, F., Christley, R., & Wardeh, M. (2013). Population Estimation Mining Using Satellite Imagery. In Data Warehousing and Knowledge Discovery: 15th International Conference DaWaK, Prague, Czech Republic, August 26-29, 2013, L. Bellatreche & M. K. Mohania. (Eds), 8057 LNCS:285–96. Springer. doi:https://doi.org/10.1007/978-3-642-40131-2_25.
- Dixon, B., & Candade, N. (2008). Multispectral Landuse Classification Using Neural Networks and Support Vector Machines : One or the Other, or Both? International Journal of Remote Sensing, 29, 4.
- Dovey, K., & King, R. (2011). Forms of Informality: Morphology and Visibility of Informal Settlements. Built Environment, 37(1), 11–29.
- Du, S., Zhang, F., & Zhang, X. (2015). Semantic Classification of Urban Buildings Combining VHR Image and GIS Data: An Improved Random Forest Approach. ISPRS Journal of Photogrammetry and Remote Sensing, 105, 107–119.
- Dubovyk, O., Sliuzas, R., & Flacke, J. (2011). Spatio-Temporal Modelling of Informal Settlement Development in Sancaktepe District, Istanbul, Turkey. ISPRS Journal of Photogrammetry and Remote Sensing, 66(2), 235–246.
- Duro, D. C., Franklin, S. E., & Dubé, M. G. (2012). A Comparison of Pixel-Based and Object-Based Image Analysis with Selected Machine Learning Algorithms for the Classification of Agricultural Landscapes Using SPOT-5 HRG Imagery. Remote Sensing of Environment, 118, 259–272.
- Estima, J., & Painho, M. (2015). Investigating the Potential of OpenStreetMap for Land Use/Land Cover Production: A Case Study for Continental Portugal. In J. J. Arsanjani, A. ZipfPeter, & H. MooneyMarco (Eds), OpenStreetMap in GIScience: Experiences, Research, and Applications (pp. 273–293). Springer Switzerland.
- Fallatah, A., Jones, S., & Mitchell, D. (2020). Object-Based Random Forest Classification for Informal Settlements Identification in the Middle East: Jeddah a Case Study. International Journal of Remote Sensing, 41(11), 4421–4445.
- Filho, L., Walter, C. S., Paço, A., Mifsud, M., Ávila, L. V., Brandli, L. L., Molthan-Hill, P., et al. (2019). Sustainable Development Goals and Sustainability Teaching at Universities: Falling behind or Getting Ahead of the Pack? Journal of Cleaner Production, 232, 285–294.
- Foody, G. M., & Arora, M. K. (1997). An Evaluation of Some Factors Affecting the Accuracy of Classification by an Artificial Neural Network. International Journal of Remote Sensing, 18(4), 799–810.
- Forget, Y., Linard, C., & Gilbert, M. (2018). Supervised Classification of Built-up Areas in Sub-Saharan African Cities Using Landsat Imagery and Openstreetmap. Remote Sensing, 10(7), 1–16.
- Gamba, P., Member, S., Acqua, F. D., Lisini, G., Trianni, G., & Member, S. (2007). Improved VHR Urban Area Mapping Exploiting Object Boundaries. IEEE Transactions on Geoscience and Remote Sensing, 45(8), 2676–2682.
- Garr, D. (1986). Kampung Improvement Program: Policy Issues and Local Impacts for Secondary Cities. JPER, 9(1), 79–83.
- Goodchild, M. F. (2007). Citizens as Sensors: The World of Volunteered Geography. GeoJournal, 69(4), 211–221.
- Gram-Hansen, B. J., Azam, F., Helber, P., Coca-Castro, A., Bilinski, P., Varatharajan, I., & Kopackova, V. (2019). Mapping Informal Settlements in Developing Countries Using Machine Learning and Low Resolution Multi-Spectral Data. In AI/ACM Conference on AI, Ethics, and Society, 361–368. Honolulu, doi:https://doi.org/10.1145/3306618.3314253.
- Haklay, M. (2010). How Good Is Volunteered Geographical Information? A Comparative Study of OpenStreetMap and Ordnance Survey Datasets. Environment and Planning. B, Planning & Design, 37(4), 682–703.
- Hermosilla, T., Wulder, M. A., White, J. C., Coops, N. C., & Hobart, G. W. (2018). Disturbance-Informed Annual Land Cover Classification Maps of Canada’s Forested Ecosystems for a 29-Year Landsat Time Series. Canadian Journal of Remote Sensing, 44(1), 67–87.
- Hernandez, I., Ruiz, E., & Shi, W. (2018). A Random Forests Classification Method for Urban Land-Use Mapping Integrating Spatial Metrics and Texture Analysis. International Journal of Remote Sensing, 39, 4.
- Hidayati, I., Yamu, C., & Tan, W. (2020). Realised Pedestrian Accessibility of an Informal Settlement in Jakarta, Indonesia. Journal of Urbanism, 1–23. doi: https://doi.org/10.1080/17549175.2020.1814391.
- Hillson, R., Coates, A., Alejandre, J. D., Jacobsen, K. H., Ansumana, R., Bockarie, A. S., … Stenger, D. A. (2019). Estimating the Size of Urban Populations Using Landsat Images: A Case Study of Bo, Sierra Leone, West Africa. International Journal of Health Geographics, 18, 1–24. doi:https://doi.org/10.1186/s12942-019-0180-1.
- Hofmann, P., Strobl, J., Blaschke, T., & Kux, H. (2008). Detecting Informal Settlements from QuickBird Data in Rio de Janeiro Using an Object-Based Approach. In Object-Based Image Analysis, T. Blaschke, S. Lang, & G. J. Hay. (Eds) Object-Based Image Analysis. Lecture Notes in Geoinformation and Cartography. Springer, Berlin, Heidelberg. https://doi.org/https://doi.org/10.1007/978-3-540-77058-9_29.
- Jain, S. (2007). Use of IKONOS Satellite Data to Identify Informal Settlements in Dehradun, India. International Journal of Remote Sensing, 28(15), 3227–3233.
- Jokar Arsanjani, J., Helbich, M., & Bakillah, M. (2013). Exploiting Volunteered Geographic Information To Ease Land Use Mapping of an Urban Landscape. ISPRS - International Archives of the Photogrammetry, Remote Sensing and Spatial Information Sciences XL-4/W1, 51–55. doi:https://doi.org/10.5194/isprsarchives-xl-4-w1-51-2013.
- Jones, P. (2017). Formalizing the Informal: Understanding the Position of Informal Settlements and Slums in Sustainable Urbanization Policies and Strategies in Bandung, Indonesia. Sustainability. doi:https://doi.org/10.3390/su9081436.
- Jones, P. (2019). The Shaping of Form and Structure in Informal Settlements: A Case Study of Order and Rules in Lebak Siliwangi, Bandung, Indonesia. Journal of Regional and City Planning, 30(1), 43–61.
- Kamalipour, H. (2020). Improvising Places: The Fluidity of Space in Informal Settlements. Sustainability (Switzerland), 12, 6.
- Karlsson, A. (2003). Classification of High Resolution Satellite Images Chalmers University of Technology.
- Khorram, S., Nelson, S., & Cakir, H. (2013). Digital Image Processing: Post-Processing and Data Integration. In J. N. Pelton, S. Madry, & S. Camacho-Lara (Eds), Handbook of Satellite Applications (pp. 839–864). New York: Springer. doi:https://doi.org/10.1007/978-1-4419-7671-0.
- Kit, O., Lüdeke, M., & Reckien, D. (2012). Texture-Based Identification of Urban Slums in Hyderabad, India Using Remote Sensing Data. Applied Geography, 32(2), 660–667.
- Lavigne, P. D., & Durand-Lasserve., A. (2009). Land Governance and Security of Tenure in Developing Countries. white paper. French Development Cooperation.
- Loyd, C. (2013). Landsat 8 Bands. NASA Landsat Science, 2013 https://landsat.gsfc.nasa.gov/landsat-8/landsat-8-bands
- Lu, Z., Szafron, D., Greiner, R., Lu, P., Wishart, D. S., Poulin, B., … Eisner, R. (2004). Predicting Subcellular Localization of Proteins Using Machine-Learned Classifiers. Bioinformatics, 20(4), 547–556.
- Lu, Z., Jungho, I., Quackenbush, L., & Halligan, K. (2010). Population Estimation Based on Multi-Sensor Data Fusion. International Journal of Remote Sensing, 1161. doi:https://doi.org/10.1080/01431161.2010.496801.
- Lv, Z., Liu, T., & Benediktsson, J. A. (2020). Object-Oriented Key Point Vector Distance for Binary Land Cover Change Detection Using VHR Remote Sensing Images. IEEE Transactions on Geoscience and Remote Sensing, 58(9), 6524–6533.
- Mahabir, R., Agouris, P., Stefanidis, A., Croitoru, A., T.Crooks, A. (2020). Detecting and mapping slums using open data: a case study in Kenya. International Journal of Digital Earth, 13(6), 683–707. DOI: https://doi.org/10.1080/17538947.2018.1554010.
- Makinde, E. O., Salami, A. T., Olaleye, J. B., & Okewusi, O. C. (2016). Object Based and Pixel Based Classification Using Rapideye Satellite Imager of ETI-OSA, Lagos, Nigeria. Geoinformatics FCE CTU, 15(2), 59–70.
- Mayunga, S. D., Coleman, D. J., & Zhang, Y. (2007). A Semi-Automated Approach for Extracting Buildings from QuickBird Imagery Applied to Informal Settlement Mapping. International Journal of Remote Sensing, 28(10), 2343–2357.
- Mclaren, R., Coleman, D., & Mayunga, S. (2005). Sustainable Management of Mega Growth in Megacities. Proceedings of the FIG Working Week, Cairo, Egypt, http://www.fig.net/pub/cairo/papers/ts_19/ts19_01_mclaren_etal.pdf.
- Ming, D., Zhou, T., Wang, M., & Tan, T. (2016). Land Cover Classification Using Random Forest with Genetic Algorithm-Based Parameter Optimization. Journal of Applied Remote Sensing, 10(3), 035021.
- Movia, A., Beinat, A., & Crosilla, F. (2016). Shadow Detection and Removal in RGB VHR Images for Land Use Unsupervised Classification. ISPRS Journal of Photogrammetry and Remote Sensing, 119, 485–495.
- Nilsson, N. J. (1965). Learning Machines. New York: McGrawHill.
- Noi, P. T., & Kappas, M. (2017). Comparison of Random Forest, k-Nearest Neighbor, and Support Vector Machine Classifiers for Land Cover Classification Using Sentinel-2 Imagery. Sensors, 18, 18.
- Novack, T., Kux, H. J. H., Feitosa, R. Q., Costa, G. A., Sensing, R., José, S., … Iv, W. G. (2003). Per Block Urban Land Use Interpretation Using Optical VHR Data and the Knowledge-Based System Interimage. The International Archives of the Photogrammetry Remote Sensing and Spatial Information Sciences, 38, 4/C7.
- Ogrosky, C. E. (1975). Population Estimates from Satellite Imagery. Photogrammetric Engineering and Remote Sensing, 41, 707–712.
- Ouyang, Z.-T., Zhang, M.-Q., Xie, X., Shen, Q., Guo, H.-Q., & Zhao, B. (2011). A Comparison of Pixel-Based and Object-Oriented Approaches to VHR Imagery for Mapping Saltmarsh Plants. Ecological Informatics, 6(2), 136–146.
- Owen, K. K., & Wong, D. W. (2013). An Approach to Differentiate Informal Settlements Using Spectral, Texture, Geomorphology and Road Accessibility Metrics. Applied Geography, 38(1), 107–118.
- Pal, M. (2005). Random Forest Classifier for Remote Sensing Classification. International Journal of Remote Sensing, 26, 1.
- Pal, M., & Mather, P. M. (2003). An Assessment of the Effectiveness of Decision Tree Methods for Land Cover Classification. Remote Sensing of Environment, 86(4), 554–565.
- Pangeran, A., & Akbar, R. J. 2020. Cities for Marginal Community: Lesson Learned from Indonesia’s Slum Alleviation Program.
- Persello, C., & Stein, A. (2017). Deep Fully Convolutional Networks for the Detection of Informal Settlements in VHR Images. IEEE Geoscience and Remote Sensing Letters, 14(12), 2325–2329.
- Pontarollo, N., & Mendieta Muñoz, R. (2020). Land Consumption and Income in Ecuador: A Case of an Inverted Environmental Kuznets Curve. Ecological Indicators, 108. doi:https://doi.org/10.1016/j.ecolind.2019.105699.
- Prabhu, R., Parvathavarthini, B., & Alagu Raja, R. A. (2021). Slum Extraction from High Resolution Satellite Data Using Mathematical Morphology Based Approach. International Journal of Remote Sensing, 42(1), 172–190.
- Ranguelova, E., Weel, B., Roy, D., Kuffer, M., Pfeffer, K., & Lees, M. (2019). Image Based Classification of Slums, Built-up and Non-Built-up Areas in Kalyan and Bangalore, India. European Journal of Remote Sensing, 52(sup1), 40–61.
- Rodriguez-Galiano, V., Sanchez-Castillo, M., Chica-Olmo, M., & Chica-Rivas, M. (2015). Machine Learning Predictive Models for Mineral Prospectivity: An Evaluation of Neural Networks, Random Forest, Regression Trees and Support Vector Machines. Ore Geology Reviews, 71, 804–818.
- Rodriguez-Galiano, V. F., Ghimire, B., Rogan, J., Chica-Olmo, M., & Rigol-Sanchez, J. P. (2012). An Assessment of the Effectiveness of a Random Forest Classifier for Land-Cover Classification. ISPRS Journal of Photogrammetry and Remote Sensing, 67(1), 93–104.
- Rodriguez-Galiano, V. F., & Chica-Rivas., M. (2014). Evaluation of Different Machine Learning Methods for Land Cover Mapping of a Mediterranean Area Using Multi-Seasonal Landsat Images and Digital Terrain Models. International Journal of Digital Earth, 7(6), 492–509.
- Rubinowicz, P. (2000). Chaos and Geometric Order in Architecture and Design Journal for Geometry and Graphics, 4(2), 197–207.
- Rukmana, D. (2008). The Growth of Jakarta Metropolitan Area and the Sustainability of Urban Development in Indonesia. The International Journal of Environmental, Cultural, Economic, and Social Sustainability: Annual Review, 4(1), 99–106.
- Rumbach, A., & Shirgaokar, M. (2017). Predictors of Household Exposure to Monsoon Rain Hazards in Informal Settlements. Natural Hazards, 85(2), 709–728.
- Rumelhart, D. E., Hintont, G. E., Hiinton, & Williams, R. J. (1986). Learning Representations by Back-Propagating Errors. Nature, 323(9), 533–536.
- Soman, S., Beukes, A., Nederhood, C., Marchio, N., & Bettencourt, L. (2020). Worldwide Detection of Informal Settlements via Topological Analysis of Crowdsourced Digital Maps. ISPRS International Journal of Geo-Information, 9(11), 685.
- Statistics Indonesia- Badan Pusat Statistik (BPS). (2020). Population Jakarta. https://www.bps.go.id/.
- Suhartini, N., & Jones, P. (2020). Better Understanding Self-Organizing Cities: A Typology of Order and Rules in Informal Settlements. Journal of Regional and City Planning, 31(3), 237–263.
- Sweeting, D. 2017. The Informal City and Rights in South East Asian Cities: The Cases of Kampung Improvement Programme and Baan Mankong, no. 192. https://www.ucl.ac.uk/bartlett/development/sites/bartlett/files/wp192_david_sweeting.pdf.
- Teluguntla, P., Thenkabail, P., Oliphant, A., Xiong, J., Gumma, M. K., Congalton, R. G., … Huete, A. (2018). A 30-m Landsat-Derived Cropland Extent Product of Australia and China Using Random Forest Machine Learning Algorithm on Google Earth Engine Cloud Computing Platform. ISPRS Journal of Photogrammetry and Remote Sensing, 144(August), 325–340.
- Toll, L. (1984). An Evaluation of Simulated Thematic Mapper Data and Landsat MSS Data For- Isc Criminating Suburban and Regional Land Use and Land Cover. Photogrammetric Engineering and Remote Sensing, 50, 12.
- U.S. Geological Survey. (2016). Landsat 8 Data Users Handbook NASA 8. https://landsat.usgs.gov/documents/Landsat8DataUsersHandbook.pdf.
- UNDP. (2016). Report of the Inter-Agency and Expert Group on Sustainable Development Goal Indicators.
- UN-Habitat. (2020). World Cities Report 2020: The Value of Sustainable Urbanization. Nairobi.
- UN-Habitat. (2007). UN-HABITAT and the Kenya Slum Upgrading Programme Nairobi.
- UN-Habitat. (2013a). State of the World’s Cities 2012–2013: Prosperity of Cities Nairobi.
- UN-Habitat. (2013b). Streets as Public Spaces and Drivers of Urban Prosperit. Nairobi.
- UN-Habitat. (2014). Promoting Resilient Housing and Secure Tenure in a Changing Climate
- UN-Habitat. (2015). The State of Asian and Pacific Cities 2015: Urban Transformations Shifting from Quantity to Quality. https://unhabitat.org/books/the-state-of-asian-and-pacific-cities–2015/.
- United Nations. (2015a). Paris Agreement. New York.
- United Nations. (2015b). Addis Ababa Action Agenda. New York.
- United Nations. (2015c). Sendai Framework for Disaster Risk Reduction 2015–2030. https://www.unisdr.org/files/43291_sendaiframeworkfordrren.pdf.
- United Nations. (2015d). Transforming Our World: The 2030 Agenda for Sustainable Development
- United Nations. (2017). New Urban Agenda. United Nations (Habitat III). www.habitat3.org.
- United Nations. (2018). World Urbanization Prospects: The 2018 Revision. Department of Economic & Social Affairs. New York. doi:https://doi.org/10.4054/demres.2005.12.9.
- UNSD. (2020). Global Indicator Framework for the Sustainable Development Goals and Targets of the 2030 Agenda for Sustainable Development. Work of the Statistical Commission Pertaining to the 2030 Agenda for Sustainable Development. https://unstats.un.org/sdgs/indicators/Global.Indicator.Framework.after.2019.refinement_Eng.pdf%0Ahttps://unstats.un.org/sdgs/indicators/Global.Indicator.Framework_A.RES.71.313.Annex.pdf.
- Verma, D., Jana, A., & Ramamritham, K. (2019). Transfer Learning Approach to Map Urban Slums Using High and Medium Resolution Satellite Imagery. Habitat International, 88(April), 101981.
- Volpi, M., Tuia, D., Bovolo, F., Kanevski, M., & Bruzzone, L. (2013). Supervised Change Detection in VHR Images Using Contextual Information and Support Vector Machines. International Journal of Applied Earth Observations and Geoinformation, 20, 77–85.
- Voorde, T., Van, D., William, D. G., & Canters, F. (2007). Improving Pixel-Based VHR Land-Cover Classifications of Urban Areas with Post-Classification Techniques. In Photogramm. Eng. Remote Sensing (pp. 1017–1027). American Society for Photogrammetry and Remote Sensing.
- Wang, M.-X., Huang, D., Wang, G., & Dian-Qing, L. (2020). SS-XGBoost: A Machine Learning Framework for Predicting Newmark Sliding Displacements of Slopes. Journal of Geotechnical and Geoenvironmental Engineering, 146(9), 04020074.
- Weir, D., McQuillan, D., & Francis, R. A. (2019). Civilian Science: The Potential of Participatory Environmental Monitoring in Areas Affected by Armed Conflicts. Environmental Monitoring and Assessment, 191(10). doi:https://doi.org/10.1007/s10661-019-7773-9
- The World Bank. (2000). Transition: World Bank Urban and Local Government Strategy Washington.
- The World Bank. (2011). Jakarta Urban Challenges in a Changing Climate Jakarta. http://documents.worldbank.org/curated/en/132781468039870805/pdf/650180WP0Box360ange0Jakarta0English.pdf.
- Wurm, M., Taubenböck, H., Weigand, M., & Schmitt, A. (2017). Slum Mapping in Polarimetric SAR Data Using Spatial Features. Remote Sensing of Environment, 194, 190–204.
- Xia, L. I. (2007). Technical Note. A Method to Improve Classification with Shape Information. International Journal of Remote Sensing , 17, 8.
- Zhang, H. K., & Roy, D. P. (2017). Remote Sensing of Environment Using the 500 m MODIS Land Cover Product to Derive a Consistent Continental Scale 30 m Landsat Land Classfication. Remote Sensing of Environment, 197, 15–34.
- Zhang, Y., Peng, D., & Huang, X. (2018). Object-Based Change Detection for VHR Images Based on Multiscale Uncertainty Analysis. IEEE Transactions on Geoscience and Remote Sensing Letters, 15(1), 13–17.
- Zhou, B., Okin, G. S., & Zhang, J. (2020). Leveraging Google Earth Engine (GEE) and Machine Learning Algorithms to Incorporate in Situ Measurement from Different Times for Rangelands Monitoring. Remote Sensing of Environment, 236, 111521.
- Zhu, Z., Gallant, A. L., Woodcock, C. E., Pengra, B., Pontus Olofsson, T. R., Loveland, S. J., … Auch, R. F. (2016). Optimizing Selection of Training and Auxiliary Data for Operational Land Cover Classification for the LCMAP Initiative. ISPRS Journal of Photogrammetry and Remote Sensing, 122, 206–221.