
 ?Mathematical formulae have been encoded as MathML and are displayed in this HTML version using MathJax in order to improve their display. Uncheck the box to turn MathJax off. This feature requires Javascript. Click on a formula to zoom.
ABSTRACT
The 17 Sustainable Development Goals present clear directions toward the green transformation being sought by the global community. The SDGs are an integrated framework, with a complex network of interlinkages between the goals, targets and indicators, and they pose wicked problems to society. Consequently, measuring progress and achievements with the SDGs requires the integration of various spatio-temporal datasets from different domains and the synthesis of disciplines to describe a system of systems. The Group on Earth Observations has developed the concept of Essential Variables to describe systems across Societal Benefit Areas that are applicable for this purpose. Digital Earth is a virtual representation of the planet, potentially encompassing all its systems and life forms, including human societies. Designed as a multi-dimensional, multi-scale, multi-temporal, and multi-layer information facility, Digital Earth is a valuable platform that can contribute to the achievement of the SDGs and a green transformation. To that end, a set of Essential SDGs Variables (ESDGVs) for the platform are proposed and cases of implementation and use are introduced.
1. Introduction
The coronavirus (COVID-19) (CMOS Shop Talk, Citation2021) pandemic has changed and impacted economies, cities and the environment, while transforming societies with accelerated digitalization and reduced physical interaction. The pandemic has also made us realize the everyday importance of geoinformation, “location is everywhere,” through maps and numbers (Geospatial World, Citation2021). The term “digital twin,” originally from the engineering discipline, can be employed now in the context of geospatial infrastructure. The green transformation is a development approach purposely to shift society towards sustainability to deal with climate change bridging digital transformation. With the rapid development of big data, artificial intelligence, supercomputing and other emerging technologies, geospatial technology can help with the green transformation, and is enabling a whole new realm of “digital twins of the Earth,” to create qualitatively new Earth system simulation and observation capabilities (Bauer, Stevens, & Hazeleger, Citation2021). The digital twins of the Earth and examples such as Destination Earth (European Commission, Citation2020) are intended to be information systems for decision-making on transformational policies for sustainable development.
The real quality of the information-orientated society is that decision making in cyber space (a digital world, a virtual space created by computer networks, separated from the real space) plays a guiding role in the real world (the real world, economy, lifestyle, industries, environment etc.). Therefore, it is a crucial task to build an adequate cyber space that can be a metaphor of the real world, without lacking necessary information. For this, conventional tools that process numbers and text as “desk top metaphor” are no longer best suited. Rather, we need an “earth metaphor” tool that captures vast quantities of geospatial data, and turns them into a multi-resolution, time-based three-dimensional representation of the earth in real time.
Building the cyber space based on digitized geospatial information enables an accurate shift from the real to the virtual space, also enabling a virtual visualization of natural phenomena or socio-economic activities. For the people who share this virtual space, it also provides an opportunity of communication, mutual understanding and cooperative working. Digital Earth is the cyber space recreated by multi-resolution and multi-dimensional utilization of geospatial information (Fukui & Takahashi, Citation2003).
The 17 Sustainable Development Goals (SDGs) adopted at the United Nations Summit on Sustainable Development in September 2015 provide clear directions for transforming the way countries develop for the foreseeable future. For the SDGs to guide transition pathways, indicators and tools are required for use in measuring, analyzing, and communicating progress over time at international and national levels. To balance human development in multiple dimensions by achieving the SDGs and their targets inclusively requires a paradigm shift from a siloed approach to an integrated approach in policy-making. Effective SDGs implementation therefore calls for a systems approach to seek and scale up the synergies and minimize the trade-offs for cross-sectoral integration and institutional collaboration (Institute for Global Environmental Strategies (IGES), Citation2021). The SDGs and their related targets, which are closely interlinked and complementary, constitute a complex network linkages, and implementation of the SDGs poses wicked problems to society (Plag & Shelley-Ann, Citation2020).
Measuring the achievement of sustainable development requires the integration of various datasets and disciplines describing bio-physical and socio-economic conditions, among others. Earth Observations (EO) data represent valid and globally-consistent sources of information for monitoring the state of the planet and increasing our understanding of Earth processes. To adequately describe the various sub-systems that constitute a complex network of linkages (e.g. atmosphere, biosphere, geosphere, hydrosphere), the Group on Earth Observations (GEO) communities have promoted
So the concept of Essential Variables (EVs), a “minimal set of variables that determine the system’s state and developments” that are “crucial for predicting system developments” and that “allow us to define metrics that measure the trajectory of the system,” across several Social Benefit Areas (SBAs) (Lehmann, Masò, Nativi, & Giuliani, Citation2020).
Digital Earth can contribute as a platform for the SDGs and the green transformation. It has the potential to be an information services system that develops transformation-related knowledge and tests scenarios along with alternative policies for more sustainable development.
The following sections examine a proposed conceptual design of Essential SDGs Variables (ESDGVs) for the platform and introduce examples of implementation and use.
2. Essential Variables for Sustainable Development Goals
EVs are crucial for observing and monitoring a given facet of the Earth system. Currently, as a part of global efforts coordinated in part by GEO, EVs have first been defined for climate as ECVs (Global Climate Observing System (GCOS), Citation2020), biodiversity as EBVs (The Group on Earth Observations Biodiversity Observation Network (GEO BON), Citation2018), oceans as EOVs (Global Ocean Observing System (GOOS), Citation2021), and water as EWVs (Group on Earth Observation – Global Water Sustainability (GEOGloWS), Citation2021). More are coming for other domains, including air quality, agriculture, and renewable energy (Lehmann et al., Citation2020). EVs have been defined following several strategies, including representation, feasibility, unambiguity and evolvability (Lehmann et al., Citation2020). In general, EVs are meant to be the minimum set of variables needed to characterize change in a system. There are possibly some overlaps between EVs for Sustainable Development Goals (ESDGVs) and other EVs including ECVs, EBVs, and EOVs. Specific sets of EVs are often defined to meet the objectives of the respective community. Having a tailored set of ESDGVs would be essential for SDG monitoring. There is currently no fully established set of ESDGVs, although some efforts have been made, including work to define selection criteria (Reyers, Stafford-Smith, Erb, Scholes, & Selomane, Citation2017) or a more detailed approach with several examples of essential transformation variables (Plag & Shelley-Ann, Citation2020).
Ideally, ESDGVs should contain the minimum number of variables that capture the concerns of SDGs. Plag and Jules-Plag proposed a goal-based method which is able to identify essential transformational variables based on SDGs indicators. Five groups of ETVs have been identified consisting of People and Social & Ethical aspects, Governance/Policy development, Infrastructure, Economy and Earth-life support system. SDGs cover a wide variety of both physical world and human society. A hierarchical system may be beneficial to identification of ESDGVs. The ECVs sufficiently describe different layers of the Earth in a hierarchical approach. ESDGVs include the physical world variables in the Earth-life support system category. As a result, ESDGVs hierarchy may be as large as ECVs. We proposed a hierarchical set of ESDGVs consisting of four layers: EV layer, EV Category, EV, EV product. The EV layer employs the five groups as proposed by (Plag & Shelley-Ann, Citation2020). The EV category and EV are formed based on groups of interests of SDGs, and with referring to other categorizations from ECV, EBV and SDGs (Yukiko Global Climate Observing System (GCOS), Citation2020; Global Ocean Observing System (GOOS), Citation2021; Takasu et al., Citation2020; The Group on Earth Observations Biodiversity Observation Network (GEO BON), Citation2018). Finally, within an EV, there may be one or more EV products which are closely related in semantic and format. The initial set of ESDGVs is presented in .
Table 1. The proposed list of ESDGVs (See Appendix A for more detailed information). Notations: ECV – Essential Climate Variables, EBV – Essential Biodiversity Variables, EWV – Essential Water Variables
3. System description of the Digital Earth platform
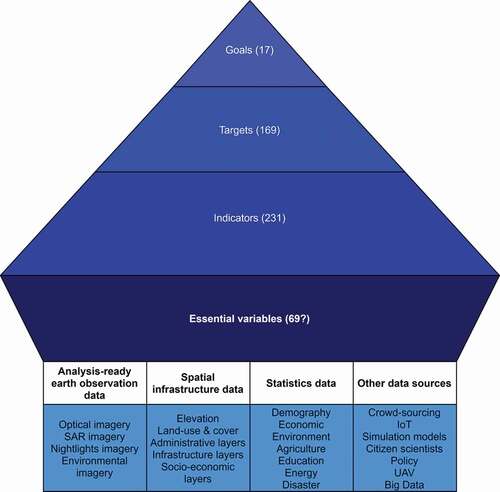
The conceptual data flow of the platform is presented in . The first layer manages analysis-ready Earth observation data, spatial infrastructure data, statistics data and other data sources. This layer serves as the basis for creation of the essential variables (EVs), which are the middleware for higher-level applications, in this case the sustainable development indicators, targets and goals. EVs act as an abstract layer between raw content, such as Earth observation images, and indicators to be monitored. This function of EVs is particularly important, as they focus the complexity and diversity of remote sensing and spatial data. Through a coordinated use of EVs, more knowledge can be shared while using less data (Lehmann et al., Citation2020).
Figure 1. Conceptual data flow of the Digital Earth platform as applied to SDGs
Some EV data records are already available from a number of organizations, including the Global Climate Observing System (GCOS), the European Space Agency Climate Change Initiative (ESA CCI), the Committee on Earth Observation Satellites (CEOS), the Coordination Group for Meteorological Satellites (CGMS), the Remote Sensing Systems (REMSS), Joint Working Group on Climate (WGClimate) and other bodies (Giuliani et al., Citation2020). Efforts to date have found, however, that data discovery and access is challenging due to the lack of common data and metadata catalogues (Giuliani et al., Citation2020). Therefore, a standardised portal to access data could be beneficial for users.
For energy sector, SDG 7 and 13 are considered relevant (Plag & Shelley-Ann, Citation2020). SDG 7 is “Ensure access to affordable, reliable, sustainable and modern energy for all,” and SDG 13 is “Take urgent action to combat climate change and its impacts.” These goals are expanded into 10 targets and then 14 indicators (United Nations, Citation2020). These two goals are often considered together, as both affordable and clean energy targets need to be achieved. The two goals are both challenging, and to some extent, in conflict. The linkage of ESDGVs for these goals and others is presented in Appendix B. For example, combination of population density and electrification rate may be used to derive the proportion of population with access to electricity. Population density is a multipurpose variable. It also has a major role for estimation of indicators 7.1.1 and 7.1.2. In fact, this variable could be used across all SDGs, including SDG 11 and 13 (Ehrlich, Kemper, Pesaresi, & Corbane, Citation2018).
These variables can be derived from Earth observation, spatial data or census data to get updates over time at fine geographical resolutions. Night-time light data, including the Visible Infrared Imaging Radiometer Suite (VIIRS), could potentially be used to track electrification at the global scale (Arderne, Zorn, Nicolas, & Koks, Citation2020), and population dynamics (Stathakis & Baltas, Citation2017; Stevens, Gaughan, Linard, & Tatem, Citation2015). Yearly population density data are now available via either satellite-derived products or national census data in Japan, allowing high-accuracy tracking of indicators (Ministry of Land, Infrastructure, Transport and Tourism (MLIT), Citation2021; WorldPop, Citation2021). Some ESDGVs are hard to derive from EO data. In this case, census/statistics or sensor data may be required for computation.
It was reasoned that the next generation of Digital Earth will not be a single system but multiple interconnected infrastructures based on open access and participation across multiple technological platforms that will address the needs of different audiences (Craglia et al., Citation2012; Goodchild et al., Citation2012). In fact, Digital Earth is, in many ways, similar to the “digital ecosystem” which is defined as “a complex distributed network or interconnected socio-technological system” enabled by a range of frontier technologies () (Campbell & Jensen, Citation2019). For this vision to become a reality, multiple stakeholders must take deliberate action and collaborate to build a global digital ecosystem for the planet which consists of data, infrastructure, rapid analytics, and real-time insights. It must connect individual data sets with analytics in order to create robust and timely insights and knowledge such as monitoring and simulation of policy options. The concept of Digital Earth Reference Model (DERM) defined by Tim Foresman, which aims to define a fixed global reference frame for the Earth, could support this ecosystem (Evans, Citation2001). This emphasizes interconnectivity and interoperability among systems. Therefore, an individual platform is positioned to work in a digital ecosystem. A diagram of the platform architecture is shown in , comprising three layers:
Figure 2. Global Digital Earth ecosystem
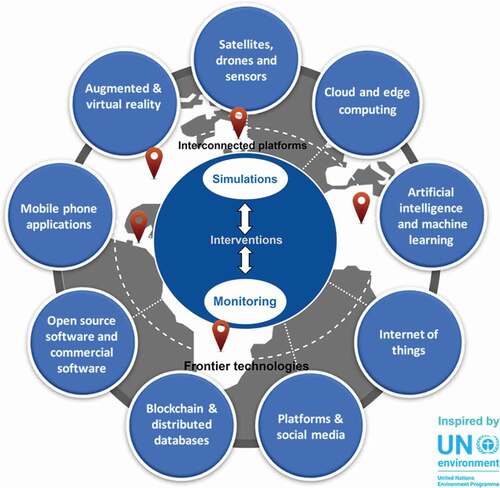
Figure 3. Architecture of the proposed platform
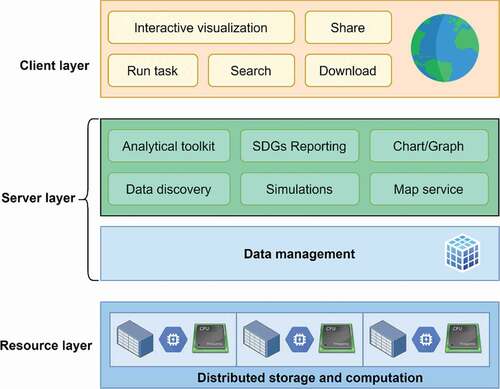
Resource layer – Includes hardware infrastructure and data resources.
Server layer – Consists of a management layer and a service layer. Data is indexed in the management layer. On top of that, the service layer provides information/knowledge retrieval functionality, which includes SDGs indicators reporting, analytical tools, chart/graph drawing, simulations, and map services. The services contain two main purposes of Digital Earth: to support monitoring SDGs and simulations for policy options.
Client layer – Used with a web browser, this provides users with a handful of tools, including interactive visualization on 2D/3D maps, share/search/download map/data options, and the ability to run server-side tasks (analysis, reporting).
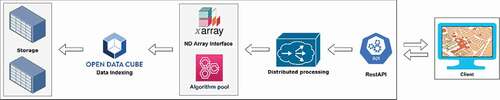
A typical EO analysis flow is displayed in . A request for analysis is first made in the browser to a RestAPI. This request is then executed in the server side by the corresponding algorithm program. Distributed processing is involved for improved performance and better utilization of the hardware infrastructure. For EO data management, Open Data Cube is employed. ODC is an open-source Geospatial Data Management and Analysis Software project, originally conceived by Geoscience Australia. It is currently maintained in a partnership between the Committee on Earth Observation Satellites (CEOS), Geoscience Australia, the Commonwealth Scientific and Industrial Research Organisation (CSIRO), the United States Geological Survey (USGS), the National Aeronautics and Space Administration (NASA), Catapult Satellite Applications, and Analytical Mechanics Associates (AMA) (Open Data Cube, Citation2020). ODC uses PostgreSQL database to index data and metadata. Earth observation data can be stored in either Network Common Data Format (NetCDF) or cloud-optimized Geotiff format. Data is loaded into computer memory as an N-dimensional data array by xarray library. Xarray integrates with Dask to support parallel and streaming computations on datasets that do not fit into memory (Xarray, Citation2021). This is used to facilitate large-area analysis, as the amount of data to be analysed often exceeds memory capacity. The result is delivered to the web browser in the form of a map service which is then visualized on the client browser (TerriaJS).
Figure 4. Processing flow of a typical analysis
4. Demonstration of application services in support of the SDGs
In this section, we present two specific examples of application services in the proposed Digital Earth platform in support of the SDGs. The first focuses on utilizing satellite-derived nighttime-light data to assess the impact of the coronavirus pandemic lockdown on three metropolitan regions in Japan. The second application service show ways that could be used to assess the impacts of climate change on Japan’s electric power transmission grid.
4.1. Monitoring nighttime-light intensity changes during the pandemic lock-down in Japan
Starting in early 2020, the coronavirus pandemic brought about significant impacts on economic and human life. It has been suggested that the pandemic will have severe negative impacts on 13 out of 17 SDGs (Sachs et al., Citation2020). In this section, we utilize Visible Infrared Imaging Radiometer Suite (VIIRS) nighttime-light data to analyse the impact of the coronavirus lockdown in Japan. VIIRS data have been useful in estimation of socio-economic indicators including GDP which is an proposed ESDGV (Bennett & Smith, Citation2017; Duc, Chuc, & Fukui, Citation2020). GDP directly relates to SDG indicator 8.1.1 and contributes to about 15 other SDGs indicators.
We present a preliminary analysis using nighttime light data. We used monthly composite VIIRS images from January, 2020 to April 2021 as input data to monitor nighttime light changes by comparing before, during and after the lockdown, which started on April 7, 2020, in Tokyo and Osaka and April 14 in Aichi, and ended on May 21 and 14, respectively. For comparison, mobility trend data provided by Apple Inc. is used. This data contains daily mobility trend changes in percent as compared to January 13, 2020, by type, for many prefectures, including the areas of this study (Tokyo, Aichi, and Osaka). Furthermore, NO2 air pollution data from Sentinel 5P was also used for comparison (ESA, Citation2021). The methodology consists of several steps: noise filtering, total light intensity summarisation, and image differentiation. Noise filtering is a necessary step to remove the strong bias of noise in analysis in VIIRS nighttime light data. A noise filtering method is implemented following the algorithm described in previous studies (Duc et al., Citation2020; Elvidge, Baugh, Zhizhin, Hsu, & Ghosh, Citation2017). The total light intensity trend is then compared to mobility trend data and NO2 data.
The results show that there was decrease in nighttime-light intensity in the three metropolitan regions during the lockdown period (). Tokyo and Osaka have continuously decreasing light intensity from March to May, similar with the timing of the pandemic lockdown period in the metropolitan regions, with the exception of January (around New Year, which elicits different behavioral patterns). Comparing May to February, Tokyo saw a decrease of approximately 12.08% in light intensity, the largest drop of the three metropolitan regions. The closures of schools, restaurants, travel, and commercial centers possibly contributed to this dimming of light, which is also observed in China (Elvidge, Ghosh, Hsu, Zhizhin, & Bazilian, Citation2020). Light intensity seemed to recover early in May in Aichi, the earliest region to end the lockdown. This phenomenon is also observed in NO2 and mobility trend data, where mobility recovered almost to the level of the reference date. Meanwhile, Tokyo and Osaka showed a slower recovery, as these metropolitan regions ended their lockdowns later, near the end of May. In general, air pollution (NO2) data and mobility data also showed similar trends to nighttime-light. However, nighttime light and NO2 showed higher similarity throughout the whole period. A system for integrated assessment and visualization of these impacts would be useful for monitoring of the SDGs (), and more implementation is needed to address this.
Figure 5. Comparison of nighttime-light change data and mobility trend data
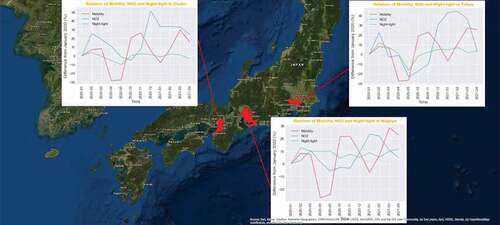
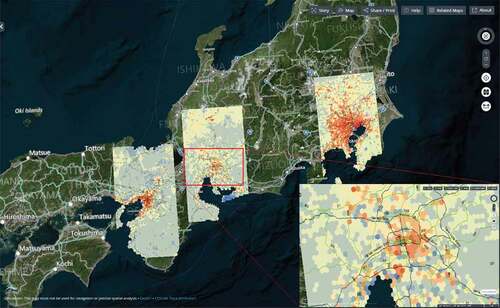
Figure 6. Visualization of changes in nighttime light intensity in three metropolitan regions from February to May 2020, using the proposed Digital Earth platform
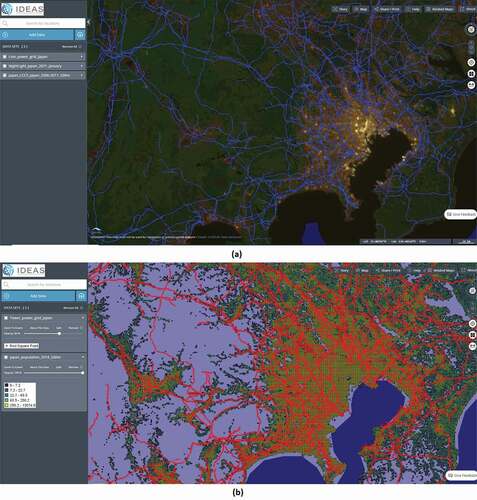
Besides economic activity monitoring, nighttime lights could combine with population and electricity infrastructure layers (also two ESDGVs) to support SDG 7, target 7.1 and indicator 7.1.1 (). Estimation method for SDG indicator 7.1.1 will need integration in the platform for continuous monitoring.
Figure 7. Nighttime lights, population and electricity infrastructure layers to support SDG 7
4.2. Assessment of potential impacts of climate change on electric power transmission in Japan
A paper on a global indicator framework for the SDGs listed tackling climate change as one of the primary goals for sustainable development (United Nations, Citation2020). The electricity infrastructure be may yet another sector adversely affected by climate change. Warmer future temperatures are increasing the frequency of extreme heat and drought events, which can impair power generation and transmission capacity while at the same time increasing electricity demand (Bartos et al., Citation2016; Dirks et al., Citation2015; Oakes, Citation2009; Sathaye et al., Citation2011). There are no SDGs target or indicator that directly focuses on this problem. The most relevant goal and target is SDG 13, target 13.1 and indicators 13.1.2, 13.1.3 which only mention policy implementation aspect. However, to address the SDGs policy for energy sector, we need multiple simulation scenarios of climate change impacts on the electricity infrastructure which is also a proposed ESDGV.
In application service for this study, the focus is to assess the impacts of future temperature rises on the transmission grid. Air temperature increases may cause losses of rated ampacity, the current-carrying capacity under given ambient temperature and wind conditions, as described in study that developed a model to estimate the impacts for about 80% of U.S. aerial transmission lines (Bartos et al., Citation2016). This approach combined thermal models of representative conductors and future projections of ambient air temperature to calculate these capacity reductions, and found that summertime transmission capacity may be reduced by 1.9%–5.8% by mid-century.
In this study, we aim to do similar research for Japan’s transmission grid. The rated ampacity change is estimated based on a thermal balance model developed by (Bartos et al., Citation2016) as:
where I is the current transferred through the conductor, h is the average heat transfer coefficient, D is the cable diameter, Tcond is the conductor temperature, Tamb is the ambient air temperature, ε is the emissivity of the conductor surface, σ is the Stefan–Boltzmann constant, δ is the incident solar radiation, as is the absorptivity of the conductor surface, and R(Tcond) is the resistance of the conductor at a given conductor temperature. According to the research, many assumptions need to be made, including wind speed and solar radiation.
Input data required for this application service consists of a spatial layer of transmission line, voltage class, and future projections of air temperature. We used OpenStreetMap (OSM) transmission layer data in this study. While OSM data has voltage class information for many transmission lines, it lacks the model names. Therefore, we compiled information on several representative cable models for high-voltage transmission lines in Japan (), based on available information (Akagi, Citation2002). This utilizes two types of widely used cables, Aluminum Conductor Steel Reinforced (ACSR) and Thermal Resistant Aluminum Alloy Conductor Steel Reinforced (TASCR), the latter having a higher maximum operating temperature.
Table 2. Representative properties of transmission cables employed
For climate projection data, we used the Global Warming Prediction Information 9 data, produced by the Japan Meteorological Agency (Japan Meteorological Agency (JMA), Citation2021). This data includes 1 km-resolution air temperature by day (maximum, average, minimum) for 1980–2000 and 2075–2095. An average scenario of daily maximum temperatures of summertime (August) is calculated for each period. This is used as the Tamb parameter. It is predicted that under the RCP8.5 scenario, the average maximum temperature in summertime may be 3.7°C higher in the 2075–2095 period (average 30.5°C) than in the 1980–2000 period (average 26.8°C). This may possibly increase the frequency of occurrence of extreme high temperatures in Japan, which in recent years exceeded 41°C in some places.
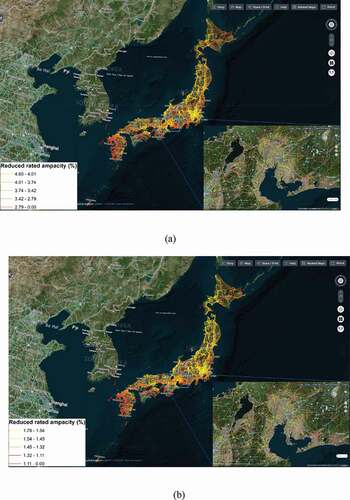
Our results indicated average reductions in rated ampacity between 2.7% and 4.6% for ACSR cables, much higher than the 1.1% to 1.8% for TACSR cables (). In general, lines located in urban areas are most vulnerable, as temperatures are often hotter than in rural areas. If the cable type information is available in future, it will help determine the impacts more accurately. Generally, TACSR lines are more adaptive to future temperature increases, and play a role in future power system optimization, especially as the energy sector works to achieve Japan’s recently announced carbon neutral target for 2050 set by the government. In future analysis, more climate projection data from different models should be employed to provide multiple scenarios for adaptation plans.
Figure 8. Visualization of power line capacity change for a 3.7°C warming scenario for (a) ACSR and (b) TACSR transmission cables
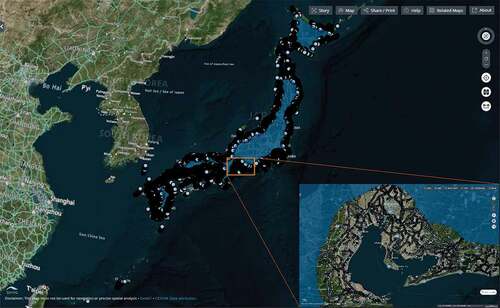
In addition to transmission cables, power transmission towers could become more vulnerable as hurricanes, typhoons, or strong winds become more frequent due to climate change. In recent years, some transmission towers have been destroyed by strong typhoons (The Mainichi, Citation2019) which was unprecedented. More than 50% of about 500,000 transmission towers in Japan are located in the windy zone (less than 25 km from the coastline) (). These facts are raising warnings about the grid system, which may need significant updates and maintenance to deal with the risks. Challenges such as these require simulation and testing of future scenarios to support policy design. Furthermore, while interventions are proposed in specific domains, i.e. climate change (e.g. Drawdown Project, Citation2021), SDGs monitoring and implementation systems using the proposed Digital Earth platform could serve in monitoring the performance of the interventions. In all of this, a Digital Earth system could play an important role.
Figure 9. Transmission towers in Japan located within 25 km of a coastline
5. Conclusion
In this study, we proposed a Digital Earth system as a platform to support SDGs monitoring and implementation. The system was designed to facilitate a hierarchical data flow which allows separation of policy-based indicators, targets and goals from a broad and diverse set of multimodal input data. This is made possible with the introduction of an Essential Variables layer, which contains a finite set of EVs for sustainable development. We also presented examples of how such a system can support detailed analysis for some SDGs and proposed a set of ESDGVs for monitoring of the indicators. We then introduced several studies to illustrate application services of the platform.
Much work remains to be done in the future, including establishing a complete set of ESDGVs and corresponding estimation methods. This is essential to facilitate cooperation across domains by goal-based as well as expert-based approaches (Plag & Shelley-Ann, Citation2020). It will also be important to cooperate on SDGs monitoring with solution-side implementation to monitoring the performance of the interventions/disturbances to better ensure a “safe operating space for humanity” (Rockström et al., Citation2009).
Supplemental Material
Download MS Word (51.2 KB)Supplemental Material
Download MS Word (30.1 KB)Supplemental Material
Download MS Word (71.1 KB)Disclosure statement
No potential conflict of interest was reported by the author(s).
Data availability statement
The data that support the findings of this study are available on request from the corresponding author – Professor Hiromichi Fukui ([email protected]), upon reasonable request.
Supplemental data
Supplemental data for this article can be accessed here.
Correction Statement
This article has been republished with minor changes. These changes do not impact the academic content of the article.
Additional information
Notes on contributors

Hiromichi Fukui
Dr. Hiromichi FUKUI has graduated from Nagoya University in 1980. He holds a Doctor of Science in Earth Sciences from Nagoya University in 1987. He is a professor of Chubu University and Director of International Digital Earth Applied Science Research Center (called IDEAS) from April, 2011 and Director of Chubu Institute for Advanced Studies from April, 2015. Before joining Chubu University, he was a professor of Faculty of Policy Management under the Graduate School of Media and Governance, and was Research Director of Global Security Research Institute of Keio University. Prof Fukui joined at Keio University in 1996 after STBRI (Sumitomo Trust Banking Research Institute) of the Think Tank in Japan. His current research interests include regional planning, ecological development and global environment and disaster related issues with emphasis on spatial information sciences. Also he has served on Councilor of ISDE (International Society for Digital Earth) and on guest professor of Chinese Academy of Sciences. His specializations are in Geo-spatial Informatics and Environmental Sciences.
Related Research Data
References
- Akagi, Y. (2002). Transition of Overhead Power Transmission Wires. Journal of the Institute of Electrical Engineers of Japan, 122 (3): 172–175.
- Arderne, C., Zorn, C., Nicolas, C., & Koks, E. E. (2020). Predictive Mapping of the Global Power System Using Open Data. Scientific Data, 7(1), 1–12.
- Bartos, M., Chester, M., Johnson, N., Gorman, B., Eisenberg, D., Linkov, I., & Bates, M. (2016). Impacts of Rising Air Temperatures on Electric Transmission Ampacity and Peak Electricity Load in the United States. Environmental Research Letters, 11(11), 11.
- Bauer, P., Stevens, B., & Hazeleger, W. (2021). A Digital Twin of Earth for the Green Transition. Nature Climate Change, 11(2), 80–83.
- Bennett, M. M., & Smith, L. C. (2017). Advances in Using Multitemporal Night-Time Lights Satellite Imagery to Detect, Estimate, and Monitor Socioeconomic Dynamics. Remote Sensing of Environment, 192, 176–197.
- Campbell, J., & Jensen, D. E. (2019). The Promise and Peril of a Digital Ecosystem for the Planet. 2019. https://medium.com/@davidedjensen_99356/building-a-digital-ecosystem-for-the-planet-557c41225dc2.
- CMOS Shop Talk. (2021). Styling COVID-19 and Related Terms. 2021. https://cmosshoptalk.com/2020/04/21/styling-covid-19-and-related-terms/.
- Craglia, M., Kees, D. B., Jackson, D., Pesaresi, M., Remetey-Fülöpp, G., Wang, C., Annoni, A., Woodgate, P. (2012). Digital Earth 2020: Towards the Vision for the next Decade. International Journal of Digital Earth, 5(1), 4–21.
- Dirks, J. A., Gorrissen, W. J., Hathaway, J. H., Skorski, D. C., Scott, M. J., Pulsipher, T. C., … Rice, J. S. (2015). Impacts of Climate Change on Energy Consumption and Peak Demand in Buildings: A Detailed Regional Approach. Energy, 9(C), 20–32.
- Drawdown Project. (2021). Solutions to Reduce the Excess of Greenhouse Gases in the Atmosphere. 2021. https://drawdown.org/solutions/table-of-solutions.
- Duc, M., Chuc, H. T., & Fukui, H. (2020). Normalization of VIIRS DNB Images for Improved Estimation of Socioeconomic Indicators. International Journal of Digital Earth, 1–15.
- Ehrlich, D., Kemper, T., Pesaresi, M., & Corbane, C. (2018). Built-up Area and Population Density: Two Essential Societal Variables to Address Climate Hazard Impact June 2017. Environmental Science & Policy, 90, 73–82. .
- Elvidge, C. D., Baugh, K., Zhizhin, M., Hsu, F. C., & Ghosh, T. (2017). VIIRS Night-Time Lights. International Journal of Remote Sensing, 38(21), 5860–5879.
- Elvidge, C. D., Ghosh, T., Hsu, F. C., Zhizhin, M., & Bazilian, M. (2020). The Dimming of Lights in India during the Covid-19 Pandemic. Remote Sensing, 12(20), 1–17.
- ESA. (2021). Sentinel-5P NRTI NO2: Near Real-Time Nitrogen Dioxide. 2021. https://developers.google.com/earth-engine/datasets/catalog/COPERNICUS_S5P_NRTI_L3_NO2.
- European Commission. (2020). Destination Earth (DestinE). 2020. https://ec.europa.eu/digital-single-market/en/destination-earth-destine.
- Evans, J. D. (2001). New Digital Earth Reference Model. 2001. https://web.archive.org/web/20081010193636/http://www.cartome.org/draft-derm.htm.
- Fukui, H., & Junjiro, T. (2003). Towards Digital Earth --Its’ Ideal, Solutions and Future : AsianVersion Takes Off. In The 3rd International Symposium on Digital Earth, 237–45, Brno, Czech Republic.
- Geospatial World. (2021). Geospatial World Magazine. Vol. 11.
- Giuliani, G., Egger, E., Italiano, J., Poussin, C., Richard, J. P., & Chatenoux, B. (2020). Essential Variables for Environmental Monitoring: What Are the Possible Contributions of Earth Observation Data Cubes? Data, 5(4), 1–25.
- Global Climate Observing System (GCOS). (2020). Essential Climate Variables. 2020. https://gcos.wmo.int/en/essential-climate-variables.
- Global Ocean Observing System (GOOS). (2021). Essential Ocean Variables. Global Ocean Observing System. 2021. https://www.goosocean.org/index.php?option=com_content&view=article&id=14&Itemid=114.
- Goodchild, M. F., Guo, H., Annoni, A., Bian, L., Kees, D. B., Campbell, F., Craglia, M., Woodgate, P. (2012). Next-Generation Digital Earth. Proceedings of the National Academy of Sciences of the United States of America, 109(28), 11088–11094.
- Group on Earth Observation - Global Water Sustainability (GEOGloWS). (2021). Working Group 3: Essential Water Variables and Observations. 2021. https://www.geoglows.org/pages/workinggroup3.
- The Group on Earth Observations Biodiversity Observation Network (GEO BON). (2018). What Are EBVs? 2018. https://geobon.org/ebvs/what-are-ebvs/.
- Institute for Global Environmental Strategies (IGES). (2021). SDG Interlinkages Web Tool. 2021. https://sdginterlinkages.iges.jp/project.html.
- Japan Meteorological Agency (JMA). (2021). Global Warming Forecast Information. 2021. https://www.data.jma.go.jp/cpdinfo/GWP/index.html.
- Lehmann, A., Masò, J., Nativi, S., & Giuliani, G. (2020). Towards Integrated Essential Variables for Sustainability. International Journal of Digital Earth, 13(2), 158–165.
- The Mainichi. (2019). Typhoon Cuts Power to over 600,000 Homes, 89,000 Have No Water in Central, East Japan. 2019. https://mainichi.jp/english/articles/20190910/p2a/00m/0na/008000c.
- Ministry of Land, Infrastructure, Transport and Tourism (MLIT), National Land Information Division, National Spatial Planning and Regional Policy Bureau. (2021). Estimated Population by 1km. 2021. https://nlftp.mlit.go.jp/ksj/index.html.
- Oakes, T. (2009). Climate Change 2007: Impacts, Adaptation and Vulnerability. International Encyclopedia of Human Geography. https://doi.org/10.1016/B978-008044910-4.00250-9.
- Open Data Cube. (2020). Open Data Cube. 2020. https://www.opendatacube.org/about.
- Plag, H.-P., & Shelley-Ann, J.-P. (2020). A Goal-Based Approach to the Identification of Essential Transformation Variables in Support of the Implementation of the 2030 Agenda for Sustainable Development. International Journal of Digital Earth, 13(2), 166–187.
- Reyers, B., Stafford-Smith, M., Erb, K. H., Scholes, R. J., & Selomane, O. (2017, May). Essential Variables Help to Focus Sustainable Development Goals Monitoring. Current Opinion in Environmental Sustainability, 26–27, 97–105.
- Rockström, J., Steffen, W., Noone, K., Persson, Å., Chapin, F. S., Lambin, E. F., Lenton, T. M. Foley, J. A. (2009, September). A Safe Operation Space for Humanity. Nature, 461(7263), 472–475.
- Sachs, J., Schmidt-Traub, G., Kroll, C., Lafortune, G., Fuller, G., Woelm, F. (2020). Sustainable Development Report 2020. Sustainable Development Report 2020. Cambridge: Cambridge University Press. https://s3.amazonaws.com/sustainabledevelopment.report/2020/2020_sustainable_development_report.pdf.
- Sathaye, J., Dale, L., Larsen, P., Fitts, G., Koy, K., & Lewis, S. (2011, June). Estimating Risk To California Energy Infrastructure From Projected Climate Change. In CEC Publication CEC-500-2012-057.
- Stathakis, D., & Baltas, P. (2017). Seasonal Population Estimates Based on Night-Time Lights. Computers, Environment and Urban Systems, (June), 1–9. https://doi.org/10.1016/j.compenvurbsys.2017.12.001
- Stevens, F. R., Gaughan, A. E., Linard, C., & Tatem, A. J. (2015). Disaggregating Census Data for Population Mapping Using Random Forests with Remotely-Sensed and Ancillary Data. https://doi.org/https://doi.org/10.1371/journal.pone.0107042.
- Takasu, Y., et al. (2020). SGDs and Japan: Human Security Indicators for Leaving No One Behind. JICA Ogata Sadako Research Institute for Peace and Development.
- United Nations. (2020). Global Indicator Framework for the Sustainable Development Goals and Targets of the 2030 Agenda for Sustainable Development. Work of the Statistical Commission Pertaining to the 2030 Agenda for Sustainable Development. https://unstats.un.org/sdgs/indicators/indicators-list/
- WorldPop. (2021). Population Density Data. 2021. https://www.worldpop.org/geodata/listing?id=76.
- Xarray. (2021). Parallel Computing with Dask — Xarray. 2021. http://xarray.pydata.org/en/stable/dask.html.