
ABSTRACT
The ocean is a critical part of the global ecosystem. The marine ecosystem balance is crucial for human survival and sustainable development. However, due to the impacts of global climate change and human activities, the ocean is rapidly changing, which poses an enormous threat to human health and the economy. “Conserve and sustainably use the oceans, seas and marine resources” is one of the 17 Sustainable Development Goals (SDGs). Therefore, it is urgent to construct a transformative marine scientific solution to promote sustainable development. Marine data is the basis of ocean cognition and governance. Marine science has ushered in the era of big data with continuous advances in modern marine data acquisition. While big data provides a large amount of data for SDG research, it simultaneously brings unprecedented challenges. This study introduces an overall framework of a system for solving the current problems faced by marine data serving SDGs from the perspective of marine data management and application. Also, it articulates how the system helps the SDGs through two application cases of managing fragmented marine data and developing global climate change data products.
1. Introduction
The 17 Sustainable Development Goals (SDGs), adopted by all United Nations Member States in 2015, involve an enormous, complex, diverse, dynamic, and interrelated research system. The effective measurement and monitoring of each goal is the most effective approach to achieving the SDGs. SDG research is interdisciplinary, involving resource management, the environment, biology, ecology, society, the economy, humanities, and many other domains. Moreover, the scope of research is typically global, and achieving the SDGs increasingly relies on systematic and reliable primary global data (Guo, Citation2017, Citation2020; Jia, Citation2020; Merritt, Bi, Davis, Windmill, & Xue, Citation2018; Wang & Yan, Citation2020).
Oceans cover 71% of the Earth’s surface and absorb over 90% of global heat from solar radiation. The ocean global circulation system is a crucial regulator of the weather system and an essential part of the Earth (IPCC (Intergovernmental Panel on Climate Change), Citation2013; Leng & Xu, Citation2021; Rhein, Rintoul, & Aoki et al., Citation2013; Schuckmann et al., Citation2016; Trenberth, Fasullo, & Balmaseda, Citation2014). Therefore, the ocean contribution to global climate change regulation is attracting greater attention. They also play a key role in guaranteeing life on the planet. Changes in the marine environment and restoring the marine ecosystem balance are critical for human survival and sustainable development. To further strengthen the implementation of the SDGs, in December 2017, the United Nations General Assembly proclaimed a Decade of Ocean Science for Sustainable Development (2021–2030) (hereafter referred to as “Ocean Decade”) (UNESCO, Citation2020) with seven goals, including establishing a clean, healthy, predictable, safe, and accessible ocean. It is vital to describe the past and current ocean conditions and predict future ones using historical, contemporary, and modeling data to realize the goals of the Ocean Decade.
With the rapidly advancing marine observation and simulation techniques, marine data are growing exponentially. Comprehensive, continuous, multi-source, and three-dimensional observation enables the currant marine data to reach the exabyte level and the daily increase to the terabyte level. Marine science has ushered in the era of big data (Liu, Chen, Liu & Tian., Citation2020; Qian & Chen, Citation2018), providing a large amount of data to support SDG research. However, many problems remain in marine big data organization, management, mining, and utilization, leading to SDG research difficulties. The issues are summarized as follows.
1) Data resource creations are insufficient, and data opening and sharing degrees are low. Data sharing and opening can ensure that all research group types can obtain data, data products, and services. However, because countries and institutions exhibit different data opening policies and data integration and sharing abilities, data and information exchange levels vary significantly across regions. In Europe and North America, over 90% of data centers contain data and information exchange activities. In the United States, the National Aeronautics and Space Administration (NASA) and its Earth Observing System (EOS) have established the EOS Data and Information System. The National Center for Environmental Information integrates global atmospheric, oceanic, coastal, and geophysical data, and it contains the largest open World Ocean Database (WOD) worldwide. The British Oceanographic Data Centre, French National Centre for Space Studies, German Aerospace Center, Canada Centre for Remote Sensing, and Canadian Space Agency have also shared various marine data products on a unified platform. The European Union has established a marine data management framework composed of SeaDataNet, EMODnet and Copernicus CMEMS. What’s better is the SeaDataNet adopt the common communication standards and adapted technology to ensure the platforms interoperability, effectively promoting global marine science research and development. EMODNET portal uses semi-automatic way to identify and contact potential marine data providers actively, and acquire new data and key data sets (Han, Liang, & Zheng et al., Citation2020). However, Latin America and the Caribbean have less than 50% sharing of their open data. In some other least developed regions, the proportion is even lower. Their data acquisition and processing capacities are far behind developed regions, such as Europe and the United States (IOC-UNESCO, Citation2020). The lack of a unified data processing and sharing platform limits open data usage.
2) Many marine data quality problems exist in the absence of an internationally recognized optimal scheme. There are many sources of international marine data, and different countries and organizations have various data acquisition and quality control (QC) methods. A large proportion of abnormal observational data exist due to human error, instrument error, varying observation environments, and other reasons, resulting in uneven data quality. Many countries and agencies have released ocean observing databases, such as the WOD, Global Temperature and Salinity Profile Programme (GTSPP), Argo Float Database, and etc. (Argo, Citation2020; Boyer, Baranova, & Coleman et al., Citation2018; Good, Martin, & Rayner, Citation2013; Gouretski, Citation2018; UNESCO-IOC, Citation2010). These databases were released after QC using different techniques and have been widely used in physical oceanography, climate change, and other studies. The international consensus is that severe quality problems are present in these widely used international ocean databases. The International Quality Controlled Ocean Database (IQuOD) was used to perform a comprehensive evaluation of commonly used data QC methods worldwide by comparing the true-positive rate (TPR) and false-positive rate (FPR). The results demonstrate that the current mainstream QC techniques do not consider the optimal state of QC with a high TPR and low FPR (Simon, Citation2019). Thus, current data QC techniques fail to meet the high-quality data needs of modern marine science.
3) The current multi-source data analysis and application competencies are insufficient, and the application of artificial intelligence (AI) and big data in the marine field is still in its infancy. The research objects of modern marine science are broader and deeper in time and space. Developing multi-scale marine information mining techniques and efficient, quick, and intelligent applications are the bottleneck problems in marine science. AI is an essential driving force for a new round of scientific and technological revolution and industrial transformation. It is also widely used in various fields such as science and technology, economy, etc. However, marine AI and big data applications in marine sciences are in the initial stage of development. The National Oceanic and Atmospheric Administration (NOAA) of the United States released its AI strategy in 2021(NOAA, Citation2021), aiming to leverage AI in demand-driven prioritized tasks. NOAA strives to reduce marine data processing costs through this AI strategy and provide high-quality and timely scientific products and services for society. Google, IBM, and other international companies have applied AI techniques to weather forecasting, precipitation forecasting, and etc. The integration of AI and marine big data analysis and mining technologies has become a new growth point for the practical application of marine big data (Li et al., Citation2020).
The Center for Ocean Mega-Science, the Chinese Academy of Sciences (CAS), constructed a marine big data management and application service system. This study first introduces the overall framework of the marine big data management and application service system. Then, we focus on the demonstrated applications of this system in data aggregation and management, marine data QC, and ocean disaster prevention to address several challenges in current marine data management and application.
2. Marine big data management and application service system
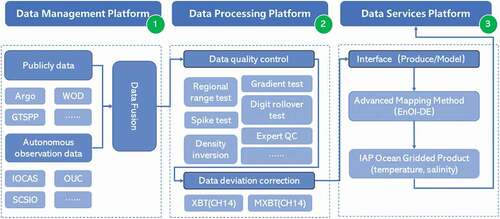
The proposed marine big data management and application service system encompasses three sections (): a data management platform, a data processing platform, and a data service platform. The system’s primary function is to automatically perform multi-source data aggregation, integration, QC, and product development. Additionally, the system can provide high-quality marine observational data and data products for scientific researchers, government agencies, and social groups through a unified data service platform (). Further, the findings of different researchers, such as mathematical models and AI algorithms, can be transformed into a visualized decision support system for governments, enterprises, etc., offering services for marine health assessment, disaster prevention, and mitigation.
Figure 1. Overall framework of marine big data management and application service system. The green numbers (1, 2, and 3) represent the three platforms of the system. The contents of the orange numbers will be described in Sections 3.1 and 3.2
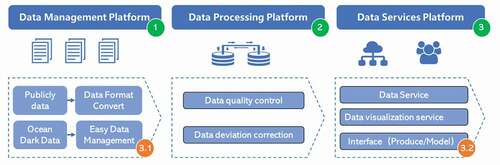
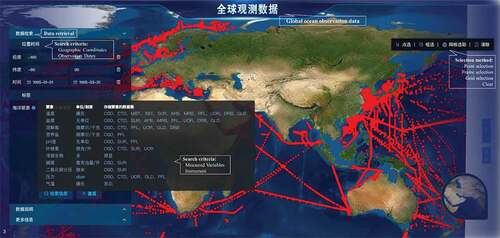
Figure 2. Marine data retrieval and download service interface (msdc.qdio.ac.cn/search-field). The left side includes the query conditions and the right side shows the query results
2.1. Data management platform
The data management platform is designed to perform real-time aggregation and standardization of multi-source data and construct the initial ocean observation database. SDG research is typically large-scale and multidisciplinary, requiring data support from various sources. It typically involves marine survey data, such as ship-based survey data, buoy data, ocean station data, and model reanalysis data. The proposed system formulates the automatic data format conversion method to standardize the multi-source and multi-type marine environment historical data. The data are simultaneously sorted and marked according to the data source, subject, data usage, and etc.
The primary data types are as follows:
Public data. This data type refers to data released by different data centers or agencies with fixed data sources and regular updates. The data has been standardized in a fixed format. The platform cooperates with data publishing agencies to automatically obtain the latest daily public data. The obtained data are reorganized according to the system format. At the same time, the data source is marked in the data service system. We require users to quote in accordance with the requirements of data owners.
Ocean dark data. Dark data is data that has not been sufficiently explored or understood. In marine scientific research, dark data refers to the scattered data generated by researchers that cannot be effectively archived or saved. The ocean dark data management platform was developed (Easy Data-Management (EasyDM), see Section 3.1 for details) to handle this data type. Data owners can independently integrate and manage the data and authorize the data-use scope.
These data management methods can effectively expand data source channels and standardize and unify data from different sources. They also shorten the data collection and compilation times. In order to ensure the data security, all the data collected by the data center are protected by the unit firewall and the data center firewall. On the other hand, when using EasyDM system for personal data aggregation, all operations are carried out in the internal network of the unit and included in the data resource pool after being checked by the data center. At the same time, we manage the data resources at different levels, including public sharing, protocol sharing, and classified data. The public sharing data allows users to directly access. For protocol sharing data, users can access the metadata, but they cannot directly access the data resources. These data need to be distributed to users by managers after authorization. The classified data is stored in the confidential computer alone and cannot be accessed on the Internet.
2.2. Data processing platform
The primary functions of the data processing platform are to control the quality of multi-source data and build a high-quality ocean observation database. High-quality marine observational data is the foundation of SDG research. Due to the quality issues of commonly used global data, priority should be given to parameters with a high usage frequency and a wide range of applications. Therefore, we conducted research and developed a multi-parameter data QC technique. The parameters include marine hydrology, marine geology, and marine chemistry, and they are described in detail as follows.
Marine hydrology (Temperature and Salinity) data exhibits regional variations and periodic seasonal characteristics. Therefore, we developed a new data QC module including different data characteristics: range, peak, equivalence, gradient, maximum depth, regional meteorology, and regional gradient meteorology checks.
Marine geology (Water Depth) data is predominately fixed and unchanged. Our proposed platform incorporates satellite altimetry data to determine the initial data fields. It uses the Expert–Machine combination method to perform QC and form a data QC module, including an extreme value check, eigenvalue distribution check, track map diagnosis, and adjacent voyage comparison check.
Marine Chemistry (Oxygen, Nitrate and Nitrite, Silicate, pH, Chlorophyll and Phosphate) data exhibits regional and seasonal variations, particularly in coastal areas, which are greatly affected by human activities and land-based materials. Therefore, the platform checks the data completeness, data scope, regional meteorology, geographical correlation, time scale correlation, and parameter correlation of this data type.
We constructed a high-quality ocean observing database after the QC and deviation correction of the initial ocean observing data (Zhang, Cheng, et al., Citation2020). The data-sharing service is provided through the data service platform described in Section 2.3.
2.3. Data service platform
The data service platform provides convenient data acquisition and system platform services for different user groups. The platform is divided into two types of based functions: the data resource service platform and data visualization service platform, which are described in detail below.
The data resource service platform offers external data management services and conducts the online operation processes (msdc.qdio.ac.cn) such as data collection, browsing, application, and audit. In addition, this platform provides a high-quality global ocean observing database (Section 2.2) with download service, map research and diversified data retrieval. Users can locate target data through multiple parameters such as classification label, attribute, space-time range, and survey platform, and they can download the results online. This platform also provides an online data Digital Object Identifier (DOI)/ China Science and Technology Resource (CSTR) registration service. All the data submitted to this platform will be registered with DOI/CSTR to identify the data source. When users use data, we ask them to identify the data source and reference the data. In this way, we hope that as far as possible to strengthen data intellectual property protection and protect the rights and interests of data owners.
Data visualization platform. Based on the Cesium data visualization system (https://cesium.com/platform/cesiumjs/), we present a component-based interactive visualization structure for multidimensional and spatiotemporal ocean data based on Cesium 3D Platform. It is free and has rich data visualization plug-ins. Based on this structure, users can customize the system to visualize other scientific data in a rapid manner. On the one hand, it can display all marine environmental monitoring data types in real-time. On the other hand, it can integrate warning models and forecast marine disasters such as offshore marine ecological disasters and dynamic disasters (http://casearthocean.qdio.ac.cn/oceanVisual). Thus, this platform can intuitively display the early warning information for marine disaster prevention and mitigation.
2.4. System architecture
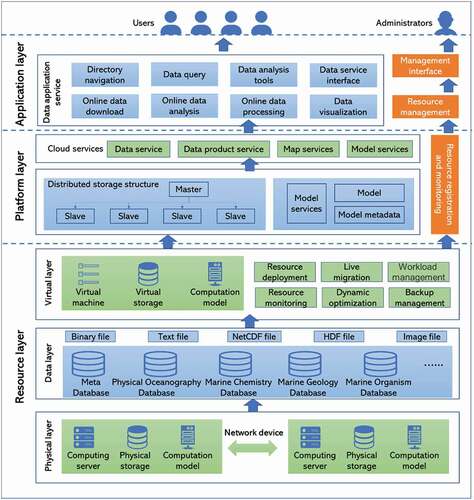
The overall architecture of the marine big data management and application service system includes resource layer, platform layer and application layer ().
The resource layer is the foundation of the whole service architecture. Its main function is to provide computing, storage and data service resources for the platform layer. The resource layer is further divided into physical layer, data layer and virtual layer. The physical layer includes computing server, physical storage, high-speed network and computing model. The data layer integrates the existing data resources, stores data in the storage system based on the unified data storage model. Through virtualization technology, the virtual layer integrates different nodes and heterogeneous physical resources to form a large resource pool for the platform layer.
The platform layer is the middle layer connecting the resource layer and the application layer. The platform layer includes three parts: cloud service, cloud platform and resource registration and monitoring. Cloud services mainly provide data services, data loading services, data query services, computing services and model services. The platform contains a distributed data storage structure, which stores the data on each node in a distributed way. The data are readed and processed directly from each node during data access. In the master-slave database, the master is responsible for the load of the write operation, while the read operation is completed by the slave to ensure the security of the data.
The application layer is the top layer of the whole framework. The application layer provides an interactive interface for users through the user interface. At the same time, it provides a management interface for administrators through the management interface to manage the permissions of users and all resources in the management system. Users can query data resources to meet their own needs in various forms. The system also provides online model calling function to realize complex service functions such as online data processing, calculation simulation and analysis.
Figure 3. The architecture of the marine big data management and application service system
3. Applications of the data system
An integrated marine big data management and application service system is built to aggregate and share marine data effectively. This system also offers enormous marine data and technical support for SDG research, particularly to achieve the Ocean Decade goals. This section explains the applications of the system through two cases.
3.1. EasyDM serves Ocean Decade
“One accessible ocean”, which refers to open and fair access to ocean-related data, information, technology, and innovation, is one of the seven goals of the Ocean Decade. Inequalities in marine science must be eliminated by simultaneously advancing data acquisition and QC. Additionally, data collection, knowledge generation, and technology development skills must be enhanced, particularly in the least developed countries, small island developing states, and landlocked developing countries.
Each developed coastal country has established a national data center to aggregate and integrate its marine data effectively. However, much data remains scattered throughout various research institutions. Researchers own some data. These data can be categorized as ocean dark data, which cannot be aggregated to a data center for unified management. Data owners often lack the workforce and technology to manage data effectively, leading to wasted data resources. This problem is more prominent in less developed countries.
Therefore, an intuitive ocean dark data management platform Easy Data-Management (EasyDM), was designed and developed to standardize data management and sharing. The platform system adopts C/S(Client/Server) architecture design and development. The primary server is in the data center; thus, the researchers do not need to purchase new equipment for data storage.
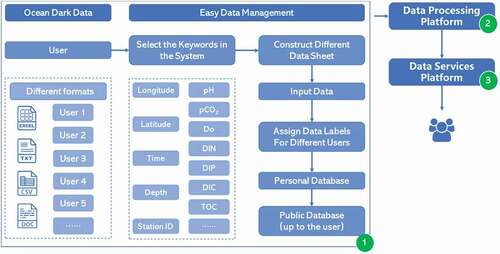
The proposed system was jointly constructed and managed by the data owners and centers. In addition, the system was embedded with common marine survey data keywords and data record formats (e.g. longitude and latitude record format, measurement unit, record length, and etc.). Users can dynamically customize a data storage sheet by selecting the embedded keywords according to the topic data. After converting the original data to the selected data format, users upload the data independently by hitting a button. The system then automatically establishes the database for data storage.
The system contains built-in data and a user management system (). The data and users are classified and set using different labels. Each user can customize his/her data usage (e.g. public sharing, protocol sharing, personal use, etc.) and scope. The public sharing data is incorporated into the unified management platform owned by the data center, and the data service platform offers external services. Regarding the data sharing protocol, the metadata information is released through the data service platform. When other users apply for data usage, the data center provides data sharing services with the data owner’s consent. Concerning data for personal use, only the data owner can browse and use the data.
Figure 4. Workflow of ocean dark data management by different users using EasyDM system
This system solves the problem of data resource loss caused by a lack of data management technology. Additionally, the proposed system organizes massive historical data resources, which helps users manage data and significantly increases user initiatives for data sharing, thus expanding the data resource pool.
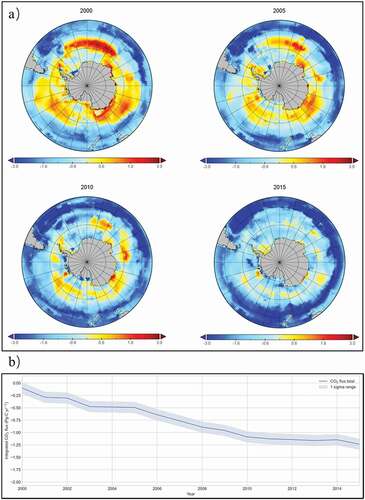
At present, the system has been applied to the marine chemistry data management of the Institute of Oceanology, CAS. After integrating the self-owned data with the international shared data, a marine chemistry database containing over 19 million data points was established to support global ocean acidification research () (Zhong et al., Citation2020; Wang et al., Citation2021). Marine researchers in different countries can further optimize this system to promote the management and sharing of marine data and support the Ocean Decade.
Figure 5. The pCO2 data products based on this platform (Wang et al., Citation2021). a) Mean Sea surface CO2 fluxes (Pg C) in 2000, 2005, 2010, 2015 in the Southern Ocean. b) Trends in CO2 flux of the Southern Ocean during 2000–2015
3.2. Building marine grid data products to serve SDG 13 research
Research on ocean environmental change is a critical part of SDG 13: climate action. A gridded temperature/salinity database, such as WOA, EN4, and Ishii, with complete global ocean coverage is a critical foundation for studying climate change and sea-level rise. However, due to limited data quantity and quality, analysis results exhibit high levels of uncertainty. For example, the mainstream ocean temperature data products cannot identify a reliable long-term trend in the upper ocean between 0–700 m depth. The uncertainty of the deep-sea between 700–2000 m is even greater. This uncertainty is predominantly due to the systematic deviation of observational data, the lack of observational data from the last century, and data quality issues (Zhang, Wang, & Cheng et al., Citation2017).
Researchers from the Institute of Atmospheric Physics, CAS, and the Institute of Oceanography, CAS, constructed an automatic data product development system() that provides monthly ocean temperature and salinity grid data products.
Figure 6. Development process of marine data products based on this system
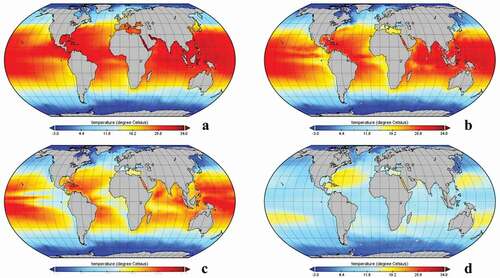
Researchers called the temperature and salinity observational data through the data service platform. After data QC and deviation correction, the researchers employed the ensemble optimal interpolation method with a dynamic ensemble (EnOI-DE; Cheng & Zhu, Citation2016) to build the global ocean temperature () and salinity 1°- and 0.5°-resolution data products (Cheng et al., Citation2017). We automated these data products from data acquisition, processing, grid, and the final product release service, which successfully improves the data product development efficiency and provides faster and more accurate data support for global climate change research (Cheng et al., 2021).
Figure 7. Global ocean temperature gridded data (Spatial resolution: 1°×1°; Temporal resolution: monthly mean; Vertical resolution: 0–2000 m, 41 layers). For example, water depth: a = 0 m; b = 50 m; c = 100 m; d = 300 m; time: July 2020
Data resources: In addition to the international shared data that is commonly used in marine scientific research, such as WOD, ARGO, and GTSPP, data resources include the special Chinese offshore survey voyage data to the Western Pacific Ocean and the Eastern Indian Ocean, Chinese offshore observational buoy data, and deep-sea buoy data from Western Pacific scientific observing network. These data were obtained from the CAS, Ministry of Natural Resources, Ministry of Education, and other institutions in China, and they were collected and compiled using the data platform.
Data preprocessing: Chinese original and independent observational data underwent integrity verification, preprocessing, metadata information association, duplication removal, format standardization, etc., before being integrated with the international shared data. Thus, a unified ocean temperature and salinity database was constructed with data from over 15 million stations.
Data quality control: We optimized the data quality control methods commonly used in the world, especially the local climate state check module, which is considered to be one of the most effective means to identify temperature and salt data errors. We divide the whole ocean into 1°×1° sub regions, and use the statistical distribution characteristics of historical observation data in each sub region to define the threshold range (). If an observation data exceeds the set threshold, it will be marked as suspicious data. For the statistical characteristic data of normal distribution, the threshold (upper and lower bounds of climate state) is determined by using the PauTa Criterion (extreme value test). For skewed distribution data, Quantile Method is used to determine the threshold.
Figure 8. Data quality control by climate state check. The red dot is the data marked as an error
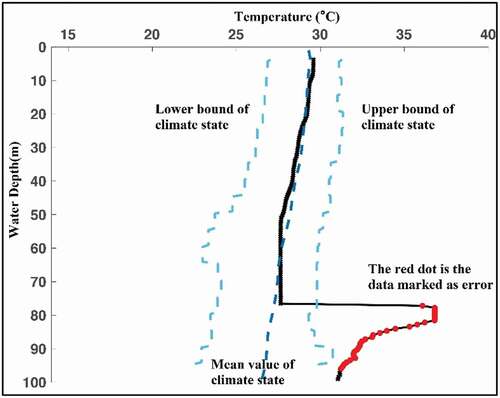
Figure 9. Comparison of quality control results for ocean temperature data: a) the original temperature observation data; b) data after NCEI data quality control; c) data after data quality control
We use the WOD data to test the accuracy of data quality control. The test data is download from NOAA/NCEI (https://www.ncei.noaa.gov/products/world-ocean-database). Data location is from 73.5°E to 74.5°E, 37.5°N to 38.5°N, and time spans from 1940 to present. demonstrates all the profiles of the original temperature observation data. shows the correct data after NCEI quality control. shows our quality control results. Through comparative analysis, we can see that our quality control system has identified more abnormal data.
Data deviation correction: Regarding the ocean observational data deviation, the system adopted the expendable bathythermograph (XBT) and mechanical bathythermograph (MBT) data deviation correction schemes proposed by the Institute of Atmospheric Physics, CAS, to correct the historical data deviation. The XBT bias correction scheme is recommended by the international XBT research group (Cheng et al., Citation2016). The scheme can correct XBT systematic bias and ensure the accuracy of historical ocean subsurface observing data. At present, the IQuOD only uses the XBT scheme.
Gridded data technology: A new spatial interpolation scheme was adopted that uses the EnOI-DE method and fifth phase of the Coupled Model Intercomparison Project multi-mode historical simulation to provide dynamic ensemble samples. The aim was to provide an improved initial field (as a prior estimate) and background error covariance (defining how information is transferred from the observed area to the non-observed area). Thus, we can identify the anisotropic correlations between different grid data points more accurately and reconstruct the temperature/salinity field in the non-observed area.
Data products publishing and sharing: Data products are published and shared through the marine data resource service platform (http://msdc.qdio.ac.cn/). The ocean data visualization platform presents these data products for scientific advancement ().
Figure 10. Global ocean gridded product and the visualization system: a) 0–2000 m mean ocean temperature anomaly related to 1981–2010 baseline; b) 0–2000 m mean ocean salinity anomaly related to 1981–2010 baseline
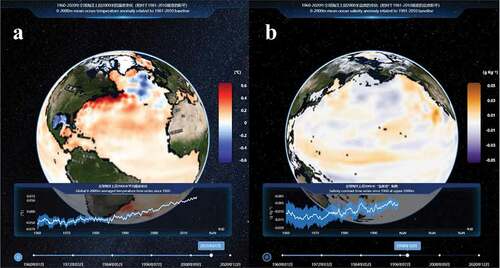
The proposed system provides comprehensive process services from data acquisition to data product development and sharing. For example, the global ocean heat content changes grid data products have been used in over 90 countries and widely cited in the literature.
4. Conclusions
The ocean is the primary driving force and regulator of global climate and environmental changes and a critical part of the Earth system. Therefore, it can provide solutions to climate change mitigation and sustainable marine economic development (including the future of food and energy). However, due to human activities on land and the interactions between the ocean, atmosphere, and cryosphere, the oceans face many issues, such as frequent marine ecological disasters, severe marine pollution, and ecosystem degradation, which pose an enormous threat to human health and the economy.
Ocean data are critical for ocean cognition and governance. Therefore, marine data management and application service system processes have been established to effectively aggregate and standardize data from different sources and subjects in real-time. Additionally, high-quality and multidisciplinary data QC techniques have been developed to provide high-quality scientific data for other users and support SDG research effectively.
The proposed system exhibits three superior characteristics compared to those of the traditional data management system:
In addition to conventional data aggregation and management, an intuitive data management platform EasyDM has been developed for the users lacking data management experience. The proposed platform assumes that data centers and users jointly build and manage data resources, which improves user data-sharing initiatives and fragmented data aggregation and management. Furthermore, it expands the data resource pool.
In addition to providing a data-sharing service similar to that of the traditional data management system, the proposed system exhibits sufficient expansibility. It can further integrate relevant data product development modules to automatically perform data acquisition, QC, deviation correction, and product production. Thus, the efficiency of data product development is improved, which can quicken the progress of scientific research.
To further serve the SDGs, the findings of different researchers, such as scientifically developed marine dynamical and ecological disaster models and early warnings methods, can be transformed into platforms. For example, such a platform, CASEarth-Ocean, may use the ocean data visualization platform to provide intuitive disaster early warning information for the government and the public.
The development of SDG research increases the demand for interdisciplinary data integration and deep data mining applications. There is an increasingly prominent contradiction between traditional data analysis and mining methods and the needs of modern marine science. Therefore, in the future, researchers can focus on the critical technologies of AI oceanography. They can integrate and develop relevant AI algorithms according to typical marine targets, marine data shape, and sample distribution characteristics. Researchers can also construct a corresponding AI deep learning network model to conduct deep information mining of marine big data and provide updated information technology support for SDG research.
Acknowledgments
The work was supported by the Strategic Priority Research Program of the Chinese Academy of Sciences (Grant Nos. XDA19060101 and XDA19060104), the National Key R&D Program of China (Grant No. 2017YFA0603201), the Marine Science Data Center CAS and the Youth Innovation Promotion Association CAS. The authors acknowledge NOAA/NCEI for decades of efforts in collecting and quality controlling the historical subsurface data, which was the important data source used in our study.
Data availability statement
The data that support the findings of this study are available in Marine Science Data Center, Chinese Academy of Sciences at http://msdc.qdio.ac.cn. These data were derived from the following resources available in the public domain:
1. Partial pressure of carbon dioxide in Southern Ocean: http://english.casodc.com/data/metadata-special-detail?id=1409813943244832769; and
2. Global Ocean temperature grid data product: http://english.casodc.com/data/metadata-special-detail?id=3.
Disclosure statement
No potential conflict of interest was reported by the author(s).
Additional information
Funding
Notes on contributors

Bin Zhang
Bin Zhang received the B.S. degree in Marine Technology (ocean remote sensing and data processing) from Tianjin University of Science and Technology, Tianjin, China, in 2009, and the Ph.D. degrees in Marine Geology from the Ocean University of China, Qingdao, China, in 2015.
From 2015 to 2017, he was a postdoctoral researcher at Institute of Oceanology, Chinese Academy of Sciences (CAS), Qingdao, China, where he was an engineer from 2017 to 2019, and has been a senior engineer since 2019. His current research interests include ocean data quality control, big data analysis and mining, and artificial intelligence applications.

Fuchao Li
Fuchao Li is a Professor at Institute of Oceanology, Chinese Academy of Sciences. He is engaged in genomics-based research on marine microbial communities, functions and product diversity. In recent years, he has organized the construction of Oceanographic Data Center, which integrates marine data resources, and builds a comprehensive platform of marine scientific data for multi-scene applications such as marine disaster prevention and mitigation, marine economic development, and marine scientific research.

Gang Zheng
Gang Zheng received the B.Eng. degree in electronic information engineering from Zhejiang University, Hangzhou, China, in 2003, and the M.S. and Ph.D. degrees in radio physics from the University of Electronic Science and Technology of China, Chengdu, China, in 2006 and 2010, respectively.
From 2010 to 2013, he was an Assistant Researcher with the State Key Laboratory of Satellite Ocean Environment Dynamics, Second Institute of Oceanography, Ministry of Natural Resources, Hangzhou, China, where he was an Associate Researcher from 2013 to 2020, and has been a Researcher since 2020. His current research interests include ocean microwave remote sensing, artificial intelligence applications, image processing, and electromagnetic numerical modeling.
Dr. Zheng is an Editorial Board Member of the Ocean section of Remote Sensing, and a Topic Editor of Big Earth Data. From 2018 to 2020, he also served as the Guest Editor for Remote Sensing, and edited special issues on “AI-based Remote Sensing Oceanography, Synergy of Remote Sensing and Modelling Techniques for Ocean Studies”, and “Tropical Cyclones Remote Sensing and Data Assimilation”.

Yanjun Wang
Yanjun Wang received the B.S. degree in Computer Science and Technology from PLA Artillery College, Hefei, China, in 2010, and the M. S. degree in Computer System Structure from the Harbin University of Science and Technology, Harbin, China, in 2013.
Since 2013, he has been an engineer of Marine Science Data Center in Institute of Oceanology, Chinese Academy of Sciences, Qingdao, China. His current research interests include ocean data visualization, big data analysis, and artificial intelligence applications.

Zhetao Tan
Zhetao Tan is a Ph.D student majored in Meteorlogy from Institute of Atmospheric Physics, Chinese Academy of Sciences. He received the B.S. degree in Atmospheric Science from Chengdu University of Information Technology, Chengdu, China, in 2015. His current research interests include ocean data quality control and oceanic climate change.

Xiaofeng Li
Xiaofeng Li received the B.S. degree in optical engineering from Zhejiang University, Hangzhou, China, in 1985, the M.S. degree in physical oceanography from the First Institute of Oceanography, Qingdao, China, in 1992, and the Ph.D. degree in physical oceanography from North Carolina State University, Raleigh, NC, USA, in 1997.
He had been with the National Environmental Satellite, Data, and Information Service, National Ocean and Atmospheric Administration, USA, from 1997 to 2019. His research interests include synthetic aperture radar (SAR) applications in oceanography and marine meteorology, artificial intelligence oceanography, big data, and satellite image processing.
Dr. Li is an Associate Editor of the IEEE Transactions on Geoscience and Remote Sensing and the International Journal of Remote Sensing. He is an Editorial Board Member of the International Journal of Digital Earth, Big Earth Data, and the Journal of Oceanology and Limnology. He is also the Executive Editor-in-Chief of the Journal of Remote Sensing (a Science Partner Journal).
References
- Argo. (2020). Argo float data and metadata from global data assembly centre (Argo GDAC). France: SEANOE.
- Boyer, T., Baranova, O., Coleman, C., Garcia, H., Grodsky, A., Locarnini, R., … Weathers, K., & Zweng M. (2018). World ocean database 2018. Technical Education, NOAA Atlas NESDIS 87.
- Cheng, L., Abraham, J., Goni, G., Boyer, T., Wijffels, S., Cowley, R., … Zhu, J. (2016). Xbt science: Assessment of instrumental biases and errors. Bulletin of the American Meteorological Society, 97(6), 924–933.
- Cheng, L., Abraham, J., Etrenberth, K., Fasullo, J., Boyer, T., Locarnini, R., … Zhu, J. (2021). Upper ocean temperatures hit record high in 2020. Advances in Atmospheric Sciences, 12, 1–8.
- Cheng, L., Kevin, E. T., Fasullo, J., Boyer, T., Abraham, J., & Zhu, J. (2017). Improved estimates of ocean heat content from 1960 to 2015. Science Advances, 3(3), e1601545.
- Cheng, L., & Zhu, J. (2016). Benefits of CMIP5 multimodel ensemble in reconstructing historical ocean subsurface temperature variations. Journal of Climate, 29, 5393–5416.
- Good, S. A., Martin, M. J., & Rayner, N. A. (2013). EN4: Quality controlled ocean temperature and salinity profiles and monthly objective analyses with uncertainty estimates. Journal of Geophysical Research: Oceans, 118(12), 6704–6716.
- Gouretski, V. (2018). World ocean circulation experiment-argo global hydrographic climatology. Ocean Science, 14(5), 1127–1146.
- Guo, H. (2017). Big Earth data: A new frontier in Earth and information sciences. Big Earth Data, 1(1–2), 4–20.
- Guo, H. (2020). Big Earth data facilitates sustainable development goals. Big Earth Data, 4(1), 1–2.
- Han, l., Liang, J., Zheng, B., Song, X., & Wan, F. (2020). Research on China-EU ocean data interoperability system. Marine Information, 246(4), 55–60.
- IPCC (Intergovernmental Panel on Climate Change). (2013). Climate change 2013: The physical science basis. Contribution of Working Group I to the Fifth Assessment Report of the Intergovernmental Panel on Climate Change. Cambridge, United Kingdom and New York, NY, USA: Cambridge University Press.
- Isensee, K., IOC-UNESCO. ((ed.)). (2020). Global ocean science report 2020–charting capacity for ocean sustainability. Paris: UNESCO Publishing.
- Jia, G. (2020). The role of big Earth data in understanding climate change. Big Earth Data, 4(2), 91–93.
- Leng, S., & Xu, X. (2021). Optimizing research funding allocation for marine sciences in the new era. Chinese Science Bulletin, 66(2), 193–200.
- Li, X., Liu, B., Zheng, G., Ren, Y., Zhang, S., Liu, Y., … Wang, F. (2020). Deep-learning-based information mining from ocean remote-sensing imagery. National Science Review, 7(10), 1584–1605.
- Liu, S., Chen, G., Liu, Y., & Tian, F. (2020). Research and analysis on marine big data applied technology. Periodical of Ocean University of China, 50(1), 154–164.
- Merritt, P., Bi, H., Davis, B., Windmill, C., & Xue, Y. (2018). Big Earth data: A comprehensive analysis of visualization analytics issues. Big Earth Data, 2(4), 321–350.
- NOAA. (2021). NOAA artificial intelligence strategy. Analytics for next-generation earth science. Strategic plan 2021–2025. https://sciencecouncil.noaa.gov/NOAA-Science-Technology-Focus-Areas.
- Qian, C., & Chen, G. (2018). Big data science for ocean: Present and future. Bulletin of Chinese Academy of Sciences, 33(8), 884–891.
- Rhein, M., Rintoul, S. R., Aoki, S., Campos, E., Chambers, D. (2013). Observations: Ocean. In: Climate Change 2013: The Physical Science Basis. Contribution of Working Group I to the Fifth Assessment Report of the Intergovernmental Panel on Climate Change. Cambridge, United Kingdom and New York, NY, USA: Cambridge University Press.
- Schuckmann, K. V., Palmer, M. D., Trenberth, K. E., Cazenave, A., Chambers, D., Champollion, N., … Wild, M. (2016). An imperative to monitor earth's energy imbalance.Nature Climate Change, 6, 138–144.
- Simon, G. (2019). 6th IQuOD workshop. Brest, France: IFREMER.
- Trenberth, K., Fasullo, J., & Balmaseda, M. (2014). Earth’s energy imbalance. Journal of Climate, 27, 3129–3144.
- UNESCO. (2020). United Nations decade of ocean science for sustainable development 2021–2030-implementation plan version 2.0. https://oceanexpert.org/document/27347.
- UNESCO-IOC. (2010). GTSPP real-time quality control manual. IOC Manuals & Guides
- Wang, L., & Yan, J. (2020). Stewardship and analysis of big Earth observation data. Big Earth Data, 4(4), 349–352.
- Wang, Y., Li, X., Song, J., Li, X., Zhong, G., & Zhang, B. (2021). Carbon sinks and variations of p CO2 in the southern ocean from 1998 to 2018 based on a deep learning approach. IEEE Journal of Selected Topics in Applied Earth Observations and Remote Sensing, 14, 3495–3503.
- Zhang, B., Cheng, C., Wang, X., Chen, M., Wang, Q., Zhang, R., … Wang, F. (2020). Review of observation data processing method and product development of key parameters of marine environmental change. China Basic Science, 22(3), 41–48.
- Zhang, B., Wang, F., Cheng, L., Wang, X., Zhang, D., Zhao, Y., … Wang, Q.(2017). Observation data processing method and product development of key parameters of marine environmental change. China Basic Science, 19(5), 6–11.
- Zhong, G., Li, X., Qu, B., Wang, Y., Yuan, H., & Song, J. (2020). A general regression neural network approach to reconstruct global 1°×1° resolution sea sur-face pCO2. Haiyang Xuebao, 42(10), 70–79.