
 ?Mathematical formulae have been encoded as MathML and are displayed in this HTML version using MathJax in order to improve their display. Uncheck the box to turn MathJax off. This feature requires Javascript. Click on a formula to zoom.
ABSTRACT
In this paper, snow and ice thickness products derived from an updated Fast Ice Prediction System Version 2.0 (FIPS V2.0) in Prydz Bay, East Antarctica, are introduced and compared with in-situ observations. FIPS V2.0 is comprised of a newly-developed snowdrift parameterization compared to the original FIPS V1.0. The simulation domain covers the entire fast ice region in Prydz Bay and is configured to 720 grid cells, with a spatial resolution of 0.125°. The ERA-Interim reanalysis from the European Centre for Medium-Range Weather Forecasting (ECMWF) were used as the atmospheric forcing. The in-situ observations were obtained near Zhongshan Station by the wintering team, and the measurement frequency of the snow and ice thicknesses was around one week. Both the FIPS V2.0 products and in-situ observations introduced in this paper cover the time periods from 2012 to 2016. The primary assessments based on the in-situ observations show that FIPS V2.0 has mean biases of 0.01 ± 0.07 m and 0.23 ± 0.09 m for snow and ice thickness simulations, respectively. The results indicate that the updated FIPS V2.0 produces a reasonable snow thickness due to the newly-developed snowdrift parameterization, but it overestimates the ice thickness due to the cold bias in the air temperature forcing. These 2-D snow and ice thickness distributions provide important references for sea ice thermodynamic studies, remote sensing validations, and icebreaker navigation assessments in this region. The dataset is available at http://www.doi.org/10.11922/sciencedb.j00076.00066.
1. Introduction
Fast ice is a special classification of sea ice. It is often attached to the coastlines, icebergs, and/or ice shelves, it does not exhibit significant horizontal movement, and it is obviously different from drifting pack ice (Hoppmann et al., Citation2015). Fast ice provides an ideal platform for in-situ observations and is usually considered to be a navigational obstacle, particularly for ships that need to dock at Arctic and Antarctic stations. In Prydz Bay, East Antarctica, fast ice forms every year. Close to the coast, near the Chinese Zhongshan Station, the fast ice can extend up to 100 km northward during winter and entirely breaks up and disappears for a couple of weeks during summer. By the end of the winter, the thickness of the fast ice is 1.2–1.8 m for first-year ice (FYI) and 2.0–3.0 m for second and multi-year ice (SYI/MYI) (Lei, Li, Cheng, Zhang, & Heil, Citation2010; Zhao et al., Citation2019).
The Chinese National Antarctic Research Expedition (CHINARE) and R/V Xuelong I/II usually visit and resupply Zhongshan Station during austral summer. In the first stage of navigation in the ice-infested waters, R/V Xuelong I/II needs to sail through 500–1000 km wide pack ice in northern Prydz Bay to reach the edge of the fast ice region. In the second stage, the icebreakers try to break their way through the 40–60 km wide and 1.0–1.5 m thick fast ice and anchor as close as possible to Zhongshan Station. In the third stage, on-ice routes between the icebreakers and the station are established, and the cargo is transported to the station using snowcats. During these navigation stages, it is important for the icebreakers to know the extent and thickness of both the pack ice and fast ice, especially the thickness of the fast ice and the overlying snow, which are the most important parameters affecting the ice-breaking efficiency of the icebreakers and the safety of driving snowcats over the ice.
Satellite remote sensing products such as AMSR2, MODIS, and SAR images, which can yield accurate extent, concentration, and classification information about pack ice and fast ice, are efficient tools for icebreaker navigation in the polar regions (Hui et al., Citation2017; Karvonen, Citation2018). However, there are major problems with the remote sensing retrieval of the ice thickness because of the inaccurate snow thickness assumptions and simplifications. The popular methods use snow thickness climatology, for example W99, in the ice thickness retrieval processes, which cannot represent the real snow thickness and will introduce large biases (Laxon et al., Citation2013; Spreen, Kaleschke, & Heygster, Citation2008). The ice thickness data derived from the CryoSat-2 Radar Altimeter can be freely accessed from the National Snow and Ice Data Center (NSIDC). However, the current dataset is only available for the Arctic, and it is not available for Antarctica (Kurtz & Harbeck, Citation2019).
To fill the data gap and navigation service requirements regarding the ice thickness in Antarctica, the first version of the Fast Ice Prediction System (FIPS V1.0) was configured for the first-year ice in Prydz Bay, East Antarctica (Zhao et al., Citation2020). FIPS V1.0 simulates the 2-D snow and ice evolutions for an annual cycle, and it is forced by the ERA-Interim reanalysis data from the European Centre for Medium-Range Weather Forecasting (ECMWF). In this study, a newly-developed snowdrift parameterization was introduced to solve the snow redistribution problem (Scarchilli et al., Citation2010) and FIPS V1.0 was improved to produce a new version (V2.0). The 2-D snow and ice thicknesses during 2012–2016 were modelled using FIPS V2.0 and were assessed using in-situ observations obtained near Zhongshan Station. These modelled and observed datasets provide a primary reference for regional model comparisons, remote sensing validations, icebreaker navigation, and snowcats operations on ice.
2. Methods
2.1. FIPS V2.0 and snowdrift parameterization
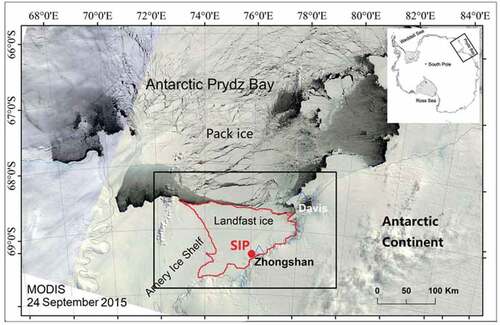
FIPS V1.0 was established by the National Marine Environmental Forecasting Center (NMEFC) and was released in July 2020 (Zhao et al., Citation2020). The simulation domain is 68.375–69.75°S and 73.5–79°E, covering the entire fast ice region of Prydz Bay (). The southwestern boundary is the Amery Ice Shelf, and the southeastern boundary is the coast where Zhongshan Station and Davis Station are located. The domain of FIPS V2.0 is not entirely covered by fast ice and may include areas of water or pack ice. In austral summer, the fast ice may break up and disappear temporarily before reforming in the austral winter when the ice floes freeze together, attach to the coast, and become immobile. Therefore, thermodynamic growth is the dominant process of fast ice growth.
Figure 1. The MODIS image of Prydz Bay, East Antarctica (24 September 2015), modified from the figure in Zhao et al. (Citation2020). The domain of FIPS V2.0 is denoted by the black rectangle. The fast ice region is denoted by the red border. The in-situ observation site (SIP) is denoted by the red dot, which is located about 100 m off the coast.
The core of FIPS V2.0 is the high-resolution thermodynamic snow and ice (HIGHTSI) model (Launiainen & Cheng, Citation1998), which includes the heat conduction processes for both snow and ice layers. The boundary conditions are controlled by two processes. The first is the surface heat balance between the shortwave radiative flux, longwave radiative flux, sensible heat flux, latent heat flux, and conductive heat flux. The second is the ice bottom mass balance between the upward oceanic heat flux and the conductive heat within the ice and snow layers. The snow and sea ice are fully coupled with respect to heat conduction and the snow-to-ice transformation. The HIGHTSI parameters applied in this study are presented in (). They are largely based on the literature and in-situ measurements. This model for snow and ice thermodynamic studies has been successfully implemented in the Arctic (Cheng et al., Citation2008) and in Antarctica (Zhao, Cheng, Yang, Vihma, & Zhang, Citation2017).
Table 1. The parameters applied in the HIGHTSI model.
In this study, a newly developed snowdrift parameterization was introduced to improve the simulation of the snowfall redistribution in the fast ice region, which was not included in FIPS V1.0. Following the method of Scarchilli et al. (Citation2010) and Sauter et al. (Citation2013), we assumed that snow-drifting occurred when the wind speed () was greater than 5 m/s, in which case the original snow thickness (
) changed according to the following formula:
where is the corrected snow thickness. The forcing variables for FIPS V2.0 are derived from the ECMWF ERA-Interim data, including the wind speed (
), air temperature (
), relative humidity (
), cloudiness (
), total precipitation (
), and downward shortwave (
) and longwave (
) radiative fluxes. The temporal resolution of the forcing data is 6 h for the first four parameters listed above and 12 h for the last three. All of the parameters are interpolated to the model time step of 1 h. The domain of FIPS V2.0 is divided into 720 grid cells, with a horizontal resolution of 0.125°, and the HIGHTSI model is run independently for each grid cell.
The output of FIPS V2.0 includes the snow and ice thicknesses, snow accumulation and drift, freezing and melting rates of the snow and ice, vertical temperature profile of the snow and ice, and the conductive heat fluxes in every single level of snow and ice. The output is stored every 1 hour. Due to the lack of observations of these parameters, the snow and ice thicknesses are the only parameters assessed and released in this study.
2.2. The in-situ observations
Zhongshan Station is the second Chinese Antarctic scientific research station operated year-round, and it is located in Prydz Bay, East Antarctica (69°22′S, 76°22′E) (). The coastal area near the station is covered by fast ice during most of the year. In winter, the fast ice extends 60–100 km to the north of Zhongshan Station; while in summer, the fast ice ranges from 20 to 40 km. In late January or early February, the fast ice can break up, due to the dynamic forces imposed by the wind, waves, and/or tides (Lei et al., Citation2010). Some ice floes may survive in the narrow fjords and are transformed into multi-year ice. These small multi-year ice floes freeze together with the newly formed first-year sea ice that develops around them in late February, and eventually the multi-year ice floes and first-year ice floes form level fast ice together in the coming winter.
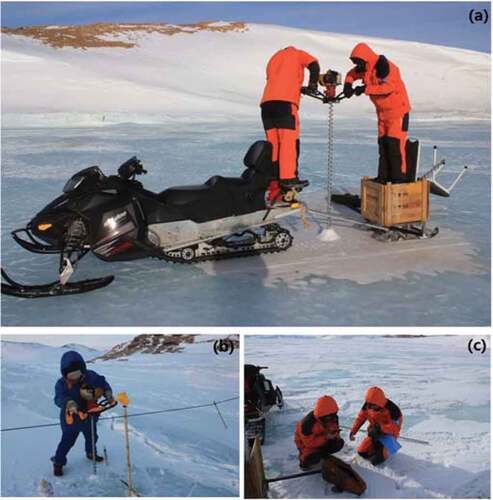
From 2012 to 2016, the snow and ice thicknesses were measured regularly at a fixed sea ice position (SIP). The SIP site was established on level ice, around 100 m off the coastline (). The water depth at the SIP was about 10 m. The in-situ measurements usually began in March when the ice thickness reached 20 cm and it was safe to conduct on-ice operations, and they often ceased in early December when the ice surface began to melt. The measurements were made weekly by the winter team members (). The ice thickness was measured by drilling boreholes and by recording the distance from the ice surface to the bottom using an ice gauge. The snow thickness was measured around the boreholes, using a stainless steel ruler. The accuracy of both the ice and snow measurements is 0.01 m.
Figure 2. Measuring the (a) thick ice (> 1 m), (b) thin ice (< 1 m), and (c) snow on the fast ice near Zhongshan Station, conducted by the winter team members.
3. Data records
The datasets used in this study consist of two parts: FIPS V2.0 products and in-situ observations. The FIPS V2.0 products for every single year are stored in the corresponding folder. For every single year, the weekly mean snow thickness data from March to December were stored in 40 single files and written in ASCII format. The same organization was used for the weekly mean ice thickness files. The naming convention is “ice_thickness_yY_mM_wW.dat” and “snow_thickness_yY_mM_wW.dat.” The meaning of the file name variables are as follows: Y is the year, M is the month, and W is the week.
The longitude and latitude information was stored in the “lon.dat” and “lat.dat” files, respectively. Corresponding to the 720 grid cells of the FIPS V2.0 domain with a spatial resolution of 0.125°, every single file includes 60 rows, corresponding to longitudes of 72°E to 79.375°E, and 12 columns, corresponding to latitudes of 68.375°S to 69.75°S. The time series ranges from 2012 to 2016, and the temporal interval is one week. The units of both the snow and ice thicknesses are meters.
The in-situ observations obtained from 2012 to 2016 are stored in 13 single files and written in ASCII format. Every single file is named using the format “YEAR_L.dat.” The meaning of the file name variables are as follows: YEAR is the year and L is the site number during that year. The first, second, and third columns in the file are the year, month, and day of the observation date, respectively. The fourth column is the observed snow thickness and the fifth is the observed ice thickness. The sampling interval was basically one week, but it was occasionally longer due to bad weather conditions on the scheduled day. The units of both the snow and ice thicknesses are centimeters.
4. Product validation
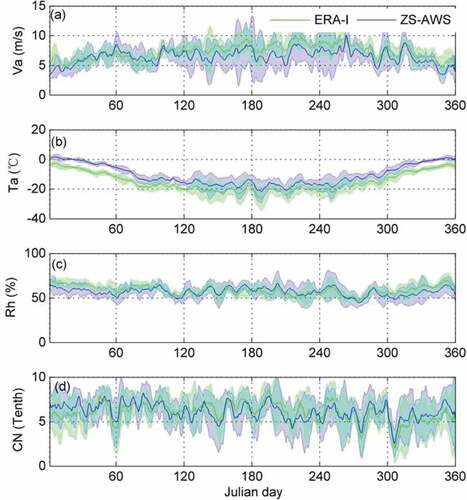
The atmospheric forcing from the ERA-Interim data was assessed with the automatic weather station (AWS) observations from Zhongshan Station (ZS-AWS). The multi-year mean wind speed from the ERA-Interim was 7.29 ± 0.15 m/s, which is greater than that of the ZS-AWS observations (6.50 ± 0.52 m/s), and the correlation coefficient was 0.79 ()). The multi-year mean air temperature from the ERA-Interim was −15.09 ± 0.66°C, which is significantly colder than that of the ZS-AWS observations (−10.50 ± 0.65°C) ()). The large colder bias mainly occurred in the warmer seasons, such as in January to May and October to December. The multi-year mean relative humidity from the ERA-Interim was 58.89 ± 0.94%, which is consistent with that of the ZS-AWS observations (57.01 ± 2.39%) ()). The multi-year mean cloudiness from the ERA-Interim was 6.05 ± 0.27, which had a correlation coefficient of 0.73 with that of ZS-AWS observations ()). The multi-year mean cloudiness of the ZS-AWS observations was 6.15 ± 0.47.
Figure 3. Comparisons of the (a) wind speed (Va), (b) air temperature (Ta), (c) relative humidity (Rh), and (d) cloudiness (CN) from the ERA-Interim and Zhongshan AWS observations, averaged from 2012 to 2016. The line and the shaded areas represent the multi-year mean and standard deviation, respectively.
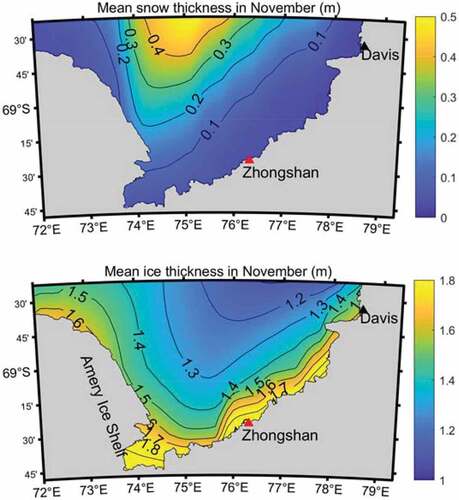
The FIPS V2.0 modeled snow and ice thicknesses in November are illustrated in (), which are the multi-year mean for the period of 2011–2016. The ice thickness usually reaches the maximum in November, when CHINARE arrives in this region for the annual logistical supply. The mean modeled snow accumulation reaches 0.4 m in the offshore region, but it remains less than 0.1 m in the near shore region. The modeled ice thickness is around 1.8 m near Zhongshan station, but it is only about 1.2–1.4 m on the northern boundary of the simulation domain.
Figure 4. Mean snow and ice thicknesses from FIPS V2.0 in November when the ice thickness usually reaches the maximum and when CHINARE arrives in this region for the annual logistical supply.
We assessed the FIPS V2.0 products using the in-situ observations obtained at the SIP grid. The weekly mean snow and ice thicknesses are shown in (). The observed snow thickness increased from Julian day 60, reached the maximum (~0.2 m) during Julian days 180–210, then gradually decreased, and finally reached a small peak (~0.1 m) during Julian days 300–330. The large standard deviation (up to 0.15 m) indicates a strong inter-annual variation in the snow thickness in winter. Generally, FIPS V2.0 captured the seasonal cycle of the snow thickness at the SIP well, but it exhibited a weaker inter-annual variation. The mean bias for the modelled snow thickness at the SIP was 0.01 ± 0.07 m ()). For the ice thickness, FIPS V2.0 simulated a similar growth trend from Julian day 60 to the end of the year while exhibiting an obvious overestimation in the latter half of the time period. The mean bias for the modelled ice thickness was 0.23 ± 0.09 m ()).
Figure 5. Weekly mean snow and ice thicknesses at the SIP grid from FIPS V2.0 simulations, averaged from 2012 to 2016, compared to the in-situ observations.
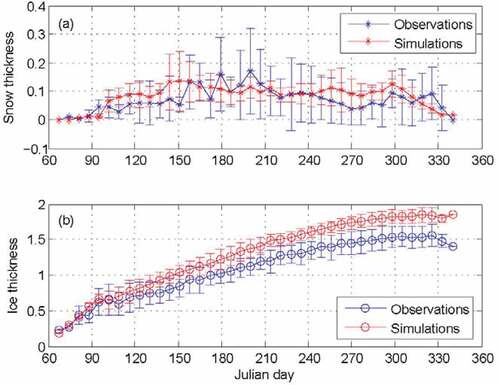
Figure 6. Monthly mean biases of the snow and ice thicknesses at the SIP grid from FIPS V2.0 simulations, averaged from 2012 to 2016.
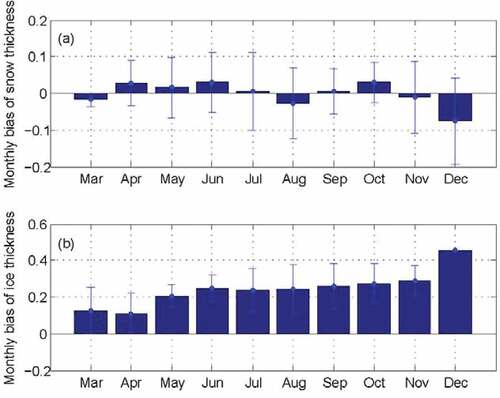
The large biases of the ice thickness simulation may be caused by two factors. First, the large cold bias in the air temperature of the ERA-Interim forcing directly leads to a larger ice growth in winter, which contributes to the positive bias. Second, the positive biases in the snow thickness simulation introduce a negative bias into the simulated ice thickness due to the large heat insulation effect of the snow cover. This phenomenon was also discovered in the simulations using FIPS V1.0 (Zhao et al., Citation2020).
5. Dataset value
FIPS V2.0 is the first regional fast ice prediction system integrated with a snowdrift parameterization, and it was developed for navigation support for the Chinese National Antarctic Research Expedition (CHINARE). For the first time, this dataset provides a time series of the spatial distributions of the snow and ice thicknesses in Prydz Bay, East Antarctica. The products fulfill the navigation requirements in terms of the 2-D snow and ice thicknesses, which are key parameters for icebreaker navigation and the field ice operations conducted by the CHINARE in this region.
The in-situ observations conducted near Zhongshan Station are the only regular annual sea ice measurements conducted by CHINARE in Antarctica, and they are also an important component of the Antarctic Fast Ice Network (AFIN). The in-situ snow and ice thicknesses obtained weekly throughout the year can be used to monitor and represent the main processes of fast ice thermodynamic evolution in Prydz Bay. The time series during 2012–2016 provides essential information for the analysis of the seasonal, annual, and inter-annual snow and ice thickness cycles, which scientifically support the logistical and scientific activities of CHINARE.
The five-year time series of the field observations and 2-D FIPS V2.0 products are the primary and foundational datasets for the Antarctic sea ice community in term of regional atmosphere-ice-ocean interaction studies, analysis of sea ice thermodynamic processes, sea ice model assessments, icebreaker navigation evaluations, and remote sensing product validation. However, one-point in-situ observations are not sufficient for the comprehensive assessment of 2-D model results; therefore, this study is only a primary trial and more in-situ observations, and even satellite retrieved products, should be developed and used to assess our model results in the future.
The model validation based on the in-situ land-fast ice measurements, which were collected at a single point, is likely applicable to most of the land-fast ice cover, which is the purpose of FIPS, because the thermodynamic processes are dominant. However, FIPS V2.0 may not be a good representation of the ice conditions in areas where the sea ice dynamics are important, for example, in offshore areas and at the landward edge of fast ice.
Open Scholarship


This article has earned the Center for Open Science badges for Open Data, Open Materials and Preregistered. The data and materials are openly accessible at http://www.doi.org/10.11922/sciencedb.j00076.00066.
Acknowledgments
This study was supported by the National Natural Science Foundation of China (41876212, 41911530769). We thank the wintering team in Zhongshan Station who assisted field observations during 2012–2016. We also appreciated the logistical supports provided by CHINARE for on-ice operations.
Disclosure statement
No potential conflict of interest was reported by the author(s).
Data availability statement
The dataset is openly available in the Science Data Bank at http://www.doi.org/10.11922/sciencedb.j00076.00066.
Additional information
Funding
Notes on contributors
Jiechen Zhao
Dr. Jiechen Zhao is a research scientist working in the National Marine Environmental Forecasting Center, China. He received his Ph.D. in Physical Oceanography from the Ocean University of China. He has been working on polar sea ice observation and thermodynamic modelling. He has published over 40 peer-reviewed papers. He ever worked at the Antarctic Zhongshan Station as a wintering team member for 15 months during 2011–2013, and at the Arctic Yellow River Station as a summer team member in 2015.
References
- Cheng, B., Zhang, Z. H., Vihma, T., Johansson, M., Bian, L. G., Li, Z. J., & Wu, H. D. (2008). Model experiments on snow and ice thermodynamics in the Arctic Ocean with CHINAREN 2003 data. Journal of Geophysical Research, 113(C9), C09020.
- Hoppmann, M., Nicolaus, M., Hunkeler, P. A., Heil, P., Behrens, L. K., König Langlo, G., & Gerdes, R. (2015). Seasonal evolution of an ice-shelf influenced fast-ice regime, derived from an autonomous thermistor chain. Journal of Geophysical Research: Oceans, 120, 1703–1724.
- Hui, F., Zhao, T., Li, X., Shokr, M., Heil, P., Zhao, J., … Cheng, X. (2017). Satellite-based sea ice navigation for Prydz Bay, East Antarctica. Remote Sensing, 9(6), 518.
- Huwald, H., Tremblay, L. B., & Blatter, H. (2005). Reconciling different observational data sets from surface heat budget of the Arctic Ocean (SHEBA) for model validation purposes. Journal of Geophysical Research, 110(C5), C05009.
- Karvonen, J. (2018). Estimation of Arctic land-fast sea ice cover based on dual-polarized Sentinel-1 SAR imagery. The Cryosphere, 12(8), 2595–2607.
- Kurtz, N., & Harbeck, J. (2019, May 16). CryoSat-2 Level-4 sea ice elevation, freeboard, and thickness, version 1. Retrieved from https://nsidc.org/data/RDEFT4/
- Launiainen, J., & Cheng, B. (1998). Modelling of ice thermo-dynamics in natural water bodies. Cold Regions Science and Technology, 27(3), 153–178.
- Laxon, S. W., Giles, K. A., Ridout, A. L., Wingham, D. J., Willatt, R., Cullen, R., … Davidson, M. (2013). CryoSat-2 estimates of Arctic sea ice thickness and volume. Geophysical Research Letters, 40(4), 732–737.
- Lei, R., Li, Z., Cheng, B., Zhang, Z., & Heil, P. (2010). Annual cycle of landfast sea ice in Prydz Bay, East Antarctica. Journal of Geophysical Research, 115(C2), C02006.
- Pringle, D. J., Eicken, H., Trodahl, H. J., & Backstrom, L. G. E. (2007). Thermal conductivity of landfast Antarctic and Arctic Sea ice. Journal of Geophysical Research, 112(C4), C04017.
- Saloranta, T. M. (2000). Modeling the evolution of snow, snow ice and ice in the Baltic Sea. Tellus, 52(1), 93–108.
- Sauter, T., Mller, M., Finkelnburg, R., Grabiec, M., Schneider, C., & Schneider, C. (2013). Snowdrift modelling for vestfonna ice cap, north-eastern Svalbard. The Cryosphere, 7(1), 1287–1301.
- Scarchilli, C., Frezzotti, M., Grigioni, P., Silvestri, L. D., Agnoletto, L., & Dolci, S. (2010). Extraordinary blowing snow transport events in East Antarctica. Climate Dynamics, 34(7–8), 1195–1206.
- Spreen, G., Kaleschke, L., & Heygster, G. (2008). Sea ice remote sensing using AMSR-E 89-GHz channels. Journal of Geophysical Research, 113(C2), https://doi.org/10.1029/2005JC003384.
- Vihma, T., Johansson, M. M., & Launiainen, J. (2009). Radiative and turbulent surface heat fluxes over sea ice in the western Weddell Sea in early summer. Journal of Geophysical Research, 114(C4), C04019.
- Wang, C. X., Cheng, B., Wang, K. G., Gerland, S., & Pavlova, O. (2015). Modelling snow ice and superimposed ice on landfast sea ice in Kongsfjorden, Svalbard. Polar Research, 34(1), 20828.
- Yang, Y., Li, Z. J., Leppäranta, M., Cheng, B., Shi, L. J., & Lei, R. B. (2015). Modelling the thickness of landfast sea ice in Prydz Bay, East Antarctica. Antarctic Sciences, 28(1), 59–70.
- Yen, Y. C. (1981). Review of thermal properties of snow, ice and sea ice. Cold Regions Research and Engineering Laboratory (CRREL) Report, 81–10, 1–27.
- Zhao, J., Cheng, B., Vihma, T., Heil, P., Hui, F., Shu, Q., … Yang, Q. (2020). Fast Ice Prediction System (FIPS) for land-fast sea ice at Prydz Bay, East Antarctica: An operational service for CHINARE. Annals of Glaciology, 61(83), 271–283.
- Zhao, J., Yang, Q., Cheng, B., Hui, F., Leppäranta, M., Xie, S., … Zhang, L. (2019). Spatial and temporal evolution of landfast ice near Antarctic Zhongshan Station over annual cycle in 2011/2012. Acta Oceanologica Sinica, 38(5), 51–61.
- Zhao, J. C., Cheng, B., Yang, Q. H., Vihma, T., & Zhang, L. (2017). Observations and modelling of first-year ice growth and simultaneous second-year ice ablation in the Prydz Bay, East Antarctica. Annals of Glaciology, 58(75pt1), 59–67.