
 ?Mathematical formulae have been encoded as MathML and are displayed in this HTML version using MathJax in order to improve their display. Uncheck the box to turn MathJax off. This feature requires Javascript. Click on a formula to zoom.
ABSTRACT
The occurrence of large-magnitude disasters has significantly aroused public attention regarding diversified site selection of emergency facilities. In particular, emergency airport site selection (EASS) is highly complicated, and relevant research is rarely conducted. Emergency airport site selection is a scenario with a wide spatiotemporal range, massive data, and complex environmental information, while traditional facility site selection methods may not be applicable to a large-scale time-varying airport environment. In this work, an emergency airport site selection application is presented based on the GeoSOT-3D global subdivision grid model, which has demonstrated good suitability of the discrete global grid system as a spatial data structure for site selection. This paper proposes an objective function that adds a penalty factor to solve the constraints of coverage and the environment in airport construction. Through multiple iterations of the simulated annealing algorithm, the optimal airport construction location can be selected from multiple preselected points. With experimental verifications, this research may effectively and reasonably solve the emergency airport site selection issue under different circumstances.
1. Introduction
Since the 1950s, both the number and magnitude of disasters have been continuously increasing, with the number of victims increasing proportionately (Boonmee, Arimura, & Asada, Citation2017). How to quickly search for and rescue trapped people and property during a disaster is a complicated multi-objective planning issue. In addressing this issue, emergency public facilities can effectively integrate spatiotemporal rescue forces (Toregas, Swain, ReVelle, & Bergman, Citation1971), which also have certain emergency protection capabilities for regular disasters. In massive disasters, ordinary resource supply methods cannot be guaranteed within 24–48 hours after the incident occurs if emergency facilities are not established (Boonmee et al., Citation2017), while temporary emergency facilities could provide a substitution role (Goodman, Manbeck, Ricks, & Solow, Citation1986).
The provision and utilization of effective and efficient emergency services is an important optimization problem encountered in all parts of the world (Caccetta & Dzator, Citation2005). In response to disaster events and major public health issues, the rapid construction and location selection of emergency facilities (such as emergency airports and nucleic acid testing points) has also become more necessary and frequent (Peto, Citation2020). The distribution of emergency facilities determines the efficiency of their rescue of disaster areas. Therefore, analyzing the current spatial distribution of resources and finding a rapid deployment plan for emergency facilities has become a top priority in disaster-prone areas, among which the most important issue is location selection (Wei, Citation2009).
Location selection from among a set of alternatives along with several conflicting criteria is a multiple criteria decision-making (MCDM) problem (Sennaroglu & Varlik Celebi, Citation2018). To date, there has been a certain amount of research work on facility site selection. In firefighting facilities, Rodriguez et al. considered multiple regions, demand types, vehicle types, and region-dependent dispatching rules (Rodriguez, De la Fuente, & Aguayo, Citation2020). A mixed-integer linear programming model was presented that considers the average vehicle utilization to compute the expected demand coverage. For the emergency location selection of ambulances, more simplified constraints can be solved (Sumrit & Thongsiriruengchai, Citation2020). In addition, Conway and Venkataramanan developed a simple genetic algorithm (GA) for the facility site selection problem (Conway & Venkataramanan, Citation1994). Kaku and Mazzola applied a tabu search (TS) algorithm for the emergency facility site selection problem (Kaku & Mazzola, Citation1997) and examined several search strategies for the TS algorithm to solve this problem. For traditional civil airport site selection, Liao & Bao considered the problem of airport location as a multi-attribute decision-making issue, and the decision matrix entries (crisp numbers) that express the opinion of experts affected the accuracy of the result (Liao & Bao, Citation2014). Yang et al. used a quantitative technique to determine optimal airport locations, taking into consideration the accessibility to airports by airside and surface transportation. A structural equation model (SEM) was used to investigate the connection between the size of an airport catchment territory and its flight network scale (Yang, Yu, & Notteboom, Citation2016). Traditional GIS methods are also susceptible to the influence of 3D geographical factors such as buildings and mountains (Erkan & Elsharida, Citation2019).
Among diversified site selection approaches of emergency facilities, emergency airport site selection (EASS) studies are rarely conducted. Although the factors of site selection considered for emergency airports are simpler and clearer than those for civil airports, emergency airport site selection is a scenario with a wide spatiotemporal range, massive data, and complex environmental information. Hence, traditional facility site selection methods may not be applicable to a large-scale time-varying airport environment. In this paper, we adopt the spatial grid model to cater to the above requirements, which is recognized as a suitable solution as the spatial basis to integrate auxiliary spatial data and different constraints. The GeoSOT-3D global subdivision grids model (Hu & Cheng, Citation2014), a unique type of discrete global grid system (DGGS), is selected, which can not only quickly complete the construction of a multilevel global space-time grid but also integrate the spatiotemporal information in the airspace environment and store it in the grid database to facilitate subsequent site optimization.
In short, the optimal location of an emergency airport needs multiple constraints to be considered, such as coverage, level, and number of aircraft, which is a complex multiobjective linear programming problem (Basciftci, Ahmed, & Shen, Citation2021). This paper views the location of emergency facilities as a set covering problem with unequal costs in the objective. Based on the completion of disaster airspace environment modeling, this paper uses the simulated annealing (SA) algorithm to optimize the emergency airport site (Kirkpatrick, Gelatt, & Vecchi, Citation1983). The SA algorithm is derived from the principle of solid annealing, combined with the probability of sudden jump characteristics to randomly find the global optimal solution of the objective function in the solution space, and this algorithm has proven to have a major effect on multi-objective planning (Černý, Citation1985; Khajemahalle, Emami, & Keshteli, Citation2020). In this paper, combined with the penalty function method, the SA algorithm is extended to the optimal selection of preselected points in emergency airport planning to ensure the accuracy and efficiency of emergency airport selection.
Based on the GeoSOT-3D discrete grid model, this paper conducts an emergency airport site selection application using a simulated annealing (SA) algorithm to solve the problem of emergency airport location in the Yangtze River Delta in China, which strongly demonstrates the suitability of the discrete global grid system as a spatiotemporal data structure for site selection analysis. A 2-step framework for the overall work is proposed in . First, a simulated annealing algorithm is utilized to iterate the airport location after modeling the disaster airspace environment. Second, the effectiveness and reasonableness of the EASS algorithm are verified in different site selection experiments.
Figure 1. Flowchart for construction of the emergency airport site selection algorithm.
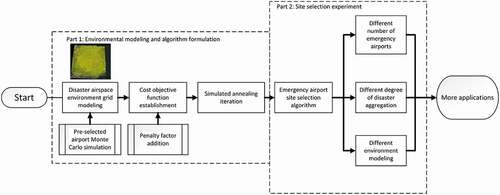
This article is organized as follows. Preselected airports, simulated disaster data and airspace environments are discussed in Section 2, and the proposed method is presented in detail in Section 3. The tests and experiments conducted with this approach are discussed in Section 4, along with their results. Finally, the discussion and conclusions of this study are provided in Section 5 and Section 6.
2. Data
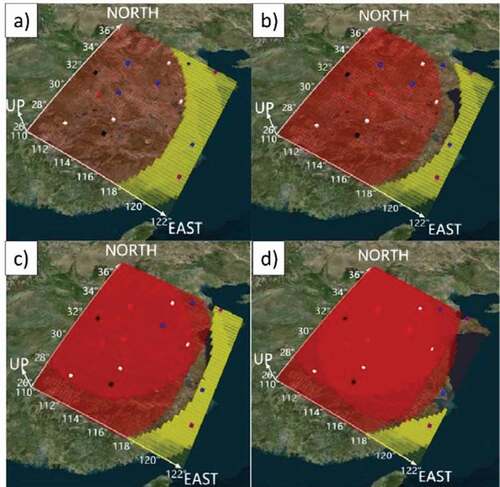
This article selects the Yangtze River Delta for scope delineation. The Yangtze River Delta is densely populated and rich in public infrastructure resources, where rapid EASS in the Yangtze River Delta would be practically needed if a disaster occurs. According to the current actual airport site in this region, this paper constructs an airport site cluster in the middle and lower reaches of the Yangtze River. Airports are divided into three levels, large (Level 3), medium (Level 2) and small (Level 1), which represent their optimal coverage and the number of loaded aircraft. Specific airport parameters that will be stored in the GeoSOT-3D database are shown in . Because the rescue plane needs to take off from and land at the airport and the disaster area, the flight distance is inconsistent with that of conventional planes. The specific coverage areas of different levels of airports are shown in .
Figure 2. The coverage of different levels of airports. The yellow grid represents the coverage area of the airport; the darker the color is, the wider the coverage area of the airport. (a): Level 1 airport represented by the white grid; (b): Level 2 airport represented by the pink grid; (c): Level 3 airport represented by the purple grid.
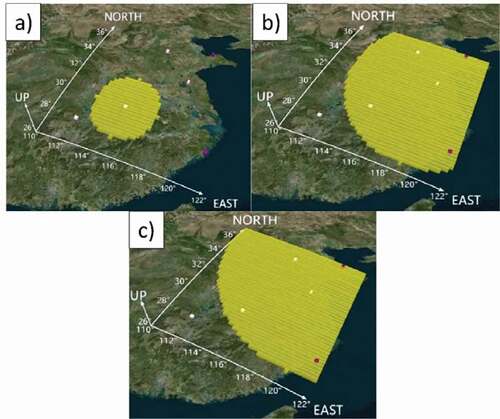
Table 1. The farthest coverage radius and the number of loaded aircraft in each type of airport.
In this paper, the following assumptions are proposed:
① The types of aircraft in a single airport are the same, which means that the maximum coverage of the airport remains constant;
② After the disaster, the affected area will not change or expand;
③ The new emergency airport is Airport Level 1 or 2.
Subsequently, this paper takes the completed airport as the center to establish the largest coverage circular area of each airport. At the same time, according to actual needs, a simulated disaster area is established in the Yangtze River Delta, the shape of which is a rectangle or a rectangle-like irregular body. The closer the various airports are to the disaster area, the more severe the damage to the airport will be. In this article, it is understood that the number of aircraft that can take off and rescue is reduced. According to nonpublic military data, the relationship between the damage to the airport and the distance from the disaster is shown in .
Table 2. The impact of the distance between the airport and the disaster area on the airport.
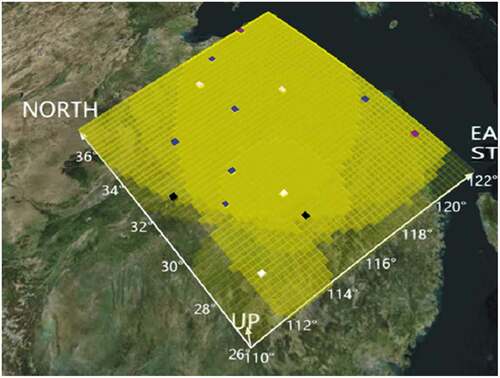
After obtaining the information of the disaster-affected area and the existing airport, this work selects the preselected airport location. First, the candidate new airport points are cast randomly by the Monte Carlo method. It should be noted that the random cast sites have certain restrictions, such as keeping away from mountainous areas and avoiding placing two cast sites too close to each other. The overall structure and coverage are shown in . All airspace information is stored and associated using the GeoSOT-3D airspace database, and the grid code is used as the primary key for the index query.
Figure 3. Yangtze river delta airspace constructed using the GeoSOT-3D method. The blue grid points represent the preselected locations of the airport, and the black grid points refer to the disaster area locations. The yellow grid represents the coverage level of the grid by the airport; the darker the color is, the higher the level.
3. Methodology
3.1. GeoSOT-3D global subdivision grid model
GeoSOT is a geographical coordinate grid subdivision by a one-dimensional integer and two to nth power. The GeoSOT-3D global subdivision grid model proposed for this study is a universal and hierarchical three-dimensional geospatial reference system (Cheng, Tong, Chen, & Zhai, Citation2016). By subdividing the Earth through iterations (initially expanding the Earth (180° × 360°) into 512° × 512° grids, then expanding each 1° into 64ʹ, and finally expanding each 1ʹ into 64”), two-dimensional quadtree subdivisions at the degree, minute, and second levels are obtained. In addition, we extended the two-dimensional global subdivision framework into a third spatial dimension: the elevation dimension. The division of the elevation dimension is directly adopted through a dichotomy. The entire range over which the elevation dimension is divided spans from the geocentric position to 50,000 km above sea level. The largest subdivision grid in the highest level (Level 0) of GeoSOT-3D can represent the entire Earth space, while the smallest subdivision grid in the lowest level (Level 32) can represent the centimeter scale.
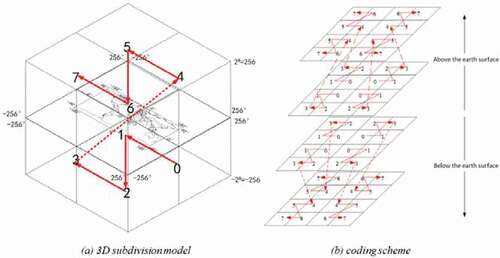
The construction of the GeoSOT-3D code is based on a binary system, which is in accordance with the storage structure of common computer systems and databases. The coding can be expressed by integers, which is suitable for many kinds of storage computing architectures and has high efficiency (Zhai, Han, Li, Duan, & Cheng, Citation2021). The structure of GeoSOT-3D global subdivision grids is shown in below. illustrates a dichotomy algorithm applied in the three directions of longitude, latitude and altitude. The binary digit in the code is set to 1 if the original data are higher than the mean value at the corresponding level; otherwise, the binary digit in the code is set to 0.
Figure 4. Structure of the GeoSOT-3D global subdivision grids. The 1st-level grid encoding order is shown in subfigure (a). The direction of the Z-order coding is determined by the locations of the 1st-level grids. An example of the encoding order is shown in subfigure (b).
Compared with the division system of the Military Grid Reference System (MGRS), the U.S. National Grid (USING) and Google Earth, the GeoSOT-3D space-time coding utilizes a longitude and latitude 64 system and a nonequidistant three-dimensional division method of the Earth ellipsoid, which solves the inheritance problem of traditional maps, two-dimensional and three-dimensional unification, and the problem of efficient spatial calculation. GeoSOT-3D can be used in a global regional reference frame to provide new mechanisms, new technologies and new methods for location identification, spatial indexing and efficient calculation.
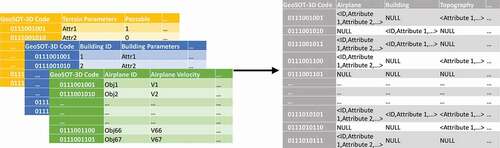
Therefore, based on the GeoSOT spatiotemporal grid code, existing airport facilities and airspace information are included in a grid data index table. Through GeoSOT spatiotemporal multilevel coding, each airport facility and aircraft is given space-time characteristics. Space-time coding is the primary key for querying, and the database can query all the information of the various facilities on the grid (including facility name, coverage, etc.), thus realizing grid storage, organization and association with the basic unit being the unit grid (Lu, Cheng, Jin, & Ma, Citation2013). After gridding the surrounding environment and resource information in the disaster area, all kinds of information can also be effectively correlated and aggregated, the scheduling speed of facility linear planning can be accelerated, and the data storage management structure is designed according to . With GeoSOT-3D coding as the main key, the airspace database integrates all kinds of information, and the subtables form a complete large table. Terrain, airplanes, buildings, etc., are stored in the large table.
Figure 5. GeoSOT-3D airspace database management table.
At the same time, compared to traditional latitude and longitude spatial expression methods, GeoSOT-3D grid division technology can quickly complete spatial calculation operations such as intersections and differences. Based on GeoSOT-3D global subdivision grids, the influence of topography on planning was considered. Facility site optimization calculations such as facility coverage level queries and real-time updates of airspace information can be completed in a stable and fast manner, and the results can be stored and intuitively visualized in a spatiotemporal grid.
3.2. Emergency airport site selection algorithm
In this paper, the GeoSOT grid modeling operation is performed on the selected area to establish a spatiotemporal grid at the appropriate level. Then, the built-up airports are used as the center to establish the maximum coverage circular area of each airport described in Section 2. The disaster-affected area is the key area for emergency airport supply, and multiple airports are required to provide resources to the area. Therefore, the disaster-affected area must have as much multiple airspace coverage as possible.
The algorithm needs to plan a new emergency airport for rescue to meet the following requirements:
① By building a new airport, the largest area that can be covered by aircraft is expanded as much as possible so that the number of aircraft arriving at the disaster site reaches the threshold;
② The airport coverage of the disaster-stricken area is increased by as much as possible by constructing a new airport.
The site optimization algorithm constructs the objective function, iterates step by step through the SA algorithm, and then selects the optimal emergency airport location at a preselected location. The location of the airport construction should be judged according to the cost objective function. The cost function of the algorithm considers various factors of the facility itself and its surroundings, such as the airport dispatch distance (or time), transportation cost, and difficulty in the construction of supporting facilities. The difficulty in solving the site selection problem is to establish objective functions with different weights for different disaster areas. This article achieved this goal by solving the global optimal solution of airport planning in the current state through the SA algorithm and the penalty function method.
This paper constructs the objective function according to the simulated disaster area:
where ,
and
are the weight values of the three types of elements;
represents the coverage set after adding a new airport; and
represents the environmental parameters of the grid where the new airport is located, which is defined in the following way:
where is expressed as the candidate airport grid code, and
refers to the grid code of terrain obstacles in the airspace environment.
is the Manhattan distance between the candidate airport and each terrain obstacle in the airspace. The greater the value of
is, the better the environment.
In the objective function , to minimize emergency airport coverage redundancy in the disaster area, this article uses a penalty function construction method.
is a penalty function that constructs a cost penalty value to avoid wasting resources due to the excessive coverage redundancy of the disaster area. The idea of the penalty function is to transform the constrained optimization problem into an unconstrained optimization problem for solving (Mota-Palomino & Quintana, Citation1986). To ensure the approximation quality of the solution, the objective function of the unconstrained optimization problem is the objective function of the original constrained optimization problem plus the penalty term related to the constraint function. For points outside the feasible region, the penalty term is negative; that is, the location of the emergency facility is punished. For points within the feasible region, the penalty term is 0, which means that no penalty is imposed. Therefore, by adding a penalty term, we can make the solution of the optimal location problem fall within the feasible region:
This article selects the structure of the quadratic penalty function (Zhao, Wu, & Yin, Citation2020), where the second term from the right of the equation is called the penalty term, is called the penalty factor, and
represents that the coverage level of the disaster area is not greater than the redundancy value
. Ultimately, the optimized site selection algorithm requires the occurrence of a sudden major disaster environment in the Yangtze River Delta and airport emergency deployment to ensure global optima, that is, a maximum objective function value of
.
After completing the design of the objective cost function, this paper uses the simulated annealing (SA) algorithm to optimize the site of the facility. The advantages of the SA algorithm is that it has fast calculation speed and does not easily fall into a local optimum in the facility site selection problem (Allahyari & Azab, Citation2018). At the same time, combined with the GeoSOT-3D environment modeling method, this approach can greatly improve the calculation efficiency of steps such as distance disturbance, and the SA algorithm can effectively integrate the environmental information in a spatiotemporal grid database. When the location of the emergency airport is disturbed, the location is randomly determined within a certain range depending on the current annealing temperature. The lower the annealing temperature is, the smaller the range of the disturbed airport that can be distributed. The following is the specific design of the emergency airport site selection (EASS) algorithm:
Step 1: According to the established airport location and coverage area, a new candidate airport construction area is proposed as a candidate solution set . Specify the number of airports to be constructed
and the coverage area
of the new airport.
Step 2: Specify the annealing initial temperature and its reciprocal, the annealing termination temperature
and its reciprocal, and the number of temperature changes
. Calculate each SA temperature using
to obtain the simulated annealing temperature table. We define
as 80°C,
as 30°C, and
as 3°C in this algorithm.
Step 3: Deploy an initial solution for a given airport, which means that locations are randomly selected as airport construction points for alternative airport
according to the number of airports to be built. Calculate the objective cost function of the initial solution and set the initial solution as the initial temperature
.
Step 4: According to the current temperature , perturb the range of ρ airport locations. The lower the temperature is, the lower the degree of disturbance to the airport location. The following formula determines whether to accept the disturbance:
where represents the probability of accepting this perturbation,
represents the annealing temperature under the plan, and
represents the change in the objective function value caused by the position perturbation. If
, the disturbance increases the objective function, and the acceptance probability is 100%; if
, the probability of accepting the grid movement is
, which means that the lower the temperature is, the greater the acceptance probability. If the disturbance is accepted, the airport location where the disturbance is completed is deployed as a new location. Then, we continue the disturbance analysis on the next intermediate grid.
Step 5: Complete the traversal of all the airport grids to be constructed, assign the next annealing temperature from the annealing temperature table to the new airport deployment situation, and return to step (3) to continue the annealing iteration.
Step 6: As the temperature decreases, the change in the location of the airport decreases, and its objective function tends to a stable maximum. When the annealing temperature reaches the annealing termination temperature , complete the simulated annealing and output the final emergency airport planning plan.
This EASS algorithm constructs an objective function and penalty function to solve the planning problem under the coverage limitation in airport construction, and through multiple iterations of the SA algorithm, the optimal airport construction location can be selected from multiple candidate points. As the global optimum can be found, the convergence of the objective function is verifiable. Through the abovementioned facility system site selection algorithm, the newly built emergency airport will be able to effectively meet the requirements of the actual scene and ensure the coverage of the disaster area and the breadth and depth of the rapid deployment of resources.
4. Results
After completing the data collection simulation and establishing the optimal EASS, this study carried out related experiments and developed a visual display using the Cesium platform. The main three experiments were conducted: 1) the impact of the number of emergency airports on the coverage of the disaster area; 2) a comparison of the SA algorithm’s coverage of the disaster area under different disaster point aggregation levels; and 3) a comparison of the efficiency of different environmental modeling methods. By the controlled variable method, the weights for the coverage, penalty and environmental parameters for the objective function are chosen by multiple experiments, and then, the best performing planning results are selected as the weighting values. After a number of trials, this paper determines that the penalty factor = 0.35, the redundancy value
= 6, and
for ordinary circumstances in the Yangtze River Delta to optimize the EASS algorithm. When selecting sites for emergency airports in other areas, the weights need to be redetermined based on the location and number of disaster sites and the number of terrain obstacles in the airspace.
4.1. The impact of the number of emergency airports on airspace coverage
Airports are the world’s fastest and most costly material layout center (Le, Zheng, Huang, & Pei, Citation2019). Therefore, preset different numbers of emergency airports greatly impact the supply of resources in the disaster area. In the case of low aggregation in the disaster area, this paper compares the planning result of the number of emergency airports, which is shown in .
Figure 6. Airspace situation with different numbers of emergency airports (Level 11). In the figure, the yellow grid represents the coverage area of the original airport. The darker the color is, the higher the coverage level of the area. The red grid represents the emergency airport and its coverage. (a), (b), (c), and (d) represent the site selections formed by adding 1–4 emergency airports.
With the establishment of the emergency airport, the disaster points are well covered, and the entire Yangtze River Delta airspace is also effectively covered. The increase in the number of emergency airports can guarantee the supply of personnel and materials within the disaster area and airspace, but in the figure, the marginal effect of the new emergency airport is increasing. Therefore, the problem of selecting an appropriate number of airports from candidate airports is worthy of consideration. This article continues the statistical analysis of the coverage elements based on the planning results.
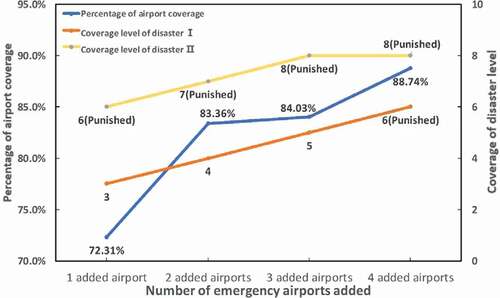
We define “percentage of airport coverage” as the coverage of the new emergency airport to the entire Yangtze River Delta; “coverage of disaster level” represents the extent to which two disaster sites are covered by the current airport and the new airport; and the degree of coverage reaching “punished” is redundant coverage. The weights designed in this experiment determine the priority of the coverage level of the disaster area over the coverage of the whole area. Therefore, a part of the nondisaster area is not covered, which is a necessary trade-off for emergency airport site selection. As seen in , the percentage of airport coverage reached 83.36% under 2 added airports. However, with the addition of two more emergency airports, the coverage increased by only 5.38%. With the increase in the number of emergency airports, the growth of the percentage of airport coverage was rapid at first but slowed later. Two disaster sites were covered at multiple levels with the new value of an emergency airport. The coverage level of the disaster area also entered a state of approximate redundancy after the construction of the second emergency airport.
Figure 7. Impact of emergency airport changes.
4.2. The impact of different disaster aggregation levels on emergency airport site selection
This article assesses different disaster aggregation levels, namely, the setting of the grid distance between two disasters. Using the GeoSOT-3D spatial grid distance calculation formula, this paper adopts a binary 3D grid coding structure based on the establishment of the grid neighborhood model. This paper calculates the distance between two grid points quickly using grid coding. The method uses the Manhattan distance, which represents the sum of the wheelbases of the two grids in the coordinate system, as the distance standard (Rivera, Hernández, Hormazábal, & Baier, Citation2020). This article stipulates that is a high degree of aggregation, and
is a low aggregation situation in the disaster area.
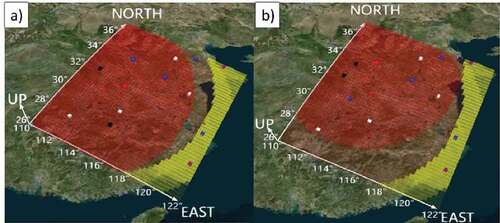
Based on the conclusion of Section 4.1, the experiment selected 2 emergency airports from the candidate locations and arranged the emergency airport facilities with high aggregation and low aggregation of the disaster areas. The results are shown in . Therefore, the degree of aggregation in the disaster area affects the site selection of additional emergency airports to some extent. The more disaster sites are clustered, the more concentrated the locations of the corresponding emergency airports will be.
Figure 8. Site selection of emergency airports with different aggregations of disaster points. (a): Highly aggregated locations of two disaster areas; (b): Lowly aggregated locations of areas.
4.3. The efficiency of different modeling environments
To compare the efficiency of GeoSOT-3D and the traditional latitude and longitude method in facility planning, this paper carries out experiments using the same parameters and degree of aggregation and selects two candidate points as the location of the emergency airport according to EASS. The result is shown in . In an identical airspace, the experiments use different environmental modeling methods to plan the emergency airport site. The site selection time refers to the computing time using the simulated annealing algorithm to obtain the optimal site. The coding storage time refers to the cost of storing information in the airspace database in different environment modeling situations.
Figure 9. Time of storage consumption and site selection in an identical airspace.
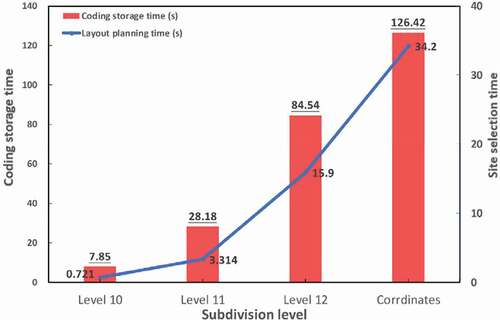
According to the statistical results, the traditional longitude and latitude coordinates method leads to a large site selection time and storage need. Adopting GeoSOT-3D level 11, the coding storage time and site selection time are approximately 22% and 10% for the coordinate method, respectively. By selecting the appropriate level of GeoSOT-3D, because the discrete grid has the characteristics of space-time discrete storage, the global subdivision grids achieve the required rapid linear algorithm design and data storage in emergency airport planning.
5. Discussion
As an important aspect of emergency facilities, the efficiency and correctness of the site selection algorithm of the emergency airport is related to the rescue of the disaster area. This paper conducts numerical and simulation experiments to verify the efficiency and feasibility of the algorithm under different initial states. When analyzing the impact of the number of emergency airports, due to the penalty function, the coverage level of the disaster area will be redundant when there are many new airports in the Yangtze River Delta airspace. We suggest that in the site selection algorithm of this article, only 2 (no more than 3) emergency airports should be constructed. Once emergency airport coverage is overconfigured, it will not only increase the penalty function but also add to the high cost of building an airport.
For the impact of different disaster aggregation levels, when disasters are densely distributed, the weight of the disaster point coverage level should be reduced to ensure that the emergency airport site is more dispersed. The standards of emergency airport construction are somewhat lower than those of conventional airports, but the renovation of facilities after disaster relief is a reasonable use of resources, and the site selection of emergency airports obtained by the algorithm in this paper is able to meet the effective coverage of general airspace. After the disaster is resolved, a qualified emergency airport can be transformed into a general airport for civilian or military use.
To verify the efficiency of airspace modeling, this research compares the site selection time and the coding storage time under GeoSOT-3D adopted in this paper with the traditional latitude and longitude method as the control group. GeoSOT-3D, as a DGGS, has superior spatiotemporal computing and storage capabilities. The results show that with GeoSOT-3D grid level 11 selected for the current experiment, the algorithm’s computational and storage efficiency are 4–5 times higher than those of the latitude and longitude methods.
After experimental verifications, this paper indicates that the method can effectively and reasonably solve the emergency airport site selection issue in different circumstances. In subsequent research, we will strengthen the consideration of environmental factors, such as whether it is close to the river, the local weather and wind direction when the disaster occurs. The use of the GeoSOT-3D environmental modeling method enables more effective and rapid correlation and integration of related geographical environment elements, thereby speeding up the site optimization of facilities.
6. Conclusions
This paper proposes the use of the emergency airport site selection (EASS) algorithm in the Yangtze River Delta based on the GeoSOT-3D global subdivision grid. Using GeoSOT-3D environment modeling, all the information about the environment is stored in the grid database in the form of grid primary keys. The airport preselection points under constraints are constructed through Monte Carlo simulation.
Subsequently, this paper proposes an objective function that adds a penalty factor to solve the constraints of coverage and the environment in airport construction. Through multiple iterations of the simulated annealing algorithm, the optimal airport construction location can be selected from multiple preselected points. Through a number of simulation experiments, this paper proves that the algorithm can effectively and reasonably complete the emergency airport site selection task under the conditions of low and high degrees of disaster site aggregation. At the same time, compared with the longitude and latitude environment modeling method, GeoSOT-3D has faster query and retrieval efficiency and fewer database storage items, which shows the great site selection advantages of DGGSs in spatiotemporal correlation and calculation.
In subsequent work, the EASS model in this article can also be further applied to the planning of emergency facilities (such as isolation points and rescue stations) for small-scale emergencies in urban environments to ensure reasonable coverage of isolation points. We hope to build an intelligent planning system that can automatically complete the rapid site planning of emergency facilities in different fields and scenarios when the weights are known in order to truly protect the safety of personnel and property. In disaster-prone times, EASS can ensure a rapid supply of resources in the case of disaster outbreak. The site selection of facilities such as fire trucks and nucleic acid detection points can also be accomplished with the site selection algorithm in this paper to truly achieve comprehensive protection against different disaster levels.
Disclosure statement
No potential conflict of interest was reported by the author(s).
Data availability statement
The data that support the findings of this study are available from the corresponding author upon reasonable request. Aggregated data of processing is available from 10.18170/DVN/9CR647.
Additional information
Funding
Notes on contributors

Bing Han
Bing Han received the B.E. degree in aerospace engineering from University of Electronic Science and Technology, Chengdu, China in 2020. Currently, he is pursuing the Ph.D. degree of data science in Peking University, China. His research interests include spatio-temporal knowledge graph, UAV navigation and global subdivision.

Tengteng Qu
Tengteng Qu received her B.E. degree in surveying engineering in 2011 and the Ph.D. degree in photogrammetry engineering and remote sensing in 2017 from Tongji University. Since 2018, she has worked as a Postdoc in College of Engineering, Peking University, China, and Research Assistant Professor in Peking University Collaborative Innovation Center for Geospatial Big Data. Her research interests focus on geospatial big data, global subdivision grids, and SAR remote sensing. Since 2019, she has served as a standard expert of geographic information in IEEE Standards Association, Open Geospatial Consortium (OGC) and the International Organization for Standardization (ISO).

Zili Huang
Zili Huang received his M.Sc. degree in 1998 from PLA Institute of Engineering Corps. He is now a senior researcher in Institute of Defense Engineering, AMS, PLA. His research interests focus on battlefield system demonstration.

Qiangyu Wang
Qiangyu Wang received the B.E.degree in computer science and technology from Shandong University of science and technology, Qingdao, China in 2012. He received the Master degree in advanced computer science in 2014 from Newcastle University and Ph.D. degree in computer system structure in 2019 from China University of mining and technology. He worked as a Postdoc in College of Engineering, Peking University, China since 2019. His research interests include spatio-temporal big data and parallel computing.

Xinlong Pan
Xinlong Pan received his B.Sc. and M.Sc. degrees in radar engineering in 2006 and 2010 respectively from the Air Force Radar Academy, China. He received the Ph.D. degree in information and communication engineering in 2017 from Naval Aviation University, China. Now he serves as a lecturer in Naval Aviation University. His research interests include geographic information engineering, trajectory data mining, intelligent information processing, and expert systems.
References
- Allahyari, M. Z., & Azab, A. (2018). Mathematical modeling and multi-start search simulated annealing for unequal-area facility layout problem. Expert Systems with Applications, 91, 46–62.
- Basciftci, B., Ahmed, S., & Shen, S. (2021). Distributionally robust facility location problem under decision-dependent stochastic demand. European Journal of Operational Research, 292(2), 548–561.
- Boonmee, C., Arimura, M., & Asada, T. (2017). Facility location optimization model for emergency humanitarian logistics. International Journal of Disaster Risk Reduction, 24, 485–498.
- Caccetta, L., & Dzator, M. (2005, December). Heuristic methods for locating emergency facilities. In Proceedings Modsim (Vol. 2005).
- Černý, V. (1985). Thermodynamical approach to the traveling salesman problem: An efficient simulation algorithm. Journal of Optimization Theory and Applications, 45(1), 41–51.
- Cheng, C., Tong, X., Chen, B., & Zhai, W. (2016). A subdivision method to unify the existing latitude and longitude grids. International Journal of Geo-Information, 5(9), 161.
- Conway, D. G., & Venkataramanan, M. A. (1994). Genetic search and the dynamic facility layout problem. Computers & Operations Research, 21(8), 955–960.
- Erkan, T. E., & Elsharida, W. M. (2019). Overview of airport location selection methods. International Journal of Applied Engineering Research, 14(7), 1613–1618.
- Goodman, A., Manbeck, K., Ricks, B., & Solow, A. (1986). Emergency facilities location. Mathematical Modelling, 7(4), 603–610.
- Hu, X., & Cheng, C. (2014, June). The three-dimensional data organization method based on GeoSOT-3D. In 2014 22nd International Conference on Geoinformatics (pp. 1-4). IEEE.
- Jian-hong, W. R. Y. C., & Li-bing, Y. A. N. G. (2009). A Decision-Making Model for the Locations of Emergency Rescue Facilities [J]. Industrial Safety and Environmental Protection, 11.
- Kaku, B. K., & Mazzola, J. B. (1997). A Tabu-search heuristic for the dynamic plant layout problem. Informs Journal on Computing, 9(4), 374–384.
- Khajemahalle, L., Emami, S., & Keshteli, R. N. (2020). A hybrid nested partitions and simulated annealing algorithm for dynamic facility layout problem: A robust optimization approach. INFOR: Information Systems and Operational Research, 59(1), 74–101.
- Kirkpatrick, S., Gelatt, C. D., & Vecchi, M. P. (1983). Optimization by simulated annealing. Science, 220(4598), 671–680.
- Le, N., Zheng, Y., Huang, Q., & Pei, Y. (2019, October). Prospect of 5G Application in Civil Airport. In 2019 IEEE 1st International Conference on Civil Aviation Safety and Information Technology (ICCASIT) (pp. 591-595). IEEE.
- Liao, Y., & Bao, F. (2014). Research on airport site selection based on triangular fuzzy number. In Applied Mechanics and Materials (Vol. 505, pp. 507-511). Trans Tech Publications Ltd.
- Lu, N., Cheng, C., Jin, A., & Ma, H. (2013, July). An index and retrieval method of spatial data based on GeoSOT global discrete grid system. In 2013 IEEE International Geoscience and Remote Sensing Symposium-IGARSS (pp. 4519-4522). IEEE.
- Mota-Palomino, R., & Quintana, V. H. (1986). Sparse reactive power scheduling by a penalty function - linear programming technique. IEEE Transactions on Power Systems, 1(3), 31–39.
- Peto, J. (2020). Covid-19 mass testing facilities could end the epidemic rapidly. BMJ, 368, m1163.
- Rivera, N., Hernández, C., Hormazábal, N., & Baier, J. A. (2020). The 2^ k neighborhoods for grid path planning. Journal of Artificial Intelligence Research, 67, 81–113.
- Rodriguez, S. A., De la Fuente, R. A., & Aguayo, M. M. (2020). A facility location and equipment emplacement technique model with expected coverage for the location of fire stations in the Concepción province, Chile. Computers & Industrial Engineering, 147, 106522.
- Sennaroglu, B., & Varlik Celebi, G. (2018). A military airport location selection by AHP integrated PROMETHEE and VIKOR methods. Transportation Research Part D: Transport and Environment, 59, 160–173.
- Sumrit, D., & Thongsiriruengchai, K. (2020). An optimization model for advanced life support ambulance facility location problem. Proceedings, 39(1), 1.
- Toregas, C., Swain, R., ReVelle, C., & Bergman, L. (1971). The location of emergency service facilities. Operations Research, 19(6), 1363–1373.
- Yang, Z., Yu, S., & Notteboom, T. (2016). Airport location in multiple airport regions (Mars): The role of land and airside accessibility. Journal of Transport Geography, 52, 98–110.
- Zhai, W., Han, B., Li, D., Duan, J., & Cheng, C. (2021). A low-altitude public air route network for UAV management constructed by global subdivision grids. PLoS One, 16(4), e0249680.
- Zhao, X., Wu, P., & Yin, X. (2020). A quadratic penalty item optimal variational mode decomposition method based on single-objective salp swarm algorithm. Mechanical Systems and Signal Processing, 138, 106567.