
 ?Mathematical formulae have been encoded as MathML and are displayed in this HTML version using MathJax in order to improve their display. Uncheck the box to turn MathJax off. This feature requires Javascript. Click on a formula to zoom.
ABSTRACT
Human activities modulate the impact of environmental forcing in general and of climate in particular. Information on the spatial and temporal patterns of human activities is in high demand, but scarce in sparsely populated and data-poor regions such as Northern Africa. The intensity and spatial distribution of nighttime lights provide useful information on human activities and can be observed by space-borne imaging radiometers. Our study helps to bridge the gap between the DMSP-OLS data available until 2013 and the NPP-VIIRS data available since 2013. The approach to calibrate the OLS data includes three steps: a) inter-calibrate the OLS DN data acquired by different sensors in 1992–2013; b) calibrate the OLS DN data using VIIRS data in 2013; c) generate synthetic OLS radiance data by degrading the VIIRS data in 2013–2020. We generated a) a time series of calibrated OLS nighttime light radiance data (1992–2013); b) mean annual VIIRS radiance on stable lights at the OLS spatial resolution for 2013–2020; c) synthetic OLS radiance data generated using VIIRS radiance data degraded to match the radiometric specifications of OLS for 2013–2020. The evaluation of these data products in 2013 documented their accuracy and consistency.
1. Introduction
Recently, the northern Equatorial Africa and Sahel region has been a hot spot in global environmental issues. Besides being influenced by climate, such as rainfall variability, the influence of human activities has been critical in determining the impact of recurrent drought spells and in enhancing environmental degradation in the Sahel (Park, Bader, & Matei, Citation2016). With the rapid increase in infrastructure and population, the anthropic impact in the Sahel is becoming more and more significant (Mortimore, Citation2016; Dawelbait & Morari, Citation2012; He et al., Citation2013; Mariano et al., Citation2018). Nighttime light remote sensing is a useful technology to capture the temporal and spatial distribution of human activities (Ghosh, Anderson, Elvidge, & Sutton, Citation2013; Li, Zhao, & Li, Citation2016) and has been widely applied in urbanization studies (Chen, Prishchepov, Fensholt, & Sabel, Citation2020; Frolking, Milliman, Seto, & Friedl, Citation2013; Xu, Ma, Zhou, & Zhou, Citation2014), socio-economic assessments (Doll & Pachauri, Citation2010; Li et al., Citation2016; Sun, Li, Wei, & Mi, Citation2016), and natural and humanitarian disasters monitoring (Chen et al., Citation2020; Jiang, He, Long, & Liu, Citation2017; Li et al., Citation2016).
The Defense Meteorological Satellite Program (DMSP) Operational Linescan System (OLS) acquired a nighttime light data record, spanning from 1992 to 2013, which is the longest available time series of nighttime light data with irreplaceable relevance for multiple applications (Jiang et al., Citation2017). The OLS records nighttime light radiance with 6-bit quantization digital numbers (DNs) at the spatial resolution of 2.7 km x 2.7 km (at nadir without geolocation errors) (Baugh, Elvidge, Ghosh, & Ziskin, Citation2010). Since 2013 the successor of DMSP-OLS is the National Polar-orbiting Partnership (NPP) Visible Infrared Imaging Radiometer Suite (VIIRS) that records nighttime light radiance at unprecedented radiometric resolution and accuracy using a dedicated spectral band with 14-bit radiometric resolution. Compared with DMSP-OLS nighttime light data, the NPP-VIIRS nighttime light data have notably improved in the following aspects: (1) VIIRS has a much finer spatial resolution of 742 m (across full scan) than the 2.7 km (at nadir) of OLS; (2) VIIRS is characterized by a much smaller minimum detectable radiance than OLS; (3) VIIRS has on-board calibration, thus measuring radiance accurately, while OLS does not. (4) VIIRS overcomes the saturation problem, which is evident in OLS data, with a much wider dynamic range (Elvidge, Baugh, Zhizhin, & Hsu, Citation2013; Li, Zhou, Zhao, & Zhao, Citation2020). The challenge to construct an extended time series on nighttime light is, therefore, to inter-calibrate the 6-bit OLS data in arbitrary units (DN-s) to the 14-bit very accurate VIIRS radiance. In practice, any attempt to establish such calibration has to deal with paired OLS and VIIRS observations where multiple VIIRS radiances correspond to a single DN-value.
This issue has been addressed in the literature, but few studies focused on northern Equatorial Africa and Sahel. Some scholars established a relationship between the OLS DN values and VIIRS radiance by regression analysis of the total nighttime light NPP-VIIRS radiance and total of nighttime light DMSP-OLS DNs within a given administrative region (Liu, Wang, Zhang, & Lu, Citation2020; Lv, Liu, Wang, Liu, & Shang, Citation2020; Yue, Tian, Yue, & Wang, Citation2020; Zhao et al., Citation2019; Zhu, Ma, Yang, & Ge, Citation2017). This method ignores, however, the relation between the two sets of measurements at the pixel level, and neglects the relationship in the low-radiance range. “Total of nighttime lights “is the regional accumulation of nighttime light intensity of all pixels in a region, which is usually a much larger value than those in individual pixels. The noise equivalent delta radiance, NEδL, which defines the minimum radiance detectable by VIIRS, is much lower than that by OLS. This implies that OLS DN = 0 while the VIIRS radiance L starts to increase. When the OLS NEδL is reached, also the OLS DN starts to increase and an approximately linear relationship between the OLS DN and VIIRS L appears. Since the OLS dynamic range is much smaller than that of VIIRS, at some point, the maximum OLS DN value will be reached, i.e. OLS will saturate, while the VIIRS L will continue to increase. This gives a relationship between the VIIRS L and the OLS DN values, with an approximately linear relationship between low and high OLS DN values. Some scholars applied the sigmoid model to inter-calibrate the VIIRS L and the OLS DN measurements (Li et al., Citation2020; Ma, Guo, Ahmad, Li, & Hong, Citation2020; Zhao et al., Citation2020). As mentioned above, each OLS DN value corresponds to a range of NPP-VIIRS radiance values because of the much coarser radiometric resolution and narrower dynamic range of DMSP-OLS than NPP-VIIRS. The accuracy of these models is, therefore, often affected by outliers. When this method was applied to the DMSP-OLS and NPP-VIIRS data sets in northern Equatorial Africa and Sahel region, we obtained relatively poor results with a lower determination coefficient of the calibration relationship than documented in the literature. Other studies used daily or monthly DMSP-OLS nighttime light data, which makes it easier to construct a data set of simultaneous observations, but is difficult to obtain (Li, Li, Xu, & Wu, Citation2017; Shao et al., Citation2014). Zheng, Weng, and Wang (Citation2019) (Zheng et al., Citation2019) generated DMSP-like DN data from 1996 to 2017 using global radiance calibrated OLS data, which are only available for 1996, 1999, 2000, 2003, 2004, 2006, 2010 and 2011, resulting in a limited temporal coverage compared with the full 1992 to 2020 data record. In some other studies, power functions were applied to model the relationship between NPP-VIIRS radiance and DMSP-OLS DN value (Dong, Li, Li, & Li, Citation2019; Li et al., Citation2017; Wu & Wang, Citation2019). Such models were good and applicable, however, to only a part of the OLS dynamic range, i.e. between 0 and 50, because the power function does not fit well for DN greater than 50. Recently, the Earth Observation Group (EOG) released an extension annual F15 – 16 DMSP nighttime lights DN data (2014–2019) to extend DMSP-OLS data to some extent. Due to the huge difference in overpass time (9 hours) between the extension data and the original global DMSP-OLS nighttime lights time series, it is difficult to use them to get a consistent DMSP-OLS DN time series. In addition, few studies generated long time series nighttime light radiance data. We concluded that a better method was needed to harmonize the OLS DN values and the VIIRS radiance measurements and to generate an extended time series of nighttime light radiance data for the entire 1992–2020 data record to deliver much-needed information on anthropic activities in the northern Equatorial Africa and Sahel regions.
In this study, we proposed a median calibration method to extend the temporal range of OLS data on stable nighttime light sources to 1992–2020 in northern Equatorial Africa and Sahel, by generating synthetic OLS data for the period 2013–2020 using NPP-VIIRS monthly data. The core of the method is based on binning collocated 2013 VIIRS radiance and OLS DN data for each OLS DN value. Unlike sample mean values, the median value reduces the influence of outliers. Therefore, we then calculated the median of the NPP-VIIRS radiance values for each DN bin. Finally, we established the calibration relationship by fitting the median NPP-VIIRS radiance and the DMSP-OLS DN values. The use of sample medians is a practical way to deal with the large gap in the radiometric resolution and dynamic range of VIIRS and OLS. With the application of the 1992–2013 OLS inter-calibration and the 2013 median calibration, we generated a) a time series of calibrated OLS nighttime light radiance data (1992–2013); b) mean annual VIIRS radiance for stable lights at the OLS spatial resolution for 2013–2020; c) synthetic OLS radiance data generated using VIIRS radiance data degraded to match the radiometric specifications of OLS for 2013–2020 at the spatial resolution of OLS annual image data product on stable lights, i.e. 0.0083° (~1000 m).
2. Materials and methods
2.1. Study area and data
2.1.1. Study area
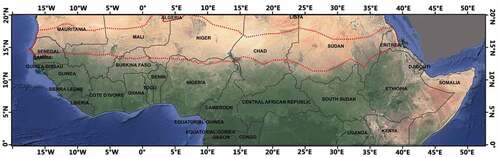
Northern Equatorial Africa is our study area located between the equator and 20 °N in the African continent, including Senegal, Mauritania, Mali, Burkina Faso, Niger, Nigeria, Chad, Sudan, South Sudan, Eritrea, Cameroon, Central African Republic, and Ethiopia from west to east (). The study area includes the Sahel region, which has well-defined geographic boundaries and is usually defined by the annual precipitation gradient from 100 mm a−1 (in the north) to 600 mm a−1 (in the south). It can be seen () that the study area is characterized by a typical north–south ecological transition from the Sahara desert to the savanna. The study area is located in the tail of the African monsoon climate. On average, the difference in annual rainfall between the south and the north can reach up to 1100 mm a−1. As a region with significant ecological vulnerability, human activities will dramatically affect the environment of northern Equatorial Africa and the Sahel. Therefore, the exploration of new information on human activities is of great significance to the management of the environmental and social resources in this region, as well as to the understanding of the local and global ecological environment.
Figure 1. The study area: the northern Equatorial Africa and Sahel region (shown by Google Earth Image). The Sahel region, defined by precipitation gradient, is shown by the red dashed area.
2.1.2. Data Sources
We used the DMSP-OLS annual image data product on stable lights extracted from DMSP-OLS Nighttime Lights Time Series Version 4 (from 1992 to 2013) and NPP-VIIRS monthly data on nighttime lights Version 1 (from 2013 to 2020). These VIIRS data are monthly composite radiance images. Further details on the radiometry of these measurements are provided below.
DMSP-OLS measures nighttime light signals with a 6-bit quantization radiometric resolution in arbitrary units, i.e. digital numbers (DNs), at a spatial resolution of 2.7 km (at nadir without geolocation errors) (Baugh et al., Citation2010; Elvidge, Baugh, Kihn, Kroehl, & Davis, Citation1997), using the panchromatic visible near-infrared (VNIR) band (0.4–1.1 μm). The minimum detectable radiance NEδL is 0.5 × 10⁻⁹ W∙cm−2∙sr−1 (Elvidge et al., Citation2013). The original DMSP-OLS digital data are often referred to as “archived DMSP-OLS data”. The archived DMSP-OLS data were separately acquired by six individual satellite sensors, and each satellite was designated by a flight number (). The DMSP-OLS annual image data product on stable lights, which was used in this study, has a 0.0083° (~1000 m) grid spatial resolution by compositing all the archived DMSP-OLS data for each calendar year. This data set only retains stable nighttime light sources by eliminating sunlight, moonlight, ephemeral lights, etc. The image data product was generated by the Earth Observation Group (EOG) from the Colorado School of Mines (Baugh et al., Citation2010; Elvidge et al., Citation1997) and is available online: https://eogdata.mines.edu/dmsp/downloadV4composites.html.
Table 1. Names of DMSP-OLS annual stable imagery product available for the satellite flying years.
NPP-VIIRS embodies major advancements in nighttime imaging capabilities when compared with OLS (). NPP-VIIRS measures nighttime light in the Day and Night Band (DNB) with a similar spectral coverage as the OLS VNIR band, i.e. 0.5–0.9 μm. Instead of the DNs recorded in OLS nighttime light data, VIIRS measures the nighttime light radiance with a 14-bit radiometric resolution, and the minimum detectable radiance is 0.2 × 10⁻⁹ W∙cm−2∙sr−1 (Elvidge et al., Citation2013). The spatial resolution is 742 m (across the full scanline) (Elvidge et al., Citation2013; Liao, Weiss, Mills, & Hauss, Citation2013), but the NPP-VIIRS monthly nighttime light data product is gridded to 0.0042° (~500 m) geographic grids by filtering and averaging the actual daily VIIRS radiometric data to filter out the effects of stray light, lightning and moonlight. This dataset is produced by the Earth Observation Group from the Colorado School of Mines and available online: https://eogdata.mines.edu/download_dnb_composites.html.
Table 2. Specifications of DMSP-OLS VNIR band and the NPP-VIIRS Day/Night band (DNB).
2.2. Methodology
2.2.1. General
The purpose of this study is to extend the existing DMSP-OLS data record (1992–2013) by generating synthetic DMSP-OLS radiance data for the subsequent period (2013–2020) using NPP-VIIRS monthly data. This will lead to a harmonized time series of calibrated DMSP-OLS image data on nighttime light for the entire period 1992 to 2020. Our core idea includes four main steps (see for details): a) construct a data set including OLS and VIIRS observations in 2013 “as concurrent as possible,” given the available data products; b) calibrate the OLS DN data for the period 1992–2012 to OLS DN data in 2013; c) calibrate the 2013 OLS DN to the 2013 VIIRS radiance data and apply the calibration to the 1992–2013 OLS DN data; d) generate 2013–2020 synthetic OLS radiance data consistent with the 1992–2013 OLS radiances using synthetic DMSP-OLS DN calculated by applying the inverse of the calibration established in step b) to the 2013–2020 VIIRS DNB radiance data. The regression analysis will target primarily the radiance range identified by the central quasi-linear segment in the relationship between OLS and VIIRS signals. In other words, we will not consider the two tails (i.e. the low value end and the high value end) of the actual sigmoid relationship between OLS and VIIRS signals; this is due to the fact that the NEδL (the noise equivalent delta radiance) of OLS sensor is too high to capture signals at low radiance and OLS is saturated at high radiance. Once the calibration is established and validated, we will generate consistent data on nighttime lights for northern Equatorial Africa and Sahel from 1992 to 2020. The details of the workflow () will be described in the following sub-sections.
Figure 2. Workflow to generate the harmonized annual nighttime light radiance data for northern Equatorial Africa and Sahel from 1992 to 2020.
2.2.2. Data pre-processing
The VIIRS dataset used in this study has a higher temporal resolution, i.e. monthly vs. annual, and spatial resolution, i.e. 0.0042° (~500 m) vs. 0.0083° (~1000 m), than OLS. Prior to step a) mentioned above; therefore, the VIIRS data must be time-averaged and resampled to match the OLS data. First, the VIIRS data quality has been improved by filtering out noise and refining the definition of light clusters by applying the Patch Filtering Method (PFM) (Yuan, Jia, Menenti, Zhou, & Chen, Citation2019). The PFM only retains persistent light-pixels, filtering out noise and unstable light, and connects them to light-objects. The resulting monthly images contain sharper light objects at the same spatial resolution as the original data. When all the monthly images have been generated, the annual image on stable nighttime lights is generated by pixel-wise averaging. Next, the VIIRS annual image has to be resampled to the OLS spatial resolution, i.e. 0.0083° (~1000 m). This is done by mimicking how OLS would “see” the smaller VIIRS pixels, i.e. by applying the estimated OLS Point Spread Function (PSF) to resample the VIIRS annual image. We have assumed a Gaussian PSF with a standard deviation of about 3 VIIRS pixels (Abrahamsa, Oramc, & Lozano-Gracia, Citation2018; Small, Pozzi, & Elvidge, Citation2005). In other words, we applied a spatial filter mimicking how OLS “weights” adjacent VIIRS pixels.
2.2.3. Inter-annual-sensor calibration of DMSP-OLS data
As mentioned above, over the years, DMSP-OLS data were acquired by different satellite sensors (). Over time, the sensors are gradually degrading and eventually failed to provide reliable data, as foreseen by system design, which was based on overlapping periods of operation and tightly scheduled replacement of active satellites and sensors () (Elvidge et al., Citation2009). At any given time (in the satellites overlapping years), there are two active satellites and sensor systems, thus acquiring two nearly simultaneous images on nighttime light. It is difficult to use such data for change analysis because the data are either acquired by the same sensor at different times, i.e. with the degraded performance or by two different sensors in the same year. Elvidge et al. (Citation2009) proposed a method for calibrating OLS data on stable nighttime lights by applying a second-order regression model (Elvidge, Daniel, Baugh, Tuttle, & Mikhail, Citation2009). This method selects an area with relatively stable nighttime light over many years as a reference area, i.e. Sicily in Italy (Elvidge et al., Citation2009), and uses an image in the reference area with the maximum total DNs over the 22 years as a reference image. Then, scatterplots of yearly DN (for the pixels in the reference image) vs. the DN values in the reference image are produced, and the regression analysis estimates a calibration relationship for each year. The yearly equations are applied to the entire data set for each region and year to yield a consistent time series for the entire data record. This method has been widely used in different regions by selecting an appropriate reference area for each region (Bian et al., Citation2019; Li, Lu, Weng, Xie, & Guo, Citation2016; Liu, He, Zhang, Huang, & Yang, Citation2012; Pandeya, Joshia, & Seto, Citation2013; Wu, He, Peng, Li, & Zhong, Citation2013).
We also applied this inter-annual-sensor calibration method to our region, i.e. northern Equatorial Africa and the Sahel, to produce an OLS time series on annual data on stable nighttime lights from 1992 to 2013. First of all, OLS annual DNs of stable nighttime lights measured by different sensors in the same year were averaged to reduce random errors. In addition, we calculated the slope of the linear fitting function of yearly DN at pixel scale. The evolution of the slope is a good indicator of changes in sensor response to light intensity (Bian et al., Citation2019). Ideally, the smaller the slope of time series of pixel-wise nighttime light value is, the smaller the change of nighttime light is and the more stable it would be. The slope threshold should be as small as possible on the premise that the DN values of reference “samples” cover the whole range from 0 to 63. For such purpose, we chose the pixels with a slope <0.01 as the reference in northern Equatorial Africa and Sahel. The 2010 OLS annual image on stable lights gave the highest total DNs and was taken as a reference image for two reasons: on the one hand, studies on nighttime light remote sensing usually pay more attention to information related to human activities, especially in cities and towns. Areas with nighttime light in the DMSP-OLS data must be cities/towns/villages (except for special areas such as oil and gas fields with flares and wildfires), but urban areas do not necessarily have nighttime light due to the impact of power shortages. The image with the largest total nighttime light values (DNs) reflects the cities/towns/villages information that might not be reflected in other images to a certain extent, so the image with the highest total DNs is more relevant to the actual human activities. On the other hand, the inter-annual-sensor calibration of DMSP-OLS data is a process in which the reference image is the “reference”, and other images are corrected to “close” to the reference. From a mathematical point of view, if the low value is used as the reference, the image value after the inter-calibration will decrease correspondingly, which may cause the corrected image value to be negative. According to the scatterplot of the DN value between the reference image and the image to be corrected, we can find that both quadratic linear and power function seem to fit the scatter points. Our experiments showed that the determination coefficients (R2) of quadratic linear and power function could reach 0.95 when we applied these two functions to fit DN in the reference image and the DN of the image to be corrected. This indicates that both the quadratic linear model and the power function model can be used as inter-annual-sensor calibration model for DMSP-OLS nighttime light images. In this study, following the method in Elvidge et al. (Citation2009) (Elvidge et al., Citation2009), we used the quadratic linear function for inter-annual calibration of the yearly OLS annual images of stable nighttime lights. Finally, the calibrated DN, , were calculated as:
where DN denotes the original value in the OLS annual image and –
are the coefficients estimated by the 2nd order regression analysis for each year. We obtained our annual OLS data on stable nighttime lights from 1992 to 2013 in this way, i.e. the annual OLS DN values were calibrated to the 2010 reference DN values.
We evaluated the performance of our inter-annual calibration by comparing the total of nighttime light DNs (TNDN) of the original OLS annual data with our calibrated annual OLS data on stable nighttime lights in northern Equatorial Africa and Sahel. The TNDN was calculated as follows:
where denotes the DN value of the i-th pixel with stable nighttime light and
is the total number of such pixels in northern Equatorial Africa and Sahel.
2.2.4. Generation of synthetic DMSP-OLS data for the period 2013–2020
2.2.4.1. Median calibration relationship
To extend the OLS radiance data record beyond 2013, we generated synthetic OLS radiance data for the period 2013–2020 by degrading the VIIRS radiance data to match the radiometric specifications of OLS. The challenge is how to deal with the large differences between OLS and VIIRS data. The difference is mostly due to differences in the radiometric specifications and performance of the two instruments (see Section 2.1.2). The quantization level of DMSP-OLS data was 6-bit, and the quantization level of NPP-VIIRS data was 14-bit. Therefore, the DN value of the same DMSP-OLS data corresponds to multiple radiance values of NPP-VIIRS, covering a wide range of nighttime light radiance. The median value determines the representative value of the entire sequence of samples by the position of the sample in the sequence. It is not affected by the maximum or minimum value of the distributed sequence and is well representative of the distributed sequence. Therefore, in this study, referring to the Gompertz model (Gompertz, Citation1825), we have proposed and applied a so-called median calibration function in this study to calibrate the OLS DN data. The corresponding median model was established by fitting the DN value of DMSP-OLS image with its corresponding median radiance value in NPP-VIIRS image based on binning collocated 2013 VIIRS radiance for each OLS DN value. This method is not susceptible to outliers and can be implemented easily with robust performance. In detail, the calibration was established using the OLS and VIIRS data in 2013, when the two sensors were both in operation. This relationship can then be applied to all OLS yearly data by using the values (see EquationEquation 1)
(1)
(1) for the year 2013 to convert the 2013 DN values into values consistent with the 2010 DN values. In detail, we binned collocated 2013 VIIRS radiance and OLS DN data for each OLS DN value and calculated the median of the NPP-VIIRS radiances for each DN value (bin). We established the median calibration relationship between the two datasets as below:
EquationEquation 3(3)
(3) can be inverted to yield:
where DN is 2013 DN values, is the median of radiance in the 2013 VIIRS data of the pixels with a given DN value;
,
,
and
are the coefficients of the median calibration relationship. The radiance data corresponding to the OLS DN data for 1992–2013 is obtained by applying EquationEquation3
(3)
(3) . The maximum radiance is obtained for DN = 63, i.e. the estimated OLS radiance data have a radiometric resolution and dynamic range consistent with the OLS specifications. Conversely, given a radiance
, the application of EquationEquation4
(4)
(4) yields an estimated DN value, as needed to generate the synthetic OLS DN data for the period 2013–2020, an intermediate step to generate the final synthetic OLS radiance data.
2.2.4.2. Gaussian low-pass filtering
The final synthetic 2013–2020 OLS radiance data have been generated by degrading the VIIRS radiance data. The latter have been first gridded to the OLS spatial resolution by applying the estimated OLS PSF (Section 2.2.2), then have been temporally averaged to get the annual data on stable nighttime lights. The resulting data were still rather noisy; however, so we applied a Gaussian Low-pass Filter (GLF) to further smooth the generated image data. This approach was proven effective to reduce the residual random noise in previous studies (Li et al., Citation2017; Ma et al., Citation2020; Zheng et al., Citation2019). The VIIRS data capture very bright light sources beyond the OLS saturation; however, so that an intermediate step is needed to apply the GLF. This is done by calculating synthetic OLS DN data from the VIIRS radiance data, as detailed in Section 2.2.4.3. Finally, the calibration EquationEquation3(3)
(3) is applied to the GLF filtered synthetic OLS DN data to obtain the final calibrated OLS radiance data.
The filter replaces the image value at the position with a weighted average calculated as detailed below. The filter operates according to (Ma et al., Citation2020). The weight h is calculated as follows:
where is the pixel at position (i, j) around the central pixel .
is the standard deviation of the weights within the window. Following the approach of (Ma et al., Citation2020), we estimated the most appropriate window size in the range from 3 to 29 pixels and
from 0.1 to 10 pixels by comparing the root mean square error (RMSE) of the filtered synthetic OLS image and the original OLS image on stable nighttime lights.
2.2.4.3. Generation of synthetic DMSP-OLS radiance data
The spatial response of the degraded VIIRS data, filtered as described in the previous Section 2.2.4.2, is consistent with actual OLS data. The next stage in the generation of the synthetic OLS data for the period 2013–2020 is to match the radiometric specifications of OLS. This has been done in four steps:
Determine the DN value corresponding to the VIIRS radiance. This is done by applying EquationEquation 4
(4)
Determine the DN value corresponding to the OLS minimum detectable radiance NEδL. The analysis of the calibrated OLS radiance data in 1992–2013 revealed that NEδL was slightly lower (better) than the specifications (see Section 2.1.2), i.e. NEδL ≈ 0.2 × 10⁻⁹ W∙cm−2∙sr∙−1.
Determine the VIIRS radiance at DN = 63, i.e. determine
Calculate the radiance for each DN value obtained through steps 1, 2 and 3 by applying EquationEquation 3
These steps yield the synthetic DMSP-OLS radiance data for 2013–2020. The OLS calibrated radiance data for 1992–2013 are obtained by applying EquationEquation1(1)
(1) and EquationEquation3
(3)
(3) . The final OLS data set for the entire 1992–2020, therefore, is radiometrically and spatially consistent radiance data on nighttime lights.
In summary (see ), we generated a new data set of calibrated OLS radiance for the period 1992–2020. This required several steps: inter-calibration of OLS data (Section 2.2.3 and 2.2.4.1) acquired by different sensors in (1992–2013); calibration of OLS DN data against VIIRS radiance data in 2013 (Section 2.2.4.1) and generation of the synthetic OLS radiance data for 2013–2020 (Section 2.2.4.2 and 2.2.4.3). The synthetic OLS radiance data for 2013–2020 have a spatial response, radiometric resolution and dynamic range consistent with the actual and calibrated OLS data for 1992–2013. We thus succeeded in extending the temporal coverage of the OLS data on stable nighttime lights from 1992 to 2020.
An intermediate product of the workflow in , i.e. prior to steps 2 and 3 above, is the VIIRS annual data for 2013–2020 with a spatial response consistent with the OLS data, but with the radiometric resolution and dynamic range of the original VIIRS data. Unlike the OLS data for 1992–2013 and 2013–2020, this dataset does not saturate at (OLS DN = 63) and can be used to evaluate the impact of the OLS radiometric limitations in the observation of very bright targets.
The three data sets available in 2013, i.e. the calibrated actual OLS data (identified as OLS2013), the calibrated synthetic OLS data (identified as synthetic-OLS2013) and the spatially resampled VIIRS data (identified as VIIRS2013) can be used to assess our new data products on stable nighttime lights as described below.
2.2.5. Performance evaluation
We evaluated our data products by assessing the similarity of OLS2013, synthetic-OLS2013 and VIIRS 2013, on the basis of the following three aspects:
Similarity of the histograms of OLS2013, synthetic-OLS2013.
Spatial-consistency of the OLS2013, synthetic-OLS2013 and VIIRS2013 by comparing the nighttime light radiance of both large areas and selected pixels.
Temporal consistency of the time series of the OLS nighttime light radiance data by calculating and analyzing the total nighttime light radiance (i.e. TNL) in the study area.
The TNL of a country or a region was calculated in a similar way to TNDN as:
where expresses the radiance in the j-th pixel, and N denotes the total pixel number in a country or a region.
3. Results
3.1. Performance of inter-annual-sensor calibration of DMSP-OLS data
We applied the procedure described in Section 2.2.3, and we finally selected 7286 pixels as reference pixels. To show the stability of reference pixels, nighttime light DN value time series of three reference pixel examples were plotted in . The scatter plots of annual vs. reference DN values (see ) documents the inter-annual variability in the inter-sensor calibration required to get consistent annual data on mean nighttime light intensity. This relationship has been determined by applying EquationEquation 1(1)
(1) , and the inter-annual variability is reflected by the differences in the
,
and
coefficients applying to each year ().
Figure 3. DN value time series of three reference pixel examples.
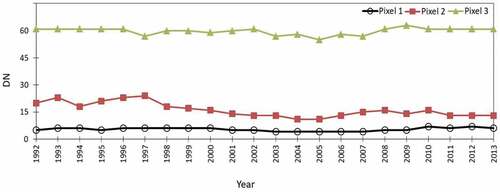
Figure 4. The second-order inter-annual-sensor calibrations (red lines) and scatter plots (black points) of the DN values in each yearly image vs. the DN values in the reference image (DN 2010) for the 7286 reference pixels.
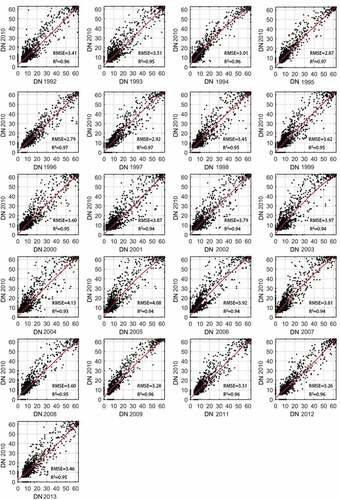
Table 3. Annual values of the ,
and
coefficients of EquationEquation 1
(1)
(1) to calibrate the annual OLS DN values to the reference 2010 DN values.
The coefficients of determination (R2) of the annual relationships () ranged from 0.9341 to 0.97 with a mean of 0.9512, indicating that these models can well explain the relationship between the yearly images and the reference image.
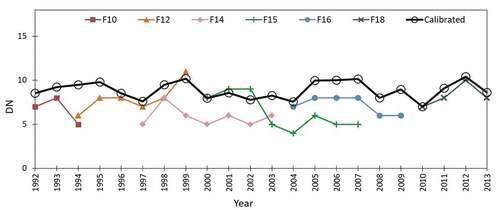
In addition, we evaluated the performance of the inter-annual-sensor calibration by comparing the total of nighttime light DNs (TNDN) according to the original annual OLS data with the TNDN values according to the annual-calibrated OLS data on stable nighttime light (see ). We found that the annual TNDNs after calibration fitted consistently in a smooth time series, while the original OLS TNDN time series showed discontinuities likely due to orbit and sensor degradation over time. A similar result was found by comparing DN time series according to the original annual OLS data with DN time series according to the annual-calibrated OLS data at pixel scale. An example was given in . This result provides evidence that the inter-annual-sensor calibration reduced the large stochastic and systematic impacts of sensor performance and orbit degradation.
Figure 5. Inter-annual-sensor calibration of annual OLS data on stable nighttime lights from 1992 to 2013 in the study area: TNDNs time series of the original OLS annual data for each satellite are shown in different colors, and TNDNs time series of the calibrated -OLS annual data are shown by black lines with circles.
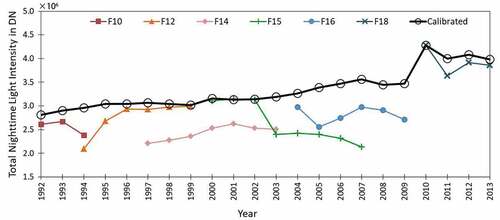
Figure 6. DN time series of pixel example in the original OLS annual data for each satellite are shown in different colors, and DN time series of pixel example in the calibrated -OLS annual data are shown by black lines with circles.
3.2. Generation of synthetic OLS data for the period 2013–2020
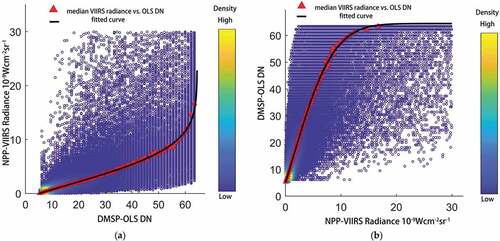
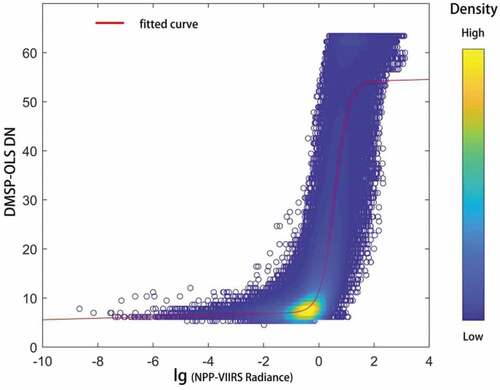
The first step is to establish a relationship to calibrate the 2013 OLS DN values against the 2013 VIIRS radiance data by applying the procedure described in Section 2.2.4.1. The scatter plot of the median VIIRS radiance vs. the DN values () shows that there is a well-defined relationship between the median VIIRS radiance and the OLS DN values. These data points were fitted with EquationEquation 3(3)
(3) , which gave R2 = 0.9992. The combination of EquationEquation 1
(1)
(1) , the coefficients in and the 2013 calibration (EquationEquation 3
(3)
(3) ) gave the OLS radiance data set for the period (1992–2013).
To generate the synthetic OLS radiance data (2013–2020) we need to estimate the OLS DN values corresponding to the VIIRS radiance, as explained in Section 2.2.4.3. This implies to invert EquationEquation 3(3)
(3) to get EquationEquation 4
(4)
(4) , i.e. the relationship plotted in . EquationEquation 4
(4)
(4) is applied to estimate the OLS DN value at NEδL, and
, the L value at saturation, i.e. DN = 63. Both –b) show very clearly the decreasing sensitivity of OLS at higher radiance (light intensity).
Figure 7. Relationship between 2013 OLS DN and 2103 VIIRS radiance: (a) Median calibration relationship between median VIIRS radiance and OLS DN values; (b) inverse function of Figure 7a; median radiance points (red) and best fit (black line) according to EquationEquation 3(3)
(3) (a, left) and EquationEquation4
(4)
(4) (b, right).
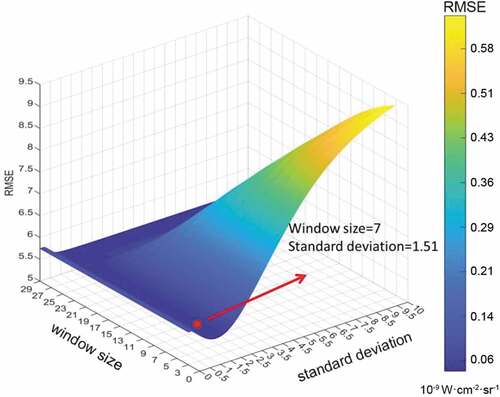
A GLF was applied to further reduce residual random noise in the synthetic OLS radiance data (see Section 2.2.4.2 for method). The pixels with value greater than zero in the actual OLS DN data and in the filtered synthetic OLS DN data in 2013 were regarded as the sample area for reducing the impact of the overpass time difference between OLS and VIIRS. The optimal window size w and standard deviation were estimated by minimizing the RMSE between the actual OLS DN data and the calculated GLF filtered synthetic OLS DN data in the sample area in 2013 (see Section 2.2.4.2 for details. The RMSE was calculated for window size ranging from 3 to 29 and standard deviation ranging from 0.1 to 10 with a step 0.01 (). We finally chose an optimal window size = 7 and standard deviation = 1.51, which gave a minimum RMSE = 5.3841 (DN) = 0.05 × 10⁻⁹ W∙cm−2∙sr−1.
Figure 8. RMSE between the 2013 actual OLS DN data and the 2013 GLF filtered synthetic OLS DN data; optimal window size of 7 × 7 pixels and optimal standard deviation = 1.51 estimated as the values applying to the minimum RMSE; the color bar denotes the RMSE in radiance units because the calibration EquationEquation 3(3)
(3) establishes a 1 to 1 relationship between DN and radiance values.
The filter performance was evaluated by comparing the RMSE and the correlation coefficient between the synthetic DN values in 2013 before and after applying the GLF method, respectively, with the 2013 actual OLS DN data. As shown in , after applying the GLF, the RMSE between the synthetic OLS DN data and the actual OLS DN data in the study region in 2013 decreased from 1.41 to 1.29, and the correlation coefficient increased from 0.84 to 0.86. This indicates that the Gaussian low-pass filtering can improve the similarity between the two types of data for further analysis.
Table 4. The root mean square error (RMSE) and the correlation coefficient between the synthetic OLS DN data and the actual OLS DN data in 2013 before and after applying the Gaussian Low-pass Filter (GLF).
3.3. Validation of the time series of calibrated OLS radiance data on nighttime lights
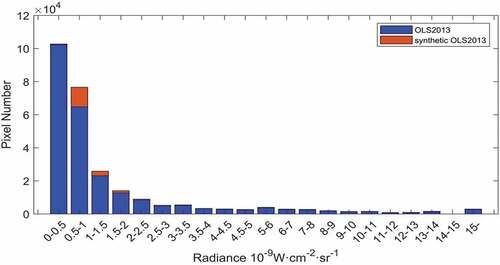
An informative evaluation is by comparing the frequency distribution of the OLS2013 and the synthetic-OLS2013 radiance data (). This result confirms that the brightness distribution in the two data sets is rather consistent.
Figure 9. Histograms of the OLS2013 (blue) and the synthetic-OLS2013 (red) radiance data.
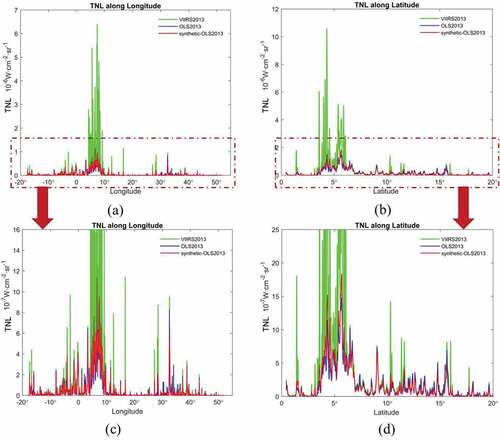
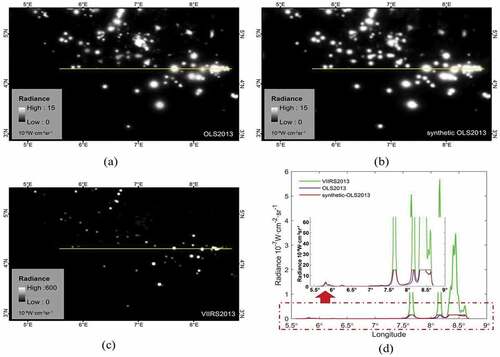
Given the uneven East-West and South-North distribution of inhabitants and urban areas in northern Equatorial Africa and Sahel, we compared the latitudinal and longitudinal distributions of the TNL-values calculated using our three data products (). The TNL values obtained with the OLS2013 and the synthetic-OLS2013 data are very similar at all longitudes or latitudes. The impact of the much wider dynamic range of VIIRS data is very clear: when observing bright targets, the actual radiance is much higher and can only be captured by VIIRS2013, i.e. the original VIIRS data. As explained in Section 2.2.4.3., the synthetic OLS radiance data were generated by reproducing the OLS data with saturation at DN = 63. That is to say, only radiances up to the VIIRS radiance L at DN = 63 are considered during the generation of the 6-bit synthetic DMSP-OLS data. This is essential to guarantee the consistency of 2013–2020 with the (1992–2013) OLS data.
Figure 10. TNLs in 2013 vs. (a) Longitude and (b) Latitude in northern Equatorial Africa and Sahel; OLS2013 (blue line), synthetic-OLS2013 (red line) and VIIRS2013 (green line). (c) and (d) show the low-radiance detail of (a) and (b), respectively.
To further refine our evaluation, we extracted three pixel-by-pixel transects (at pixel scale) of nighttime light images of Accra, Dakar, and the southern coast of Nigeria (). The results were similar to the profiles in ; the urban areas of Accra and Dakar are lower light intensity targets, while the sampled area in the southern coast of Nigeria is characterized by gas flares with much higher light intensity, which can only be captured by VIIRS. Overall at a lower intensity, the calibrated OLS data provide acceptable radiometric measurements of the observed targets. In other words, the method proposed in this paper also works well not only when analyzed for large areas but also at the pixel level.
Figure 11. Local profile of the 2013 nighttime light intensity of a sample image segment in Accra, Ghana: (a) synthetic-OLS2013; (b) OLS2013; and (c) VIIRS2013; (d) nighttime light radiances along the transect-pixels in the three images (a, b and c), respectively. The transect is delineated by the yellow box.
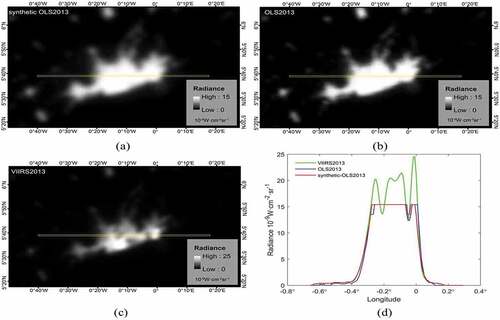
Figure 12. Local profile of the 2013 nighttime light intensity of a sample image segment in Dakar, Senegal: (a) synthetic-OLS2013; (b) OLS2013; and (c) VIIRS2013; (d) nighttime light radiances along the transect-pixels in the three images (a, b and c), respectively. The transect is delineated by the yellow box.
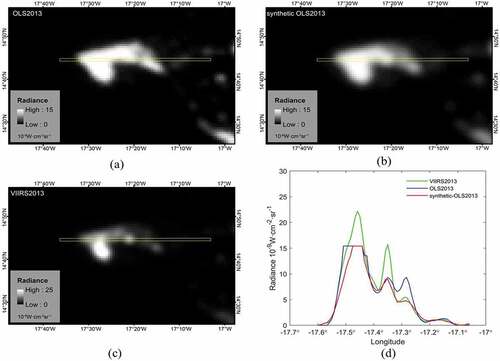
Figure 13. Local profile of the 2013 nighttime light intensity of a sample image segment in the southern coast of Nigeria: (a) synthetic-OLS2013; (b) OLS2013; and (c) VIIRS2013; (d) nighttime light radiances along the transect-pixels in the three images (a, b and c), respectively. The transect is delineated by the yellow box.
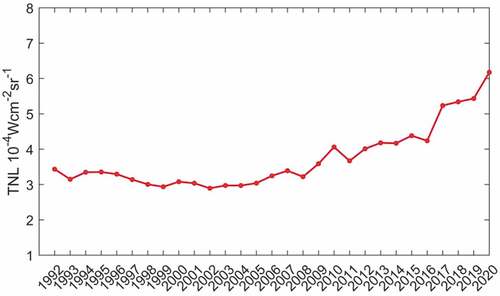
We evaluated our main data product, i.e. the calibrated OLS radiance data on nighttime lights (1992–2020), by calculating the yearly total nighttime light radiance (i.e. TNL). The temporal consistency of this time series is indicated by the absence of discontinuities and the gradual increase over time (), indicating the effectivity of the work-flow applied to generate our main data product.
Figure 14. Total radiance of nighttime lights in northern Equatorial Africa and Sahel based on the harmonized time series of OLS radiance data on nighttime lights between 1992–2020.
4. Discussion
4.1. Median calibration relationship
In this study, we successfully extended the temporal coverage of the radiance data on stable nighttime light sources, by generating synthetic OLS radiance data for the period 2013–2020 in northern Equatorial Africa and Sahel. The main data product is annual calibrated OLS radiance data on stable nighttime lights from 1992 to 2020. This data set can be used to analyze spatial and temporal changes in Northern Equatorial Africa. The data set meets the radiometric specification of OLS, i.e. 6-bit quantization, dynamic range, and spatial response. The calibration against the VIIRS data provided an estimate of the radiance where OLS saturates at DN = 63. The comparison of our OLS against VIIRS radiance data showed that bright targets, such as gas flares, can only be observed by VIIRS, since OLS saturates at any radiance L >
. The median calibration method has been established combining the annual OLS and the VIIRS data on stable nighttime lights in 2013 when the two data records overlap. Ideally, pairs of concurrent OLS and VIIRS observations should have been applied to establish this calibration, but we had to deal with two limitations. First, only annual OLS data were available publically. Second, the overpass time of DMSP and NPP are rather different: DMSP roughly in early evening (roughly around 19:30) and NPP around 1:30 local solar time (LST) (Elvidge et al., Citation2013). Moreover, generally speaking, the nighttime light intensity of settlements peaks before 10 p.m. LST (Elvidge et al., Citation2013). After that time, outdoor lights are greatly reduced. This is evident in Africa, especially in northern Equatorial Africa and Sahel (Anuforo, Citation2018; Mawhood, Citation2012; Min, Gaba, Sarr, & Agalassou, Citation2013). Although VIIRS still successfully collected nighttime light information in the midnight, it misses many nocturnal light signals during the peak period in the evening. This is confirmed by our data analysis: the nighttime light intensity measured by VIIRS was weaker than OLS measurements of some urban targets.
4.2. Inter-annual-sensor calibration
In fact, the orbit of the DMSP satellites is not stable, i.e. the overpass time is varying as the orbit decays. Since 2010, OLS observed the earth much earlier, resulting in a solar light impact on the DMSP-OLS nighttime light data collected by the OLS on the F18 satellite. This may explain to a large extent the observed increase in TNDN values, i.e. most likely due to the earlier acquisition rather than the change in the intensity of light sources (see ), as confirmed by former studies (Gibson, Olivia, & Boe-Gibson, Citation2020; Tuttle, Anderson, Sutton, Elvidge, Baugh, Citation2013). In principle, such discontinuities should have been corrected by our inter-calibration of the data acquired by different satellites and OLS sensors over time, in combination with the 2013 calibration of OLS against VIIRS data. The data plotted in show that this has been partly accomplished, since a discontinuity is still observable, although corrected in the final data product (). It should also be noted that the steady increasing trend in TNDN values started in 2004 already, thus suggesting it might be a reliable indication of economic growth in the region. This trend could be explained by the impressive expansion of settlements between 1975 and 2013 in this region documented by Barnieh at al. (Citation2020) (Barnieh et al., Citation2020).
Recently, NOAA discovered F15 and F16 DMSP-OLS satellite orbit had started and continued to collect nighttime light data at around 4:30 (LST) instead of 19:30 (LST). Based on this information, EOG released an extension annual F15 – 16 DMSP nighttime lights (DN) data from 2014 to 2019. Even so, the harmonized time series of DMSP-OLS nighttime light radiance data (1992–2020) generated in this study is still of great significance. Due to the huge difference in overpass time (9 hours) between the extension F15 – 16 DMSP-OLS DN data and the original global DMSP-OLS nighttime lights time series, it is difficult to think that the nighttime light information recorded by the extension DMSP-OLS series and the original DMSP-OLS time series is synchronous or consistent. In addition, we generated radiance time series data instead of DN data from 1992 to 2020 in this study by proposing the Median model. This is very important for understanding the real physical information of nocturnal surface features.
In this study, we proposed the inter-annual-sensor calibration for DMSP-OLS data in northern Equatorial Africa and Sahel based on Elvidge’s classic inter-calibration method. The concept of inter-calibration appeared as early as the 1990s. This method assumes that a relationship between two images of night-time lights in a time series can be established if there are stable lights in the observed scene (Cao, Wu, Kuang, & Huang, Citation2015; Hall, Strebel, & Nickeson, 1991; Lenney, Woodcock, Collins, & Hamdi, Citation1996). Elvidge applied this idea to calibrate DMSP-OLS nighttime light data, and this method has been widely used. The inter-annual-sensor calibration method is flexible and can be implemented easily with robust performance. We calibrated the DMSP-OLS nighttime light data by selecting reference pixels and establishing the relationship between the reference image and images to be calibrated. In this study area, TNDN (see ) and DN (see ) for uncalibrated DMSP-OLS images showed significant oscillation, while no obvious change with time. That is to say, sensor attenuation did not cause a significant trend change (such as decrease or increase) in TNDN and DN over time. Other methods for calibrating DMSP-OLS data are mostly developed by building upon Elvidge’s method by changing the reference area or relationship model according to different study areas (Bian et al., Citation2019; Cao et al., Citation2015; Elvidge et al., Citation2014; Li et al., Citation2016; Liu et al., Citation2012; Ma, Zhou, Pei, Haynie, & Fan, Citation2012; Pandeya et al., Citation2013; Wu et al., Citation2013). Li and Zhou (Citation2017) proposed a stepwise calibration approach to generate a temporally consistent global DMSP-OLS time series by assuming that the trend in the sum of nighttime lights captured by the DMSP-OLS imagers onboard the satellites F10 and F12 were reliable since two conditions were met (a) the same increasing trend was captured by both satellites and (b) the total of nighttime light DNs for F101994 and F121994 were almost the same (Li & Zhou, Citation2017). However, as can be seen from , this assumption is not valid in northern Equatorial Africa and Sahel, because neither of the two conditions is met. Moreover, a priori the observed trend is a combination of two effects, i.e. a) sensor and orbit degradation (which needs to be corrected) and b) actual increase in nighttime lights. Therefore, we proposed and applied the inter-annual-sensor calibration method (see section 2.2.3) to DMSP-OLS data in northern Equatorial Africa and Sahel in this study.
4.3. Comparison with existing method
This study proposed a new method – the median calibration model, to calibrate OLS DN values to radiance and extended the temporal range of OLS data on stable nighttime light sources from 1992–2013 to 1992–2020 in the northern Equatorial Africa and Sahel. As reviewed in the Introduction section, this issue has been addressed in some previous work (Dong et al., Citation2019; Li et al., Citation2017; Liu et al., Citation2020; Lv et al., Citation2020; Shao et al., Citation2014; Wu & Wang, Citation2019; Yue et al., Citation2020; Zhao et al., Citation2019; Zhu et al., Citation2017), but methods proposed in these earlier works have limitations. Recently, some scholars applied Logistic Sigmoid model to establish the relationship between OLS DN and VIIRS radiance (Li et al., Citation2020; Ma et al., Citation2020; Zhao et al., Citation2020). Ma et al. (Citation2020) successfully applied an improved Sigmoid model, i.e. BiDoseResp model (EquationEquation 8(8)
(8) ), in China (Ma et al., Citation2020). The BiDoseResp model was described as below,
where denotes the logarithm of the VIIRS radiance;
is the calculated OLS DN based on
;,
,
,
,
,
, and
are the parameters of EquationEquation 8
(8)
(8) .
We applied the BiDoseResp model in northern Equatorial Africa and the Sahel and compared with our model results. Although the coefficient of determination for BiDoseResp model was good (R2 = 0.82), the upper limit DN of the fitting curve (DN≈55) failed to reach the saturation DN value (i.e. DN = 63), as shown in .
Figure 15. Relationship between 2013 OLS DN and the logarithm of 2103 VIIRS radiance and fitted curve (red line) according to Ma’s method in northern Equatorial Africa and the Sahel.
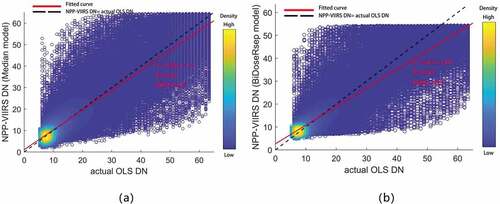
In order to compare our Median calibration method and the BiDoseRsep method proposed by Ma et al. (Ma et al., Citation2020), we calculated the RMSE and the correlation coefficients between the actual OLS data and the synthetic OLS data generated by the two methods, respectively. We found that the RMSE from BiDoseRsep method is 2.53, much larger than that from our method in this study (RMSE = 1.29). The correlation coefficient from the synthetic OLS data by the Median method is 0.86, much higher than that from the BiDoseRsep method (0.62). We also plotted, respectively, the synthetic NPP-VIIRS DN in 2013 generated by our median calibration model and the BiDoseRsep model against the actual DMSP-OLS DN in . In , the red lines refer to the fitted linear lines by either method; the black dotted lines indicate the 1:1 line. The closer the fitted linear line is to the 1:1 line (i.e. the slope is closer to 1 and the interception is closer to 0), the better the calibration result is. The results in show that the slope (intercept) of the fitted linear regression between the results from the Median calibration method, i.e. slope = 0.92 (intercept = 1.12) is closer to 1 (closer to 0) than that from the BiDoseRsep method (slope = 0.81, intercept = 2.66), indicating that our method is more effective than the BiDoseRsep method proposed by Ma et al. (Ma et al., Citation2020) in the study area. Compared with our method, the BiDoseResp model by Ma et al. was susceptible to outlier and study area. Our approach presented in this study, overcomes the disadvantages of existing methods, and efficiently makes the OLS data record consistent with current (i.e. VIIRS) and probably also future data acquired by other imaging radiometers. There are no constraints to applying this method elsewhere, except the need for existence of stable light sources to establish the calibration, so it would be easily applicable to DMSP-OLS data or other uncalibrated data on nighttime lights in other regions.
Figure 16. (a): actual OLS DN vs. NPP-VIIRS DN (generated by Median model) in 2013. (b): actual OLS DN vs. NPP-VIIRS DN(generated by BiDoseRsep model)in 2013. The black dotted lines indicate the 1:1 line (i.e. actual OLS DN = NPP-VIIRS DN). The red lines refer to the fitted linear model.
4.4. Applicability
The motivation of our work was to get consistent radiance data across the entire range of observed target types and light intensities observable by OLS. We are fully aware that Africa is rapidly developing, but that it implies that very different light sources are observed, from sprawling and glittering cities to very small and dispersed rural settlements. The successful intercalibration of the OLS sensors flown from 1992 to 2020 and of OLS with VIIRS for both faint and bright nighttime light sources is by itself a guarantee of the wide applicability of our calibration method and of the data set generated with it. There is no area-specific element in our method, except the existence of relatively stable lights for the calibration of OLS against VIIRS data. This constraint could be removed if concurrent, instantaneous measurements by OLS and VIIRS were available. The data products freely available, however, involve some degree of temporal compositing, which makes it impossible to gather truly concurrent measurements by the two sensors. The stability of light sources mitigates the impact of differences in the time of acquisition between the OLS and VIIRS data used to establish the radiometric calibration of OLS. On the other hand, the widespread use of power generators in Africa leads to unstable lights, especially faint ones, which further adds to the robustness of our method. The evaluation of the calibrated OLS data against an independent VIIRS data set shows that the calibration is rather accurate over the entire range of light sources observable by OLS. The limited dynamic range of OLS is the main limitation when using OLS: the maximum observable radiance is 15.4 10−9 W∙cm−2∙sr−1, which to OLS DN = 63 (saturation) and in practice applies to bright urban targets and gas – flares. Brighter targets cannot simply be observed by OLS, i.e. it is not a limitation of our calibration method or of our data set. As far as light intensity are observable by OLS, our calibration method and an OLS data set generated with it are applicable to any part of the world.
5. Conclusions
In this study, we developed the median calibration model and generating the annual calibrated DMSP-OLS radiance data on stable nighttime lights from 1992 to 2020 as the main data product. The evaluation showed that our method can effectively extend the temporal coverage of OLS data. Further details on the outcome of this study are added below.
We established a median calibration relationship between the OLS DN and the VIIRS radiance data on stable nighttime lights. The calibration was established by fitting the VIIRS median radiance for each OLS DN bin to the corresponding OLS DN value.
We extended the DMSP-OLS temporal coverage by generating synthetic OLS radiance data for the period 2013–2020 to complement the calibrated OLS data on stable nighttime lights for the period 1992–2013.
The calibrated synthetic OLS radiance data (2013–2020) meet the radiometric specifications of the actual OLS data (1992–2013), i.e. 6-bit quantization and dynamic range.
The results proved that this method was effective: the OLS radiance data (OLS2013) and the synthetic OLS radiance data (synthetic-OLS2013) have high spatial and radiometric similarity. The time series of calibrated OLS radiance data on nighttime lights does not show discontinuities, i.e. the variability of sensor performance over time seems to have been corrected.
The approach proposed in this study, currently applied up to 2020 in northern Equatorial Africa, could easily be extended to longer time series on nighttime lights beyond 2020 and would be easily applicable to other regions and even globally.
Acknowledgments
We are immensely grateful to Prof. Christopher D. Elvidge for kindly answering our questions about the processing of DMSP-OLS data and NPP-VIIRS data. Finally, we would like to give our sincere gratitude to our colleagues Jie Zhou, Jing Lu, Chaolei Zheng, Guangcheng Hu, Qiting Chen, Beatrice Barnieh, Ali Benour, Yelong Zeng and Yunzhe Lv for discussions during the course of this work.
Disclosure statement
No potential conflict of interest was reported by the author(s).
Data Availability Statement
The nighttime light data that support the findings of this study are available from the Earth Observation Group from Colorado School of Mines at https://eogdata.mines.edu/dmsp/downloadV4composites.html and https://eogdata.mines.edu/download_dnb_composites.html.
Additional information
Funding
Notes on contributors

Xiaotian Yuan
Xiaotian Yuan received the Master degree in Cartography and Geographic Information System from Beijing Normal University, China, in 2015. She is currently pursuing the Ph.D. degree with The Aerospace Information Research Institute, Chinese Academy of Sciences, Beijing, China. Her research interests include the nighttime light observation and its applications in assessing human activities change.

Li Jia
Li Jia received the B.S. degree in dynamic meteorology from the Beijing College of Meteorology, Beijing, China, the M.Sc. degree in atmospheric physics from Chinese Academy of Sciences in China, and the Ph.D. degree in environmental science from Wageningen University, Wageningen, The Netherlands. She is a Professor with the State Key Laboratory of Remote Sensing Science, the Aerospace Information Research Institute, Chinese Academy of Sciences. Her research interests include the earth observation and its applications in hydrometeorology, water resource, agriculture, and global change.

Massimo Menenti
Massimo Menenti received the Ph.D. degree in environmental sciences from the University of Wageningen, Wageningen, The Netherlands, in 1984. He is currently a foreign expert with the Aerospace Information Research Institute, Chinese Academy of Science, Beijing, China. His research interests include earth observations and the global terrestrial water cycle, including the retrieval of land surface parameters from remote sensing, land surface processes (specifically on heat and water exchanges between the land and atmosphere), time-series analysis of satellite remote sensing observations, and the application of remote sensing in hydrology, agriculture, water resources, crop yields, and climate models.

Min Jiang
Min Jiang received the Ph.D. degree in environmental sciences from the University of Chinese Academy of Sciences, Beijing, China, in 2019. He is an assistant researcher with the Aerospace Information Research Institute, Chinese Academy of Sciences, Beijing, China. His research interests include vegetation change and drought monitoring, land use and cover change and its environmental effects.
References
- Abrahamsa, A., Oramc, C., & Lozano-Gracia, N. (2018). Deblurring DMSP nighttime lights: A new method using Gaussian filters and frequencies of illumination. Remote Sensing of Environment, 210(1), 242–258. doi:10.1016/j.rse.2018.03.018
- Anuforo, E. (2018). African development bank to reach 29.3 Million Africans with electricity by 2020. Available online: https://www.afdb.org/en/news-and-events/african-development-bank-to-reach-29-3-million-africans-with-electricity-by-2020-17806 (accessed on 22 May 2018).
- Barnieh, B. A., Jia, L., Menenti, M., Zhou, J., & Zeng, Y. (2020). Mapping land use land cover transitions at different spatiotemporal scales in West Africa. Sustainability, 12(20), 8565. doi:10.3390/su12208565
- Baugh, K., Elvidge, C. D., Ghosh, T., & Ziskin, D. (2010). Development of a 2009 stable lights product using DMSPOLS data. Proceedings of the Asia-Pacific Advanced Network, 30(1), 114–130. doi:10.7125/APAN.30.17
- Bian, J., Li, A., Lei, G., Zhang, Z., Nan, X., & Liang, L. (2019). Inter-calibration of nighttime light data between DMSP/OLS and NPP/VIIRS in the economic corridors of belt and road initiative. IGARSS 2019 — 2019 IEEE International Geoscience and Remote Sensing Symposium, Yokohama, 9028–9031.
- Cao, Z., Wu, Z., Kuang, Y., & Huang, N. (2015). Correction of DMSP/OLS night-time light images and its application in China. Journal of Geo-Information Science, 17(9), 1092–1102.
- Chen, T. H. K., Prishchepov, A. V., Fensholt, R., & Sabel, C. E. (2020). Detecting and monitoring long-term landslides in urbanized areas with nighttime light data and multi-seasonal Landsat imagery across Taiwan from 1998 to 2017. Remote Sensing of Environment, 225, 317–327. doi:10.1016/j.rse.2019.03.013
- Dawelbait, M., & Morari, F. (2012). Monitoring desertification in a Savannah region in Sudan using Landsat images and spectral mixture analysis. Journal of Arid Environments, 80, 45–55. doi:10.1016/j.jaridenv.2011.12.011
- Doll, C. N. H., & Pachauri, S. (2010). Estimating rural populations without access to electricity in developing countries through night-time light satellite imagery. Energy Policy, 38(10), 5661–5670. doi:10.1016/j.enpol.2010.05.014
- Dong, H., Li, R., Li, J., & Li, S. (2019). Study on urban spatiotemporal expansion pattern of three first-class urban agglomerations in China derived from integrated DMSP-OLS and NPP-VIIRS nighttime light data. Journal of Geo-information Sci-ence, 22(5), 1161–1174.
- Elvidge, C. D., Baugh, K. E., Kihn, E. A., Kroehl, H. W., & Davis, E. R. (1997). Mapping city lights with nighttime data from the DMSP operational linescan system. Photogrammetric Engineering and Remote Sensing, 63(6), 727–734.
- Elvidge, C. D., Baugh, K., Zhizhin, M., & Hsu, F. C. (2013). Why VIIRS data are superior to DMSP for mapping nighttime lights. Proceedings of the Asia Pacific Advanced Network, 35(1), 62–69. doi:10.7125/APAN.35.7
- Elvidge, C. D., Daniel, Z., Baugh, K. E., Tuttle, B. T., Mikhail, Z., Pack, D. W., Erwin, E. H., & Zhizhin, M. (2009). A Fifteen Year Record of Global Natural Gas Flaring Derived from Satellite Data. Energies, 2(3), 595–622. doi:10.3390/en20300595
- Elvidge, C. D., Hsu, F. C., Baugh, K. E. , & Ghosh, T. (2014). National trends in satellite observed lighting: 1992 – 2009. In Q. Weng (Ed.), Global urban monitoring and assessment through earth observation (pp. 97–119). Boca Raton: CRC Press. doi:10.1201/b17012-9.
- Frolking, S., Milliman, T., Seto, K. C., & Friedl, M. A. (2013). A global fingerprint of macro-scale changes in urban structure from 1999 to 2009. Environmental Research Letters, 8(2), 1–10. doi:10.1088/1748-9326/8/2/024004
- Ghosh, T., Anderson, S. J., Elvidge, C. D., & Sutton, P. C. (2013). Using nighttime satellite imagery as a proxy measure of human well-being. Sustainability, 5(12), 4988–5019. doi:10.3390/su5124988
- Gibson, J., Olivia, S., & Boe-Gibson, G. (2020). Night lights in economics: Sources and uses. Journal of Economic Surveys, 34(5), 955–980. doi:10.1111/joes.12387
- Gompertz, B. (1825). On the nature of the function expressive of the law of human mortality and on a new mode of determining life contingencies. Philosophical Transactions of the Royal Society of London, (1825(115), 513–585.
- Hall, F. G., Strebel, D. E., Nickeson, J. E., & Goetz, S. J. (1991). Radiometric rectification-toward a common radiometric response among multidate, multisensor images. Remote Sensing of Environment, 35(1), 11–27. doi:10.1016/0034-4257(91)90062-B
- He, Y., Yao, Y., Tang, H., Chen, Y., Chen, Z., Peng, Y., & Yu, S. (2013). An overview on progress of land use and land cover change dynamics. Chinese Agriculture Science Bulletin, 29(2), 190–195.
- Jiang, W., He, G., Long, T., & Liu, H. (2017). Ongoing conflict makes Yemen dark: From the perspective of nighttime light. Remote Sensing, 9(8), 798. doi:10.3390/rs9080798
- Lenney, M. P., Woodcock, C. E., Collins, J. B., & Hamdi, H. (1996). The status of agricultural lands in Egypt: The use of multitemporal NDVI features derived from Landsat TM. Remote Sensing of Environment, 56(1), 8–20. doi:10.1016/0034-4257(95)00152-2
- Li, X., Li, D., Xu, H., & Wu, C. (2017). Intercalibration between DMSP/OLS and VIIRS night-time light images to evaluate city light dynamics of Syria’s major human settlement during Syrian Civil War. International Journal of Remote Sensing, 38(21), 5934–5951. doi:10.1080/01431161.2017.1331476
- Li, Q., Lu, L., Weng, Q., Xie, Y., & Guo, H. (2016). Monitoring urban dynamics in the southeast U.S.A. Using time-series DMSP/OLS nightlight imagery. Remote Sensing, 8(7), 578. doi:10.3390/rs8070578
- Li, D., Zhao, X., & Li, X. (2016). Remote sensing of human beings – A perspective from nighttime light. Geo-Spatial Information Science, 19(1), 69–79. doi:10.1080/10095020.2016.1159389
- Li, X., & Zhou, Y. (2017). A stepwise calibration of global DMSP/OLS stable nighttime light data (1992–2013). Remote Sensing, 9(6), 673.
- Li, X., Zhou, Y., Zhao, M., & Zhao, X. (2020). A harmonized global nighttime light dataset 1992–2018. Scientific Data, 7(1), 168. doi:10.1038/s41597-020-0510-y
- Liao, L. B., Weiss, S., Mills, S., & Hauss, B. (2013). Suomi NPP VIIRS day-night band on-orbit performance. Journal of Geophysical Research Atmospheres, 118(22), 12705–12718. doi:10.1002/2013JD020475
- Liu, Z., He, C., Zhang, Q., Huang, Q., & Yang, Y. (2012). Extracting the dynamics of urban expansion in China using DMSP-OLS nighttime light data from 1992 to 2008. Landscape and Urban Planning, 106(1), 62–72. doi:10.1016/j.landurbplan.2012.02.013
- Liu, P., Wang, Q., Zhang, D., & Lu, Y. (2020). An improved correction method of nighttime light data based on EVI and worldpop data. Remote Sensing, 12(23), 3988. doi:10.3390/rs12233988
- Lv, Q., Liu, H., Wang, J., Liu, H., & Shang, Y. (2020). Multiscale analysis on spatiotemporal dynamics of energy consumption CO2 emissions in China: Utilizing the integrated of DMSP-OLS and NPP- VIIRS nighttime light datasets. Science of the Total Environment, 703, 134394. doi:10.1016/j.scitotenv.2019.134394
- Ma, J., Guo, J., Ahmad, S., Li, Z., & Hong, J. (2020). Constructing a new inter-calibration method for DMSP-OLS and NPP-VIIRS nighttime light. Remote Sensing, 12(6), 937. doi:10.3390/rs12060937
- Ma, T., Zhou, C., Pei, T., Haynie, S., & Fan, J. (2012). Quantitative estimation of urbanization dynamics using time series of DMSP/OLS nighttime light data: A comparative case study from China’ s cities. Remote Sensing of Environment, 124, 99–107. doi:10.1016/j.rse.2012.04.018
- Mariano, D. A., Dos Santos, C. A. C., Wardlow, B. D., Anderson, M. C., Schiltmeyer, A. V., Tadesse, T., & Svoboda, M. D. (2018). Use of remote sensing indicators to assess effects of drought and human-induced land degradation on ecosystem health in Northeastern Brazil. Remote Sensing of Environment, 213, 129–143. doi:10.1016/j.rse.2018.04.048
- Mawhood, R. (2012). The Senegalese rural electrification action plan: ‘A good practice’ model for increasing private sector participation in sub-saharan rural electrification. Master’s Thesis, Imperial College London, London.
- Min, B., Gaba, K. M., Sarr, O. F., & Agalassou, A. (2013). Detection of rural electrification in Africa using DMSP-OLS night lights imagery. International Journal of Remote Sensing, 34(22), 8118–8141. doi:10.1080/01431161.2013.833358
- Mortimore, M. (2016). Changing paradigms for people-centred development in the Sahel. In: Behnke, R., & Mortimore, M. (eds). The end of desertification? (pp. 65-98). Berlin: Springer. doi:10.1007/978-3-642-16014-1_3
- Pandeya, B., Joshia, P. K., & Seto, K. C. (2013). Monitoring urbanization dynamics in India using DMSP/OLS night time lights and SPOT-VGT data. International Journal of Applied Earth Observations and Geoinformation, 23, 49–61. doi:10.1016/j.jag.2012.11.005
- Park, J. Y., Bader, J., & Matei, D. (2016). Anthropogenic Mediterranean warming essential driver for present and future Sahel rainfall. Nature Climate Change, 6(10), 941–945. doi:10.1038/nclimate3065
- Shao, X., Cao, C., Zhang, B., Qiu, S., Elvidge, C., & Von Hendy, M. (2014). Radiometric calibration of DMSP-OLS sensor using VIIRS day/night band. Proceedings of SPIE the International Society for Optical Engineering, 9264(92640A), 1 – 8.
- Small, C., Pozzi, F., & Elvidge, C. D. (2005). Spatial analysis of global urban extent from DMSP-OLS night lights. Remote Sensing of Environment, 96(3–4), 277–291. doi:10.1016/j.rse.2005.02.002
- Sun, G., Li, F., Wei, A., & Mi, X. (2016). An approach of GDP Spatialization in Hebei Province using NPP-VIIRS nighttime light data. Journal of Xinyang Normal University, 29, 152–156.
- Tuttle, B. T., Anderson, S. J., Sutton, P. C., Elvidge, C. D., & Baugh, K. (2013). It used to be dark here: Geolocation calibration of the Defense Meteorological Satellite Program Operational Linescan System. Photogrammetric Engineering and Remote Sensing, 79(3), 287–297. doi:10.14358/PERS.79.3.287
- Wu, J., He, S., Peng, J., Li, W., & Zhong, X. (2013). Intercalibration of DMSP-OLS night-time light data by the invariant region method. International Journal of Remote Sensing, 34(20), 7356–7368. doi:10.1080/01431161.2013.820365
- Wu, K., & Wang, X. (2019). Aligning pixel values of DMSP and VIIRS nighttime light images to evaluate urban dynamics. Remote Sensing, 11(12), 1463. doi:10.3390/rs11121463
- Xu, T., Ma, T., Zhou, C., & Zhou, Y. (2014). Characterizing spatio-temporal dynamics of urbanization in China using time series of DMSP/OLS night light data. Remote Sensing, 6(8), 7708–7731. doi:10.3390/rs6087708
- Yuan, X., Jia, L., Menenti, M., Zhou, J., & Chen, Q. (2019). Filtering the NPP-VIIRS Nighttime Light Data for Improved Detection of Settlements in Africa. Remote Sensing, 11(24), 3002. doi:10.3390/rs11243002
- Yue, Y., Tian, L., Yue, Q., & Wang, Z. (2020). Spatiotemporal variations in energy consumption and their influencing factors in China based on the integration of the DMSP-OLS and NPP-VIIRS nighttime light datasets. Remote Sensing, 12(7), 1151. doi:10.3390/rs12071151
- Zhao, J., Ji, G., Yue, Y., Lai, Z., Chen, Y., Yang, D., … Wang, Z. (2019). Spatio-temporal dynamics of urban residential CO2 emissions and their driving forces in China using the integrated two nighttime light datasets. Applied Energy, 235(1), 612–624. doi:10.1016/j.apenergy.2018.09.180
- Zhao, M., Zhou, Y., Li, X., Zhou, C., Cheng, W., Li, M., & Huang, K. (2020). Building a series of consistent night-time light data (1992–2018) in Southeast Asia by integrating DMSP-OLS and NPP-VIIRS. IEEE Transactions on Geoscience and Remote Sensing, 58(3), 1843–1856. doi:10.1109/TGRS.2019.2949797
- Zheng, Q., Weng, Q., & Wang, K. (2019). Developing a new cross-sensor calibration model for DMSP-OLS and Suomi-NPP VIIRS night-light imageries. ISPRS Journal of Photogrammetry and Remote Sensing, 153, 36–47. doi:10.1016/j.isprsjprs.2019.04.019
- Zhu, X., Ma, M., Yang, H., & Ge, W. (2017). Modeling the spatiotemporal dynamics of gross domestic product in China using extended temporal coverage nighttime light data. Remote Sensing, 9(6), 626. doi:10.3390/rs9060626