
ABSTRACT
The region-wide spatial pattern of the drivers of vegetation trends in the African Sahel-Sudano-Guinean region, one of the main drylands of the world, has not been fully investigated. Time-series satellite earth observation datasets were used to investigate spatiotemporal patterns of the vegetation greenness changes in the region and then a principal component regression method was applied to identify the region-wide spatial pattern of driving factors. Results find that vegetation greening is widespread in the region, while vegetation browning is more clustered in central West Africa. The dominant drivers of vegetation greenness have a distinct spatial pattern. Climatic factors are the primary drivers, but the impacts of precipitation decrease from north to south, while the impacts of temperature are contrariwise. Coupled with climatic drivers, land cover changes lead to greening trends in the arid zone, especially in the western Sahelian belt. However, the cluster of browning trends in central West Africa can primarily be attributed to the human-induced land cover changes, including an increasing fractional abundance of agriculture. The results highlight the spatial pattern of climatic and anthropic factors driving vegetation greenness changes, which helps natural resources sustainable use and mitigation of climate change and human activities in global dryland ecosystems.
1. Introduction
The Sahel-Sudano-Guinean region is a typical transition zone between the arid northern and the humid southern eco-regions of Africa (Fensholt et al., Citation2017). It is one of the largest drylands in the world and is highly vulnerable to climate change and anthropogenic activities (Kaptué et al., Citation2015). In the 1970s and early 1980s, the prolonged “Sahel drought” hit the region and resulted in land degradation as a major threat to regional livelihoods, which led to widespread public attention (Charney, Citation1975; Nicholson et al., Citation1998; Toulmin & Brock, Citation2016). With the increasing rainfall since the middle of the 1980s, in-situ and remote sensing observations started to show that the vegetation in the region is recovering, a process known in the literature as re-greening (Nicholson et al., Citation1998; Prince et al., Citation1998). With the boom of remote sensing technology in recent years, lots of studies at global and local scales using time series of satellite earth observation data have also demonstrated the vegetation re-greening in this region (Eklundh & Olsson, Citation2003; Fensholt et al., Citation2017; Kaptué et al., Citation2015). In the context of greening earth, however, decreased vegetation greenness, known as browning, has also been observed in some areas of the Sahel-Sudano-Guinean region (Chen et al., Citation2019; Ogutu et al., Citation2021). Moreover, previous studies argue that the trend in vegetation greenness in the region varies in different periods, for instance, the rate of greening in recent 15 years (2000–2015) is slower than that in the period from 1982 to 2000 (Ogutu et al., Citation2021), which suggests that continuous regional monitoring of this region is required. In addition, due to the negative effects of the insufficient sensor cross-calibration, sensor degradation, atmospheric contamination of satellite sensor signals and various temporal and spatial resolutions (Tian et al., Citation2015), vegetation greenness trends estimated using different satellite data are not always consistent (Chen et al., Citation2019; Piao et al., Citation2019). Thus, it is imperative to make a further investigation on the vegetation greenness changes in the region based on the nearest and latest time series of satellite data.
Understanding the driving factors of the dynamics of vegetation greenness is an essential process in understanding current situations and projecting future changes (Lamchin et al., Citation2020), which is useful information for environment protection and sustainable use of natural resources in the region. Previous studies at global and local scales have revealed that precipitation (Fensholt et al., Citation2012), temperature (Xu et al., Citation2013), CO2 fertilization (Zhu et al., Citation2016) are the main drivers of vegetation dynamics. At the same time, human-managed land use, including afforestation and agriculture, is the principal anthropogenic driving factor (Chen et al., Citation2019). Moreover, the dominant driver of vegetation greenness varies from region to region (Piao et al., Citation2019). For instance, CO2 fertilization is a major factor driving vegetation greening at the global scale (Zhu et al., Citation2016), while warming is the key driving factor of increasing vegetation greenness at the high latitudes (Mishra & Mainali, Citation2017), and intensive agriculture is leading to the increasing greening in China and India (Chen et al., Citation2019).
Specific to the Sahel-Sudano-Guinean region, the re-greening has been attributed to several factors including wetter climatic conditions (Brandt et al., Citation2015, Citation2016; Kaptué et al., Citation2015), CO2 fertilization due to increased CO2 in the atmosphere (Lu et al., Citation2016; Zhu et al., Citation2016), and increase in woody vegetation (Anchang et al., Citation2019; Brandt et al., Citation2015, Citation2016). Vegetation evolution is water-limited in this region, thus precipitation is the key driving factor of vegetation changes, and precipitation at different time scales has different impacts on vegetation dynamics (Zhou et al., Citation2021). The current year and previous year precipitation may both have impacts on vegetation greenness because precipitation accumulated in the soil at different depths and with different durations leads to a multi-scale soil “memory effect”. Land use and cover change, grazing, agriculture, and deforestation, reflecting anthropogenic impacts, also play an important role in vegetation greenness changes in the Sahel-Sudano-Guinean region (Brandt et al., Citation2017b). To date, however, a region-wide study is still needed on the spatial patterns of the drivers of vegetation changes. Most of the previous studies either focused on vegetation greenness change and its drivers at a global scale (Chen et al., Citation2019; Zhu et al., Citation2016), with little or no specific focus on the Sahel-Sudano-Guinean region, or on the contrary on drivers of green change in a particular hotspot such as the Sahel region (Brandt et al., Citation2017a; Kaptué et al., Citation2015; Leroux et al., Citation2017), failing to reflect how climate and human interactions affect vegetation changes in the entire Sahel-Sudano-Guinean region.
In fact, the Sahel-Sudano-Guinean region is an excellent case study of the spatio-temporal pattern of vegetation response to climatic and human influences in a climatic transition zone. The region has a steep precipitation gradient and is characterized by arid, semi-arid, dry sub-humid, and humid conditions, supporting various ecosystems, including shrubland, dry sub-humid savannas, woodlands, forest, and so on (Ogutu et al., Citation2021; Zhou et al., Citation2021). Different sub-regions with different vegetations may have different drivers of vegetation changes (Piao et al., Citation2019). A systematic and structural analysis of the drivers of vegetation greenness changes can help us to understand better the spatial pattern in the trends in vegetation dynamics. This improved understanding may shed light on how to advance the sustainable use of natural resources and mitigation of the impacts of climate change and of human activities in drylands ecosystems.
Therefore, this study mainly aimed at revealing the spatial pattern of the underlying drivers (i.e. precipitation, air temperature, and land cover changes) of changes in vegetation greenness as captured by the normalized difference vegetation index (NDVI) in the Sahel-Sudano-Guinean region. To achieve the aim of this study, the following two major questions were investigated: (1) what are the spatio-temporal patterns of vegetation greenness changes in the region from 2001 to 2019; (2) what is the spatial pattern of the drivers of observed trends.
2. Study area and materials
2.1. Study area
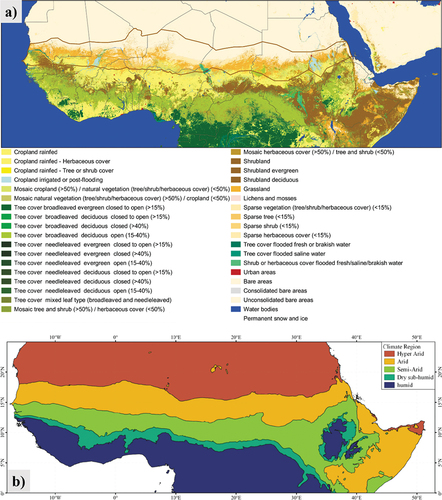
The African Sahel-Sudano-Guinean region (0–25°N, 20°W–60°E) stretches from the south of the Sahara Desert to the equator, which includes the Sahelian, Sudano Sahelian, Sudanian and Guinean zones in West Africa and the Great Horn of Africa in East Africa. According to the aridity index developed by FAO, the region is characterized by hyper-arid, arid, semi-arid, dry sub-humid, and humid conditions from the north to south (). The climate in the west is mainly dominated by the West African monsoon (Nicholson, Citation2009). In contrast, the climate in the east is driven mainly by Sea Surface Temperature (SST) dynamics in the Equatorial Pacific and Indian Ocean (Endris et al., Citation2019). The African Sahel-Sudano-Guinean region shows a structured N-S climatic gradient, and the amount of annual rainfall increases from less than 100 mm/yr in the north (Sahel region) to more than 2000 mm/yr in the south (the Guinean zone) (Zhou et al., Citation2021). Due to the complex topography, the precipitation pattern in the east exhibits a distinct heterogeneous spatial distribution compared with that in the west (Ali & Lebel, Citation2009). These spatial variations and gradients in climatic conditions, in turn, result in a diversity of ecosystems that ranges from desert and shrubland in arid conditions, savannah in semi-arid conditions, woodlands in sub-humid conditions to forest in humid conditions (). The region has more than a billion inhabitants, with the wetter southern region being more densely populated than the northern drier region (Ogutu et al., Citation2021). Livestock pastoralism is the main economic activity in the drier northern rural regions, while subsistence agriculture is dominant in the wetter southern regions. In recent years, the increasing population led to human-related activities, such as grazing, deforestation, and agriculture, which have distinct effects on local land cover and ecosystems (Asenso Barnieh et al., Citation2020; Herrmann et al., Citation2020).
Figure 1. Study area (African Sahel-Sudano-Guinean region): (a) land cover map, (b) bioclimatic zone. The land cover information is extracted from the ESA CCI-LC map of 2018. The bioclimatic zone is defined by the Aridity Index (AI) following the classification developed by FAO. The Aridity Index (AI) data is derived as the reciprocal of the aridity index layer extracted from the Global Aridity dataset released by CGIAR Consortium for Spatial Information (CGIAR-CSI). The AI is defined as the ratio of precipitation to reference evapotranspiration.
2.2. Data
In this study, the Normalized difference vegetation index (NDVI) time-series from Moderate Resolution Imaging Spectroradiometer NDVI product (MOD13A2 Collection 6 data) was used to represent the vegetation changes, and precipitation from the integrated multi-satellite Global Precipitation Measurement (GPM IMERG), air temperature from the European Centre for Medium-Range Weather Forecasts (ECMWF) Reanalysis v5 Land (ERA5-Land) dataset, and land cover datasets from the European Space Agency (ESA) Climate Change Initiative (CCI) Land Cover (LC) were applied to represent the candidate driving factors of the vegetation changes. Due to the differences in the spatial resolution of the various datasets and products, all the data were resampled to 0.05 degrees (median value among the spatial resolutions of all datasets) using the aggregation and resample functions from the Python package “gdal”. The resampling was done by snapping the resampled raster to a reference one to ensure that the new resized pixels were perfectly aligned and occupied the same position across the time series. Finally, we reprojected all the data to the same coordinate system (i.e. WGS 1984 projection).
2.2.1. Normalized difference vegetation index
The NDVI is one of the most widely used indicators of vegetation conditions in assessing vegetation greenness and its changes from local to global scales (Mishra & Mainali, Citation2017; Ogutu et al., Citation2021; Wang et al., Citation2021). To evaluate temporal trends and spatial patterns in the evolution of vegetation conditions, we used the latest version of the Moderate Resolution Imaging Spectroradiometer (MODIS) NDVI 16-day composite 1-km product (MOD13A2 Collection 6 data) covering the period from 2001 to 2019 (downloaded from www.reverb.echo.nasa.gov). Different from collection 5 which used composited daily data, collection 6 of MOD13A2 uses pre-composited data which is atmospherically corrected with a modified pre-compositing algorithm employing a minimum blue band approach to minimize aerosols and other contaminants (Didan et al., Citation2015). To further reduce the atmospheric contamination due to clouds and aerosols that remained in the original MODIS NDVI products, which are then still affected by noise, we utilized an improved Harmonic Analysis of Time Series (iHANTS) method to identify and remove clouds and aerosols contaminated observations, then reconstruct a consistent time series of NDVI data. The Harmonic ANalysis of Time Series (HANTS) algorithm, derived from the Fourier transformation theory, is widely applied to eliminate noise and reconstruct in the NDVI time series. iHANTS is updated from the classical HANTS by several reasonable parameter settings and design schemes, including inter-annual harmonic components, dynamic fitting error tolerance (FET) scheme, and dynamic update of weights (Zhou et al., Citation2016, Citation2021). When implementing the iHANTS, we used the quality control information of data products to improve the NDVI reconstruction performance. The reconstructed NDVI time series of different land cover types in our study area show good performance of the iHANTS method (Supplementary Figures S1, S2).
We resampled the reconstructed 16-day NDVI time-series data from the original spatial resolution to 0.05° using the mean function in the Python package “gdal”, and calculated the annual mean NDVI for each pixel. As most outliers of the NDVI time-series data have been removed by the iHANTS, the annual mean of the reconstructed NDVI time series can be used for the trend analysis.
2.2.2. Precipitation data
To evaluate the impacts of precipitation on the trend in vegetation greenness, we used the integrated multi-satellite Global Precipitation Measurement (GPM IMERG) monthly product with a spatial resolution of 0.1° × 0.1° provided by the National Aeronautics and Space Administration (NASA) (Huffman et al., Citation2020). As the successor of the Tropical Rainfall Measuring Mission (TRMM), GPM enables more precise and reliable rainfall estimations (Li et al., Citation2021). The GPM IMERG product uses sensors onboard satellites in different constellations to detect precipitation and provides more accurate and reliable spatio-temporal data by using a multi-satellite integrated inversion algorithm and processing program (Iguchi et al., Citation2010). The IMERG has been widely used in many studies (Li et al., Citation2021; Tang et al., Citation2020). We calculated the annual sums from the monthly GPM IMERG data covering the period from 2000 to 2019 and then resampled them from the original spatial resolution to 0.05° using the cubic convolution function, which is appropriate for continuous data and is geometrically less distorted than the raster achieved by running the nearest neighbor resampling algorithm
2.2.3. Air temperature data
To evaluate the impact of temperature on vegetation greenness, we extracted air temperature data from the European Centre for Medium-Range Weather Forecasts (ECMWF) Reanalysis v5 Land (ERA5-Land) dataset available at https://doi.org/10.24381/cds.68d2bb30. ERA5-Land is a reanalysis dataset providing a consistent view of the evolution of land variables over several decades at an enhanced spatial resolution compared to ERA5 (Muñoz et al., Citation2021). ERA5-Land is provided at 0.1° spatial resolution and at hourly, daily or monthly temporal resolution. In this study, we selected the monthly average product for the period from 2001 to 2019 (Muñoz, Citation2019) to calculate the annual averages, and then resampled them to 0.05° using the cubic convolution function.
2.2.4. Land cover data
To evaluate the impact of land cover changes on vegetation greenness, we utilized the European Space Agency (ESA) Climate Change Initiative (CCI) Land Cover (LC) annual maps from 2001 to 2019 to represent continuous land-surface cover (downloaded from http://www.esa-landcover-cci.org/). The ESA-CCI-LC dataset was produced by the ESA-CCI program at 300 m spatial resolution using observations from multiple sensors, for example, the Advanced Very High-Resolution Radiometer (AVHRR), the Systeme Probatoire d’Observation de la Terre Vegetation (SPOT-VGT), and the PROBA-V. The ESA-CCI-LC dataset uses the LC Classification System defined by the FAO and applies 37 LC types (ESA, Citation2017). For this study, to facilitate the attribution of observed vegetation trends to human-managed vegetation changes, we reclassified the 37 original LC classes into 3 major types: agriculture (reflecting human-managed vegetation), natural vegetation, and non-vegetation. The original and adapted LC classes are presented in .
Table 1. Lookup table applied to reclassify land cover types from the ESA CCI land cover products.
We then estimated and mapped the fractional abundance of the reclassified 3 LC types data at 0.05° × 0.05° spatial resolution (i.e. the ratio of the number of pixels at 300 m resolution per class to the number of all pixels at 300 m resolution in the 0.05° pixel) and yearly time interval, based on the ESA-CCI-LC dataset at 300 m spatial resolution for the period from 2001 to 2019. Since the fractional abundances of the three reclassified LC types add up to 1, the fractional abundance of the third class is determined by the sum of two out of the three LC types. To avoid this duplicated LC information in the assessment of the relative importance of each driver, we only included the fractional abundance of classes 1-agriculture class and 2-natural vegetation class to represent the land use and land cover driver in our analysis.
3. Methods
In this study, we applied the Mann–Kendall test to assess the trends in vegetation greenness in the Sahel-Sudano-Guinean region, as estimated with the MODIS MOD13A2 Collection 6 NDVI data. Then we assumed that the observed trends in vegetation greenness were due to a combination of climate change and human activities. The principal component regression analysis method was applied to estimate the relative importance of climatic and anthropic potential driving factors on the vegetation greenness changes and finally to identify the spatial pattern of the candidate drivers in the region. shows the workflow of data pre-processing and analysis in this study.
Figure 2. Workflow of data pre-processing and analysis.
3.1. Detecting trends in vegetation greenness
To evaluate the trends in vegetation greenness, we applied a non-parametric Mann-Kendall (MK) test to the time series of annual averaged NDVI data at the pixel level. The MK test is commonly used as a test of significance for the Theil-Sen estimator, which is a non-parametric method to detect a monotonic trend in a time series and is widely used in the analysis of trends in climatic and vegetation variables (Yue et al., Citation2002). We conducted the MK trend test using the Yue-Pilon pre-whitening method provided by the Python package “pyMannKendall”. In order to remove potential temporal autocorrelation of the data, the Yue-Pilon pre-whitening method detrends the time series and then removes a lag 1 autoregressive process from the time series prior to applying the MK test to assess the significance of trend. Then MK test is used to detect trend in the residual (or prewhitened) series. The trends with a confidence level of 95% (p ≤ 0.05) were considered to be statistically significant in this study.
3.2. Relative importance of candidate driving factors
As mentioned in the Introduction, we chose precipitation (current year precipitation and previous year precipitation), air temperature, and land cover, specifically the fractional abundance of post-classified agriculture and natural vegetation according to the re-classified rules (), as candidate drivers of vegetation greenness in the Sahel-Sudano-Guinean region (Chen et al., Citation2019; Ogutu et al., Citation2021; Piao et al., Citation2019; Zhu et al., Citation2016). As the collinearity may exist in the candidate drivers, we adopted the Principal Component Regression (PCR) approach (Abel et al., Citation2021; Seddon et al., Citation2016), to estimate the relative importance of each candidate driver. This approach is a regression analysis technique that is based on the principal component analysis (PCA), which can reduce the impact of collinearity between the independent variables, that is, the drivers in our case. We analogously used the PCR approach as Abel et al. (Citation2021) did and the implementation of the PCR is divided into three major steps ().
Figure 3. Flow-chart of the method used to estimate the relative importance of each driver variable.
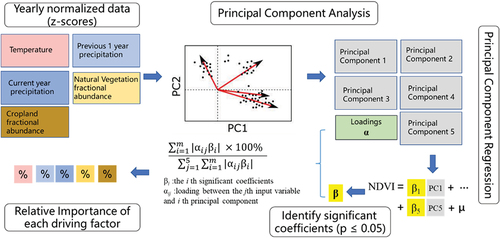
First, at the pixel level, we normalized all yearly time series of input variables into z-scores anomalies using their yearly means and standard deviations. We then used PCA to transform all normalized input variables (the z-score time series) into a set of principal components that are now uncorrelated but still explain all the variation in the data. The number of principal components (5 principal components) is equivalent to the number of input variables. Each of the components has scores and loadings, with the latter indicating the correlation between the principal component and the input variables.
Then, taking NDVI as the dependent variable and the principal components as independent variables, an ordinary least-squares regression (OLS) was performed to obtain the estimated regression coefficients of each principal component. The significant coefficients (p ≤ 0.05) were selected for further analysis.
Finally, the significant regression coefficients of principal components from PCR were multiplied with the respective loadings from the PCA. The absolute values of these results for each driving factor were added to obtain the final coefficients for each driving factor. As the loading indicates the correlation between the principal component and the input variables and the significant coefficients indicate the relative importance of the principal components on the NDVI, these final coefficients can reflect the relative importance of each driving factor on the NDVI. The driving factor with the highest relative importance was regarded as the dominant driver of the changes in NDVI for one pixel.
We performed the PCR analysis only on pixels with a significant trend in vegetation greenness using Python scripts.
4. Results
4.1. Trends in vegetation greenness
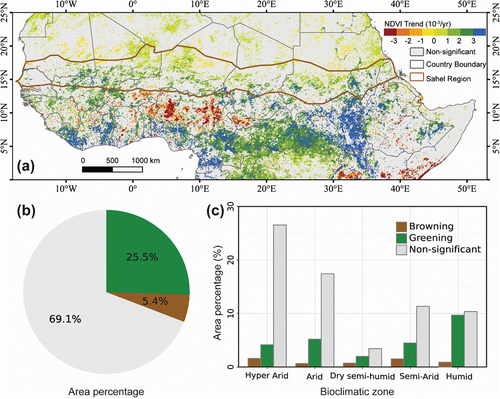
Our trend analysis of NDVI indicates that greening, that is, increasing greenness presented by increasing NDVI, is widespread in the African Sahel-Sudano-Guinean region, while browning (declining greenness) is relatively concentrated in a few areas (). Approximately one-third (31%, 0.81 million km2) of the Sahel-Sudano-Guinean region shows significant trends (either positive or negative) in NDVI over the past two decades (2001–2019). This translates into 25.5% (0.67 million km2) positive and 5.4% (0.14 million km2) negative trends (). In general, positive trends indicate greening, and negative trends point towards browning. Greening is widely observed in the region. The humid bioclimatic zone in the south has the largest share of pixels with a positive trend, followed by part of the arid bioclimatic zone in the southern Sahelian core region (). Browning is prominently clustered in the semi-arid and sub-humid bioclimatic zone in Central West Africa (mainly in Central Nigeria and Southern Chad), accounting for more than 60% of the entire browning area ().
Figure 4. Trends in vegetation greenness in the Sahel-Sudano-Guinean Region: (a) spatial pattern of the significant vegetation greenness trends (Mann–Kendal test, p ≤ 0.05) at 0.05° × 0.05° grid cells; (b) fractional abundance of greening, browning, and no significant trends in the entire region; (c) fractional abundance of greening, browning and no significant trends in each bioclimatic zone. (b) and (c) share the same legend, i.e. green color for “greening”, brown color for “browning”, and grey color for “not-significant”.
In addition, the issues of NDVI saturation effect in dense canopies and soil background variations in spare canopies may raise concerns about uncertainties in the trends results. We compared the results of trend analysis based on NDVI and the enhanced vegetation index (EVI, less saturated in dense vegetation) using the same method. The trends in vegetation greenness obtained from the EVI (MOD13A2 product) have a similar pattern to that obtained from NDVI in our study (Supplementary Figure S3). Our trend analysis based on NDVI is robust.
4.2. Spatial pattern of the underlying drivers of the changes in vegetation greenness
Our PCR analysis shows that more than two-thirds of significant trends in pixelwise vegetation greenness (greening or browning) are mainly driven by climate (69.4%), and approximately one-third is mainly attributed to land cover (30.6%). Specifically, climatic and LC drivers contribute to 70.4% and 29.6% of greening trends, respectively, while contributing to 64.9% and 35.1% of browning trends.
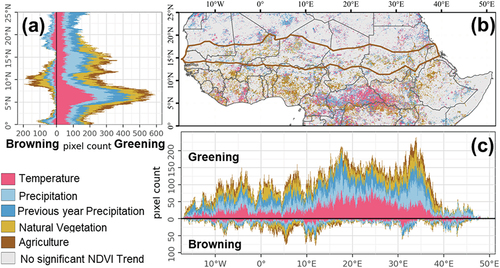
The dominant drivers of the significant vegetation greenness trends show a clear spatial pattern in the Sahel-Sudano-Guinean region (). In general, the fraction of the pixels with significant vegetation greenness trends mainly attributed to precipitation decreases from north to south, while the fraction attributed to temperature increases (). The influence of LC factors starts increasing in the Sahel belt (south than 20°N), then reaches a maximum around 10°N. The browning trends in the north (15°N–25°N) and the south (0°–5°N) are mainly caused by precipitation, while LC factors are the main drivers in the central part of the region (near 10°N, 5°E) ().
Figure 5. Dominant drivers of the significant vegetation greenness trends in the Sahel-Sudano-Guinean Region: (a) latitudinal profile of the number of the pixels with significant vegetation greenness trends caused by each dominant driving factor; (b) spatial pattern at 0.05° × 0.05° grid cells; (c) longitudinal profile of the number of the pixels with significant vegetation greenness trends caused by each dominant driving factor.
shows the contribution of each driver to the greenness trends in each bioclimatic zone. The contribution is calculated as the fraction of pixels in a certain bioclimatic zone with a significant greening trend caused by each driver. The contribution of climate to the greening trend decreases from the hyper-arid zone (94.8%) to the humid bioclimatic zone (65.3%), while the trends in the influence of land cover are opposite. The trends are particularly evident in the browning areas, with climate factors accounting for almost 100% of significant browning trends in the hyper-arid zone and losing dominance in the dry semi-humid and humid zones (24.9% and 44.5%, respectively). Both precipitation and temperature have the strongest significant influence on greenness trends in the hyper-arid bioclimatic zone, but the trends from arid bioclimatic zone to humid bioclimatic zone are opposite, that is, the contribution of precipitation decreases, while the influence of temperature increases. In addition, the temperature accounts for more greening trends in the humid bioclimatic zone and more browning trends in the hyper-arid bioclimatic zone.
Figure 6. Contributions of underlying driving factors to the significant trends (greening and browning) in each bioclimatic zone (i.e. hyper-arid, arid, semi-arid, dry sub-humid, and humid bioclimatic zone) in the Sahel-Sudano-Guinean Region. The contribution is defined as the fraction of pixels with significant greening trends in a certain bioclimatic zone caused by each dominant driver. The statistics for the areas with a significant browning trend are plotted on the left side of the central red line, while on its right side are the statistics for the areas with a significant greening trend.
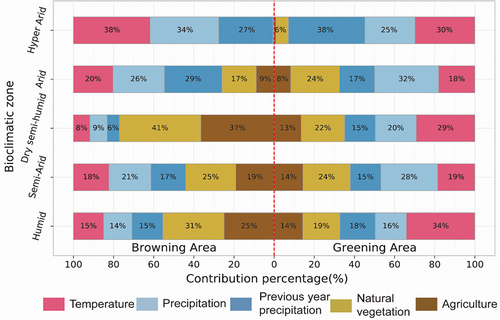
The browning trends driven by LC changes increase from the arid to the humid bioclimatic zone, whereas the significant greening trends driven by LC changes in each bioclimatic zone keep steady. The browning clustered areas in the semi-arid and semi-humid bioclimatic zone in central West Africa are mainly driven by land cover change ().
5. Discussion
In this study, we provided a region-wide assessment of trends in vegetation greenness and the spatial pattern of the dominant drivers of observed trends in the Sahel-Sudano-Guinean region. Based on the latest MODIS collection 6 NDVI dataset (MOD13A2), we found that greening trends in vegetation are widely distributed in the region from 2001 to 2019, which is consistent with the trends evaluated in previous studies using different datasets in different periods, such as MODIS LAI (2001–2017) (Chen et al., Citation2019), SPOT-VGT NDVI (2001–2010) (Hoscilo et al., Citation2015), MODIS EVI (2001–2009) (Cho et al., Citation2015), and MODIS NDVI (2000–2015) (Leroux et al., Citation2017). Previous studies suggest a greening trend from 1982 to 2015 (Chen et al., Citation2019; Ogutu et al., Citation2021; Piao et al., Citation2019). Our findings applying the most recent years further show a continuing greening trend in the region. At the same time, we also found that the areas with browning trends are clustered in the semi-arid and semi-humid bioclimatic zone in central West Africa. The browning trends are in line with the browning trends in earlier periods reported by many studies using various EO datasets (Leroux et al., Citation2017), which indicates a continued deterioration of vegetation conditions in these browning areas.
Few previous studies focus on the drivers of vegetation greenness trends in the entire Sahel-Sudano-Guinean region to reflect how climate and human interactions affect vegetation changes. Most previous studies are at a global scale (Chen et al., Citation2019; Zhu et al., Citation2016), or at a particular hotspot, such as the Sahel region (Brandt et al., Citation2017a; Kaptué et al., Citation2015; Leroux et al., Citation2017). Our analysis of the drivers of the trends in vegetation greenness filled this gap and revealed a spatial pattern in drivers, which is related to the climate gradient characteristic of the region.
Precipitation and temperature are the primary drivers of the trends in vegetation greenness. Precipitation has the strongest influence on vegetation greenness trends in the hyper-arid bioclimatic zone, but the influence decreases from the arid zone to the humid bioclimatic zone. This is because, in the arid and semi-arid zones, water availability is a key limiting factor for vegetation growth, but the water limitation decreases from the arid bioclimatic zone to the humid bioclimatic zone, which has been documented by many previous studies (Brandt et al., Citation2019; Fensholt et al., Citation2012; Piao et al., Citation2019). In addition, previous studies indicate that vegetation dynamics have a different response to precipitation changes at different timescales (Zhou et al., Citation2021). Our results also show that in hyper-arid and humid zones the influences of the previous year precipitation are larger than the current year precipitation. According to the “pulse-reserve” paradigm (Collins et al., Citation2014; Noy-Meir, Citation1973; Reynolds et al., Citation2004), the intermittent rainfall input to dryland ecosystems might be accumulated in the soil at different depths and with different durations, which leads to a multi-scale soil “memory effect” and in turn regulates biological processes such as plant growth or reproduction at multiple spatial and temporal scales. Since the hyper-arid bioclimatic zone is the most water-limited area and has the largest water depths of soil among the 5 bioclimatic zones, the effect of multi-annual accumulation is much stronger than in other climatic regions, which may lead to a lagged response of vegetation greenness to precipitation and increases the importance of the previous year precipitation. In the humid zone, the forest is the major vegetation type () and has a slower response to the changes in precipitation because of the deeper rooting system, which also highlights the influences of the previous year precipitation.
In contrast to the decreasing proportion of the significant trends driven by the precipitation, the fraction of the significant trends in vegetation greenness driven by air temperature in each bioclimatic zone shows an increasing trend from the arid to the humid zone. This can also be attributed to the shift in sensitivity factors of vegetation growth from water availability to radiation availability. From the water-sensitivity regions to the radiation-sensitivity regions, the effect of water restriction gradually weakens. In contrast, the radiation restriction gradually increases, which in turn causes vegetation changes to become more and more sensitive to temperature changes. Furthermore, the air temperature is generally increasing in the region (). We found that the largest fraction of the browning trends () driven by the air temperature is in the hyper-arid bioclimatic zone. The largest fraction of the greening trends () driven by the temperature is in the humid zone, which suggests that the increasing air temperature may restrict the vegetation growth in the hyper-arid bioclimatic zone, but promotes the vegetation growth in the humid zone, possibly because of the higher mean annual air temperature in the north.
Figure 7. Trends in temperature and precipitation and natural vegetation and agriculture at locations identified by a significant (Mann-Kendall trend test, p ≤ 0.05) on NDVI trends: (a) temperature; (b) precipitation; (c) natural vegetation; (d) agriculture.
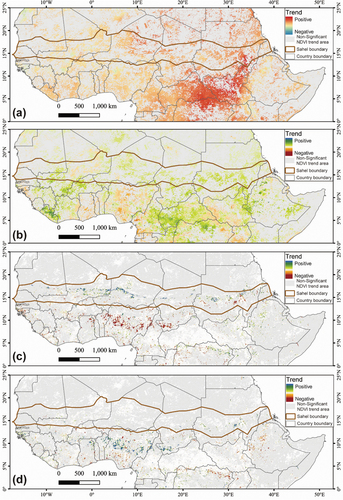
Most previous studies have demonstrated that land cover change is one of the dominant drivers (Chen et al., Citation2019; Piao et al., Citation2019). Our study shows that land cover changes drive approximately one-third of the trends in greenness. The proportion of the significant trends driven by land cover changes, especially the human-induced agriculture changes, increases from the arid to humid zone, which may be attributed to growing human activities caused by the increased population density in the humid zone. In the arid zone, especially the Niger river basin in Mali in the west Sahel region (about 15°N) (), the observed greening is driven by the increasing fractional abundance of natural vegetation (), which may be due to the combined impacts of increased precipitation () and human activities (for example, the “Great Green Wall” project, cropland expansion) (Anchang et al., Citation2019; Brandt et al., Citation2015, Citation2016). However, the most significant trends have a negative correlation with land cover changes in the sub-arid and sub-humid zones. We found that the observed browning areas in the semi-arid and semi-humid zones in central West Africa () are primarily driven by land cover changes, largely overlapping with areas experiencing a significant increasing trend in the fractional abundance of agriculture and decreasing in the fractional abundance of natural vegetation, reflecting increasing human activities (). At the same time, the observed greening trends driven by LC changes in the north of Ethiopia (near 10°N, 37°E) and northwest (near 4°N, 20°E) and east regions (near 3°N, 30°E) of the Democratic Republic of the Congo and Central Africa are associated with a decreasing trend in agriculture and increasing in natural vegetation (). The expansion of agriculture led to vegetation browning in this region (Brandt et al., Citation2017b), contrary to the finding that intensive agriculture in India promotes greening of vegetation (Chen et al., Citation2019). With the projected continuing growth of the population in Africa (Gerland et al., Citation2014), more cropland is needed, which may lead to aggravating environmental degradation in the Sahel. More attention should be paid to the sustainable use of the land resources in this region.
This study highlighted the spatial pattern of the factors driving the significant trends in vegetation greenness in the Sahel-Sudano-Guinan region with a steep climatic gradient. There are a few limitations in the study, however. First, we did not evaluate the role of the CO2 fertilization, which has been reported as a dominant driver of global vegetation greening, due to the lack of a geospatial dataset covering the study period. Second, we used the PCR method to investigate the impacts of each underlying driver quantitatively and then determined the dominant drivers based on the absolute importance scores. However, the absolute value cannot reflect the direction of the impacts of drivers, which may fail to reflect the positive or negative relationship between the drivers and observed trends directly. The detection of the direction of the drivers needs to rely on other methods. Finally, the original datasets had different spatial and temporal resolutions. Aggregating these data through temporal and spatial resampling probably resulted in some information loss and smoothing, thereby introducing some uncertainties in the results.
6. Conclusion
This study revealed the spatial pattern of the vegetation greenness trend and evaluated the dominant drivers across the Sahel-Sudano-Guinean region. Vegetation greening trends are widespread in the region, while vegetation browning trends are more clustered in central West Africa. The dominant drivers of the observed trends have a distinct spatial pattern, responding to the climatic gradient in the region. Precipitation and temperature are the primary drivers in this region, but spatial patterns were observed. The impacts of precipitation decrease from the arid to the humid zone, conversely the impact of temperature increases from the arid to the humid zone. Coupled with climate changes, land cover changes mainly led to increasing natural vegetation and resulted in more greening trends in the arid zone, especially in the western Sahelian belt. However, in the semi-arid and semi-humid zones, land cover changes contributed to vegetation browning trends. The cluster with browning trends, located in central West Africa, is primarily driven by human-induced land cover changes, including the increasing fractional abundance of agriculture, and decreasing fractional abundance of natural vegetation, which indicates that more attention should be paid to the sustainable use of natural resources in the region with projected increased population. The findings from this study could shed light on the mitigation of the impacts of climate change and human activities in the global dryland ecosystems and on global climate change mitigation strategies.
Supplemental Material
Download MS Word (788.4 KB)Disclosure statement
No potential conflict of interest was reported by the author(s).
Data availability statement
Data sharing is not applicable to this article as no new data were created or analyzed in this study.
Supplementary material
Supplemental data for this article can be accessed online at https://doi.org/10.1080/20964471.2022.2146632
Additional information
Funding
Notes on contributors

Min Jiang
Min Jiang received the Ph.D. degree in physical geography. from the University of Chinese Academy of Sciences, Beijing, China, in 2019. He is an assistant researcher with the Aerospace Information Research Institute, Chinese Academy of Sciences, Beijing, China. His research interests include vegetation change and drought monitoring, land use and cover change and its environmental effects.

Li Jia
Li Jia received the B.S. degree in dynamic meteorology from the Beijing College of Meteorology, Beijing, China, the M.Sc. degree in atmospheric physics from the Chinese Academy of Sciences in China, and the Ph.D. degree in environmental science from Wageningen University, Wageningen, The Netherlands. She is a professor with the State Key Laboratory of Remote Sensing Science, the Aerospace Information Research Institute, Chinese Academy of Sciences. Her research interests include the earth observation and its applications in hydrometeorology, water resource, agriculture, and global change.

Massimo Menenti
Massimo Menenti received the Ph.D. degree in environmental sciences from the University of Wageningen, Wageningen, The Netherlands, in 1984. He is currently a foreign expert with the Aerospace Information Research Institute, Chinese Academy of Science, Beijing, China. His research interests include earth observations and the global terrestrial water cycle, including the retrieval of land surface parameters from remote sensing, land surface processes (specifically on heat and water exchanges between the land and atmosphere), time-series analysis of satellite remote sensing observations, and the application of remote sensing in hydrology, agriculture, water resources, crop yields, and climate models.

Yelong Zeng
Yelong Zeng received the Master degree in Forestry from Guizhou University, China, in 2018. He is currently pursuing the Ph.D. degree with the Aerospace Information Research Institute, Chinese Academy of Sciences, Beijing, China. His research interest is in remote sensing applications on ecology and climate change.
References
- Abel, C., Horion, S., Tagesson, T., De Keersmaecker, W., Seddon, A. W. R., Abdi, A. M., & Fensholt, R. (2021). The human–environment nexus and vegetation–rainfall sensitivity in tropical drylands. Nature Sustainability, 4(1), 25–32. https://doi.org/10.1038/s41893-020-00597-z
- Ali, A., & Lebel, T. (2009). The Sahelian standardized rainfall index revisited. International Journal of Climatology: A Journal of the Royal Meteorological Society, 29(12), 1705–1714. https://doi.org/10.1002/joc.1832
- Anchang, J. Y., Prihodko, L., Kaptué, A. T., Ross, C. W., Ji, W., Kumar, S. S., Lind, B., Sarr, M. A., Diouf, A. A., & Hanan, N. P. (2019). Trends in woody and herbaceous vegetation in the Savannas of West Africa. Remote Sensing, 11(5), Article 5. https://doi.org/10.3390/rs11050576
- Asenso Barnieh, B., Jia, L., Menenti, M., Zhou, J., & Zeng, Y. (2020). Mapping land use land cover transitions at different spatiotemporal scales in West Africa. Sustainability, 12(20), Article 20. https://doi.org/10.3390/su12208565
- Brandt, M., Hiernaux, P., Rasmussen, K., Mbow, C., Kergoat, L., Tagesson, T., Ibrahim, Y. Z., Wélé, A., Tucker, C. J., & Fensholt, R. (2016). Assessing woody vegetation trends in Sahelian drylands using MODIS based seasonal metrics. Remote Sensing of Environment, 183, 215–225. https://doi.org/10.1016/j.rse.2016.05.027
- Brandt, M., Hiernaux, P., Rasmussen, K., Tucker, C. J., Wigneron, J.-P., Diouf, A. A., Herrmann, S. M., Zhang, W., Kergoat, L., Mbow, C., Abel, C., Auda, Y., & Fensholt, R. (2019). Changes in rainfall distribution promote woody foliage production in the Sahel. Communications Biology, 2(1), 1–10. https://doi.org/10.1038/s42003-019-0383-9
- Brandt, M., Mbow, C., Diouf, A. A., Verger, A., Samimi, C., & Fensholt, R. (2015). Ground- and satellite-based evidence of the biophysical mechanisms behind the greening Sahel. Global Change Biology, 21(4), 1610–1620. https://doi.org/10.1111/gcb.12807
- Brandt, M., Rasmussen, K., Peñuelas, J., Tian, F., Schurgers, G., Verger, A., Mertz, O., Palmer, J. R. B., & Fensholt, R. (2017a). Human population growth offsets climate-driven increase in woody vegetation in sub-Saharan Africa. Nature Ecology & Evolution, 1(4), 1–6. https://doi.org/10.1038/s41559-017-0081
- Brandt, M., Rasmussen, K., Peñuelas, J., Tian, F., Schurgers, G., Verger, A., Mertz, O., Palmer, J. R., & Fensholt, R. (2017b). Human population growth offsets climate-driven increase in woody vegetation in sub-Saharan Africa. Nature Ecology & Evolution, 1(4), 1–6.
- Charney, J. G. (1975). Dynamics of deserts and drought in the Sahel. Quarterly Journal of the Royal Meteorological Society, 101(428), 193–202. https://doi.org/10.1002/qj.49710142802
- Chen, C., Park, T., Wang, X., Piao, S., Xu, B., Chaturvedi, R. K., Fuchs, R., Brovkin, V., Ciais, P., Fensholt, R., Tømmervik, H., Bala, G., Zhu, Z., Nemani, R. R., & Myneni, R. B. (2019). China and India lead in greening of the world through land-use management. Nature Sustainability, 2(2), 122–129. https://doi.org/10.1038/s41893-019-0220-7
- Cho, J., Lee, Y.-W., & Lee, H.-S. (2015). The effect of precipitation and air temperature on land-cover change in the Sahel. Water and Environment Journal, 29(3), 439–445. https://doi.org/10.1111/wej.12118
- Collins, S. L., Belnap, J., Grimm, N. B., Rudgers, J. A., Dahm, C. N., D’Odorico, P., Litvak, M., Natvig, D. O., Peters, D. C., & Pockman, W. T. (2014). A multiscale, hierarchical model of pulse dynamics in arid-land ecosystems. Annual Review of Ecology, Evolution, and Systematics, 45(1), 397–419. https://doi.org/10.1146/annurev-ecolsys-120213-091650
- Didan, K., Munoz, A. B., Solano, R., & Huete, A. (2015). MODIS vegetation index user’s guide (MOD13 series). University of Arizona: Vegetation Index and Phenology Lab.
- Eklundh, L., & Olsson, L. (2003). Vegetation index trends for the African Sahel 1982–1999. Geophysical Research Letters, 30(8). https://doi.org/10.1029/2002GL016772
- Endris, H. S., Lennard, C., Hewitson, B., Dosio, A., Nikulin, G., & Artan, G. A. (2019). Future changes in rainfall associated with ENSO, IOD and changes in the mean state over Eastern Africa. Climate Dynamics, 52(3), 2029–2053. https://doi.org/10.1007/s00382-018-4239-7
- ESA. (2017). Land cover CCI product user guide version 2. maps.elie.ucl.ac.be/CCI/viewer/download/ESACCI-LC-Ph2-PUGv2_2.0.pdf
- Fensholt, R., Langanke, T., Rasmussen, K., Reenberg, A., Prince, S. D., Tucker, C., Scholes, R. J., Le, Q. B., Bondeau, A., & Eastman, R. (2012). Greenness in semi-arid areas across the globe 1981–2007—an earth observing satellite based analysis of trends and drivers. Remote Sensing of Environment, 121, 144–158. https://doi.org/10.1016/j.rse.2012.01.017
- Fensholt, R., Mbow, C., Brandt, M., & Rasmussen, K. (2017). Desertification and re-greening of the Sahel. In Oxford research encyclopedia of climate science. Oxford University Press. https://doi.org/10.1093/acrefore/9780190228620.013.553
- Gerland, P., Raftery, A. E., Ševčíková, H., Li, N., Gu, D., Spoorenberg, T., Alkema, L., Fosdick, B. K., Chunn, J., & Lalic, N. (2014). World population stabilization unlikely this century. Science, 346(6206), 234–237. https://doi.org/10.1126/science.1257469
- Herrmann, S. M., Brandt, M., Rasmussen, K., & Fensholt, R. (2020). Accelerating land cover change in West Africa over four decades as population pressure increased. Communications Earth & Environment, 1(1), 1–10. https://doi.org/10.1038/s43247-020-00053-y
- Hoscilo, A., Balzter, H., Bartholomé, E., Boschetti, M., Brivio, P. A., Brink, A., Clerici, M., & Pekel, J. F. (2015). A conceptual model for assessing rainfall and vegetation trends in sub-Saharan Africa from satellite data. International Journal of Climatology, 35(12), 3582–3592. https://doi.org/10.1002/joc.4231
- Huffman, G. J., Bolvin, D. T., Braithwaite, D., Hsu, K., Joyce, R., Kidd, C., Nelkin, E. J., Sorooshian, S., Tan, J., & Xie, P. (2020). NASA global precipitation measurement (GPM) integrated multi-satellite retrievals for GPM (IMERG). Algorithm Theoretical Basis Document (ATBD) Version, 6(3), 1–7. https://gpm.nasa.gov/sites/default/files/2020-05/IMERG_ATBD_V06.3.pdf
- Iguchi, T., Seto, S., Meneghini, R., Yoshida, N., Awaka, J., Le, M., Chandrasekar, V., & Kubota, T. (2010). GPM/DPR level-2 algorithm theoretical basis document. NASA Goddard Space Flight Center.
- Kaptué, A. T., Prihodko, L., & Hanan, N. P. (2015). On regreening and degradation in Sahelian watersheds. Proceedings of the National Academy of Sciences, 112(39), 12133–12138. https://doi.org/10.1073/pnas.1509645112
- Lamchin, M., Wang, S. W., Lim, C.-H., Ochir, A., Pavel, U., Gebru, B. M., Choi, Y., Jeon, S. W., & Lee, W.-K. (2020). Understanding global spatio-temporal trends and the relationship between vegetation greenness and climate factors by land cover during 1982–2014. Global Ecology and Conservation, 24, e01299. https://doi.org/10.1016/j.gecco.2020.e01299
- Leroux, L., Bégué, A., Seen, D. L., Jolivot, A., & Kayitakire, F. (2017). Driving forces of recent vegetation changes in the Sahel: Lessons learned from regional and local level analyses. Remote Sensing of Environment, 191, 38–54. https://doi.org/10.1016/j.rse.2017.01.014
- Li, G., Yu, Z., Wang, W., Ju, Q., & Chen, X. (2021). Analysis of the spatial distribution of precipitation and topography with GPM data in the Tibetan plateau. Atmospheric Research, 247, 105259. https://doi.org/10.1016/j.atmosres.2020.105259
- Lu, X., Wang, L., & McCabe, M. F. (2016). Elevated CO2 as a driver of global dryland greening. Scientific reports, 6(1), 20716. https://doi.org/10.1038/srep20716
- Mishra, N. B., & Mainali, K. P. (2017). Greening and browning of the Himalaya: Spatial patterns and the role of climatic change and human drivers. The Science of the Total Environment, 587–588, 326–339. https://doi.org/10.1016/j.scitotenv.2017.02.156
- Muñoz, S. J. (2019). ERA5-land monthly averaged data from 1981 to present. Copernicus Climate Change Service (C3S) Climate Data Store (CDS).
- Muñoz, S. J., Dutra, E., Agustí-Panareda, A., Albergel, C., Arduini, G., Balsamo, G., Boussetta, S., Choulga, M., Harrigan, S., Hersbach, H., Martens, B., Miralles, D. G., Piles, M., Rodríguez-Fernández, N. J., Zsoter, E., Buontempo, C., & Thépaut, J.-N. (2021). ERA5-Land: A state-of-the-art global reanalysis dataset for land applications. Earth System Science Data, 13(9), 4349–4383. https://doi.org/10.5194/essd-13-4349-2021
- Nicholson, S. E. (2009). A revised picture of the structure of the “monsoon” and land ITCZ over West Africa. Climate Dynamics, 32(7), 1155–1171. https://doi.org/10.1007/s00382-008-0514-3
- Nicholson, S. E., Tucker, C. J., & Ba, M. B. (1998). Desertification, drought, and surface vegetation: An example from the West African Sahel. Bulletin of the American Meteorological Society, 79(5), 815–830. doi:10.1175/1520-0477(1998)079<0815:DDASVA>2.0.CO;2
- Noy-Meir, I. (1973). Desert ecosystems: Environment and producers. Annual Review of Ecology and Systematics, 4(1), 25–51. https://doi.org/10.1146/annurev.es.04.110173.000325
- Ogutu, B. O., D’Adamo, F., & Dash, J. (2021). Impact of vegetation greening on carbon and water cycle in the African Sahel-Sudano-Guinean region. Global and Planetary Change, 202, 103524. https://doi.org/10.1016/j.gloplacha.2021.103524
- Piao, S., Wang, X., Park, T., Chen, C., Lian, X., He, Y., Bjerke, J. W., Chen, A., Ciais, P., Tømmervik, H., Nemani, R. R., & Myneni, R. B. (2019). Characteristics, drivers and feedbacks of global greening. Nature Reviews Earth & Environment, 1(1), 14–27. https://doi.org/10.1038/s43017-019-0001-x
- Prince, S. D., De Colstoun, E. B., & Kravitz, L. L. (1998). Evidence from rain-use efficiencies does not indicate extensive Sahelian desertification. Global Change Biology, 4(4), 359–374. https://doi.org/10.1046/j.1365-2486.1998.00158.x
- Reynolds, J. F., Kemp, P. R., Ogle, K., & Fernández, R. J. (2004). Modifying the ‘pulse–reserve’paradigm for deserts of North America: Precipitation pulses, soil water, and plant responses. Oecologia, 141(2), 194–210. https://doi.org/10.1007/s00442-004-1524-4
- Seddon, A. W. R., Macias-Fauria, M., Long, P. R., Benz, D., & Willis, K. J. (2016). Sensitivity of global terrestrial ecosystems to climate variability. Nature, 531(7593), 229–232. https://doi.org/10.1038/nature16986
- Tang, G., Clark, M. P., Papalexiou, S. M., Ma, Z., & Hong, Y. (2020). Have satellite precipitation products improved over last two decades? A comprehensive comparison of GPM IMERG with nine satellite and reanalysis datasets. Remote Sensing of Environment, 240, 111697. https://doi.org/10.1016/j.rse.2020.111697
- Tian, F., Fensholt, R., Verbesselt, J., Grogan, K., Horion, S., & Wang, Y. (2015). Evaluating temporal consistency of long-term global NDVI datasets for trend analysis. Remote Sensing of Environment, 163, 326–340. https://doi.org/10.1016/j.rse.2015.03.031
- Toulmin, C., & Brock, K. (2016). Desertification in the Sahel: Local practice meets global narrative. In Philippe, B., Eric, G., Jorge, R., Clive, H.(Eds.)The end of desertification? (pp. 37–63). Springer.
- Wang, H., Yan, S., Liang, Z., Jiao, K., Li, D., Wei, F., & Li, S. (2021). Strength of association between vegetation greenness and its drivers across China between 1982 and 2015: Regional differences and temporal variations. Ecological indicators, 128, 107831. https://doi.org/10.1016/j.ecolind.2021.107831
- Xu, L., Myneni, R. B., Chapin Iii, F. S., Callaghan, T. V., Pinzon, J. E., Tucker, C. J., Zhu, Z., Bi, J., Ciais, P., & Tømmervik, H. (2013). Temperature and vegetation seasonality diminishment over northern lands. Nature Climate Change, 3(6), 581–586. https://doi.org/10.1038/nclimate1836
- Yue, S., Pilon, P., Phinney, B., & Cavadias, G. (2002). The influence of autocorrelation on the ability to detect trend in hydrological series. Hydrological processes, 16(9), 1807–1829. https://doi.org/10.1002/hyp.1095
- Zhou, J., Jia, L., Menenti, M., & Liu, X. (2021). Optimal estimate of global biome—specific parameter settings to reconstruct NDVI time series with the Harmonic ANalysis of Time Series (HANTS) method. Remote Sensing, 13(21), Article 21. https://doi.org/10.3390/rs13214251
- Zhou, J., Jia, L., Menenti, M., van Hoek, M., Lu, J., Zheng, C., Wu, H., & Yuan, X. (2021). Characterizing vegetation response to rainfall at multiple temporal scales in the Sahel-Sudano-Guinean region using transfer function analysis. Remote Sensing of Environment, 252, 112108. https://doi.org/10.1016/j.rse.2020.112108
- Zhou, J., Jia, L., van Hoek, M., Menenti, M., Lu, J., & Hu, G. (2016). An optimization of parameter settings in HANTS for global NDVI time series reconstruction. In 2016 IEEE International Geoscience and Remote Sensing Symposium (IGARSS).(pp. 3422–3425). IEEE.
- Zhu, Z., Piao, S., Myneni, R. B., Huang, M., Zeng, Z., Canadell, J. G., Ciais, P., Sitch, S., Friedlingstein, P., Arneth, A., Cao, C., Cheng, L., Kato, E., Koven, C., Li, Y., Lian, X., Liu, Y., Liu, R., Mao, J., … Zeng, N. (2016). Greening of the earth and its drivers. Nature Climate Change, 6(8), 791–795. https://doi.org/10.1038/nclimate3004