
 ?Mathematical formulae have been encoded as MathML and are displayed in this HTML version using MathJax in order to improve their display. Uncheck the box to turn MathJax off. This feature requires Javascript. Click on a formula to zoom.
ABSTRACT
COVID-19 cripples the restaurant industry as a crucial socioeconomic sector that contributes immensely to the global economy. However, what the current literature less explored is to quantify the effect of COVID-19 on restaurant visitation and revenue at different spatial scales, as well as its relationship with the neighborhood characteristics of customers’ origins. Based on the Point of Interest (POI) measures derived from SafeGraph data providing mobility records of 45 million cell phone users in the US, our study takes Lower Manhattan, New York City, as the pilot study, and aims to examine 1) the change of restaurant visitations and revenue in the period prior to and after the COVID-19 outbreak, 2) the areas where restaurant customers live, and 3) the association between the neighborhood characteristics of these areas and lost customers. By doing so, we provide a geographic information system-based analytical framework integrating the big data mining, web crawling techniques, and spatial-economic modelling. Our analytical framework can be implemented to estimate the broader effect of COVID-19 on other industries and can be augmented in a financially monitoring manner in response to future pandemics or public emergencies.
1. Introduction
The outbreak of COVID-19 has caused economic damage in multiple industries and imposed negative impacts on economic growth in a long term. The hospitality and restaurant industry which relies on tourism, events, and eating meals out of homes is one of the most hard-hit sectors during the pandemic due to lockdown, stay-at-home orders, and other social restrictions implemented to limit human mobility (Gursoy & Chi, Citation2020). Estimating the effect of the COVID-19 pandemic on industries plays an important role for policy making and planning the post-pandemic economic recovery, although it is a tough task due to limited data availability. There is an urgent need to quantify the effect of COVID-19 on the restaurant industry as one of the most pandemic-affected industries.
Existing studies have investigated the influence of COVID-19 on the restaurant reservation and consumption (Peng & Chen, Citation2021), revenue loss at the country level (Nhamo et al., Citation2020) or at the company level (Song et al., Citation2021), restaurant viability (Gkoumas, Citation2021), restaurant operations (Brizek et al., Citation2021), and consumer’s risk perceptions about restaurant food and packaging (Byrd et al., Citation2021). These existing works are largely from the perspective of hospitality management, in reliance on qualitative investigation or survey-based analysis to reveal the nexus between the pandemic and restaurant industry. The analytics in these studies remain at a coarse level (e.g. country) or are subject to small-data issues such as under-representativeness and limited spatial and temporal coverage. What the current scholarship has less explored is to quantify how the restaurant industry has been affected by COVID-19 based on fine-level datasets with large spatial and temporal coverage which enable researchers to monitor restaurant visitations, the spatial and socioeconomic disparity of where customers reside, and the interrelationship among these measures.
To tackle this knowledge deficit, this study aims to establish a geographic information system (GIS)-based analytical framework to estimate the effect of COVID-19 on the restaurant industry via investigating the change of restaurant visitations in the period prior to and after the COVID-19 outbreak (1 January 2019 to 31 December 2020), the areas where restaurant customers live, and the association between the neighborhood characteristics of these areas and lost customers. This analytical framework integrates GIS-based statistical and modelling techniques drawing on multi-source data. We create an integral restaurant dataset containing 1) the Point of Interest (POI) data and human mobility data retrieved from SafeGraph that provides mobility records of 45 million mobile phone users in the US, 2) restaurant attributes crawled from Yelp, a commercial restaurant review website, and 3) demographic and socioeconomic data from the US Census Bureau. We test out this analytical framework empirically in Lower Manhattan, New York City, as the pilot study and reveal the generality and reproducibility of our analytical framework to estimate the broader effect of COVID-19 on other industries in response to future pandemics or public emergencies.
2. Facts from the literature
2.1. US restaurants in the context of COVID-19
In the US, the restaurant industry is one of the crucial socioeconomic sectors that contributes immensely to the national economy. Restaurants emerged from the Post-Second World War economic boom, providing not just food, goods and services but also consumption spaces to new demand for high-end amenities (Bocock, Citation2008). There are many types of restaurants in the US, ranging from commercial franchises and fast-food chain stores to individually/privately owned restaurants at different classes (e.g. take-out dominant restaurants or fine restaurants). In the process of urbanization and urban redevelopment, restaurants are also proposed as “cheap and quick” solutions to revitalize local economy and decaying urban areas, and provide employment opportunities to populations with low socioeconomic status (Small, Citation2017). In this sense, restaurants play different and important roles in the economy, society, and daily life of citizens.
Since the global outbreak of the COVID-19 pandemic in early 2020, the restaurant industry has become one of the hard-hit industries due to restriction policies that were implemented to limit human mobility (e.g. lockdown, stay-at-home orders, travel ban, and the closure of public transit) (Gursoy & Chi, Citation2020). In the US nationwide, the restaurant industry was estimated to furlough more than eight million employees and lost around $240 billion in the whole year of 2020 (Nhamo et al., Citation2020). There were limited studies in the current scholarship that attempted to evaluate the impact of COVID-19 on the restaurant industry. Nhamo et al. (Citation2020) employed data from OpenTable, an online restaurant reservation company, to evaluate the restaurant revenue loss at the country level (also including the US). Song et al. (Citation2021) used the publicly traded US restaurant firm data to estimate how restaurant firms’ pre-pandemic characteristics moderate the impact of COVID-19 shock on stock returns in the US restaurant industry. Peng and Chen (Citation2021) examined how consumers’ attachment to luxury restaurants and their emotional ambivalence contribute to the abandonment of restaurant reservations during the COVID-19 pandemic. Brizek et al. (Citation2021) conducted a survey about restaurant operations at the early stage of the pandemic by assessing perceptions and perspectives of independent full-service restaurant operators. Other studies (e.g. Byrd et al., Citation2021; Gkoumas, Citation2021) more focused on restaurant viability and consumer’s risk perceptions about restaurant food and packaging. However, these existing studies were largely in reliance on qualitative investigation or survey-based analysis to reveal the nexus between the pandemic and the behavior of restaurant consumption.
In addition, there were a few works providing quantitative evaluation on the effect of COVID-19 on the restaurant industry. For example, Banerjee et al. (Citation2021) revealed the significant differences in restaurant visits between rural and urban counties after shelter-at-home orders, drawing on SafeGraph’s core places dataset which provides visitation records to different types of points of interest in the US. Glaeser et al. (Citation2021) developed a model to predict how lifting stay-at-home orders affects the dine-out behaviour of customers, using restaurant activity data. However, these studies were either at a coarse level (e.g. Nhamo et al., Citation2020) or lacking evidence about the varying effect of COVID-19 on different types of restaurants and the change of restaurant customers (e.g. their origins). To provide concrete evidence for government and policymakers, it is much needed is to quantify how the restaurant industry has been affected by COVID-19 based on fine-level datasets with large spatial and temporal coverage which enable researchers to monitor restaurant visitations, the spatial and socioeconomic disparity of where customers reside, and the interrelationship among these measures – the objectives that our study aims to achieve.
2.2. Neighborhood characteristics of restaurant customers
Prior studies on restaurants and their customers have largely focused on the relationship between restaurant types and locations, food offerings, the personal characteristics of restaurant customers, and/or their neighborhood characteristics in terms of the demographic composition, socioeconomic status, and locations (e.g. Bagozzi et al., Citation2000; Hyun, Citation2009; Liang & Andris, Citation2021; Morland et al., Citation2002). In the particular domain of neighborhood characteristics related to restaurant visitations, there were some consensuses from the literature showing that lower income populations tend to be more likely to dine or order food from fast-food restaurants (Austin et al., Citation2005) or likely to live in food deserts (Beaulac et al., Citation2009). Chain restaurants were observed to appear more frequently in African American and low-income neighborhoods (Block et al., Citation2004). In contrast, high-income groups had a high percentage of visiting independent restaurants (Carroll & Torfason, Citation2011). Bowman et al. (Citation2004) contributed a nationwide evaluation showing that increased fast-food consumption was associated with factors such as gender, age, race/ethnicity (e.g. non-Hispanic black), and residential regions. Also, restaurants with cuisines from different countries were favored by different social/ethnic groups. For example, Chinese restaurants had higher proportion of customers as Chinese (Liu & Lin, Citation2009) and accordingly the location of Chinese restaurants were more likely to be close to Chinese communities. Referring to existing studies, we selected a number of neighborhood characteristics (e.g. age structure, ethnicity, education and income levels, employment, and household composition) to examine if the impact of COVID-19 on the customers’ origins varies across neighborhoods.
In addition to the demographic and socioeconomic characteristics of neighborhoods, working and transport modes that affect the access to restaurants are also relevant to restaurant visitations (Gkiotsalitis & Cats, Citation2021; Wen et al., Citation2022), especially after the outbreak of COVID-19—in the pandemic era fulfilled with policy implementations to change people’s working and travel modes. A number of studies on public health show that essential workers were more mobile than non-essential workers during the pandemic peak given they had to work onsite with the exemptions from COVID-19 policy (e.g. work-at-home orders) (Zhang et al., Citation2021). In addition, regional differences, reflected by the distance to city centers, can also influence restaurant visitations (Banerjee et al., Citation2021). Burgoine and Harrison (Citation2013) concluded that there are more food outlets and a wider variety of foods available in urban than in rural regions. Urban residents had a higher incidence of eating food away from home than rural residents given they had easier access to various restaurants (Dean & Sharkey, Citation2011). This highlights the importance of investigating the effect of COVID-19 differentially for restaurant customers’ origins – in both urban and rural regions with different distances away from city centers. With this regard, our study takes account of commuting and working modes (e.g. the percentage of people working at home, needing for short commute, with/without cars, and using public transit for commuting) and the location of neighborhoods (e.g. the distance from a customer’s origin to a city center) in the analysis to reveal the relationship between restaurant visitations and customers’ origins.
3. Data and methods
3.1. Study area
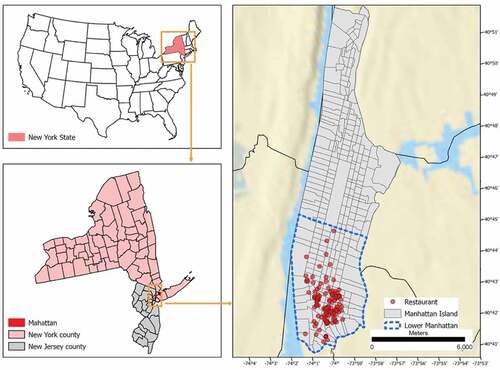
We took Lower Manhattan, New York City (), for a pilot study due to the technical and contextual reasons justified as below. New York City is highly populated and compact. It is a hard-hit frontier at the early stage of the pandemic (February to March 2020) that experienced rapid virus transmission and infection before the nationwide virus spread (Thompson et al., Citation2020). Lower Manhattan is the hard-core of New York City, where the world financial engine Wall Street is located and populated by high-rise office buildings, white-collar workers and commuters who are likely to be the customers of restaurants locally. It is also one of the major tourism destinations that attract a large influx of visitors that contribute to restaurant business before the pandemic. After the COVID-19 outbreak, lockdown and work-at-home orders, and dining-out restrictions had profound impacts on restaurant visitations and revenue although such impacts remain under-investigated. Thus, Lower Manhattan serves as a good contextual testbed for our proposed analytical framework. Another reason for limiting the study area to restaurant in Lower Manhattan is that the technical barrier existing in combining multi-source datasets (detailed in Section 3.2). We have to manually check the restaurant ID to merge multiple datasets for the analysis; it can be extended to all restaurants in the whole US once the technical barrier is overcome in future studies. It is worth noting that our target restaurants, as the destinations of restaurant visitations, are located in Lower Manhattan, NYC, while the origins of visitors spread out to all over the US. Thus, our analyses of the spatiotemporal patterns of the origins of visitors are multi-scale at the state, country, and tract level.
Figure 1. Study population of the restaurants located within Lower Manhattan, New York City.
3.2. GIS-based analytical framework
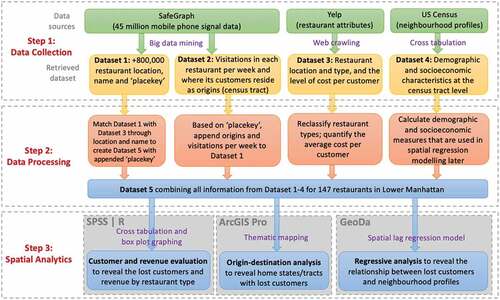
We constructed GIS-based analytical framework in a three-step procedure (). It commenced with data collection from three data sources to retrieve four datasets and then employed a range of data processing and manipulation to create an integral restaurant dataset to be used for ensuing data analysis. Then, three sets of spatial statistical analyses were conducted to estimate the change of restaurant customers and revenue, where lost customers reside, and how they associate with the local neighborhood characteristics.
Figure 2. GIS-based analytical framework for evaluating the impact of COVID-19 on the restaurant industry.
3.2.1. Step 1: data collection
We collected four datasets from multi-sources (Table S1). First, Dataset 1 contained the Point of Interest (POI) records retrieved from SafeGraph (Citation2020), a commercial dataset tracking 45 million consumers’ mobile devices with their consent. It uses GPS pings from different mobile applications to estimate foot traffic patterns, and provides daily visits to hundreds of thousands of points of interest in the US, including restaurants. SafeGraph has been widely used in COVID-19 related studies to unveil human mobility and place visitations (e.g. Huang et al., Citation2022; Kashem et al., Citation2021; Weill et al., Citation2020). Dataset 1 provided a restaurant list containing the unique identifier (“Placekey”), name and location (latitude and longitude) of total +800,000 restaurants, and other eating places defined in the North American Industry Classification System (North American Industry Classification System, Citation2021) with the NAICS code of 7225 in the US; among them, 240 restaurants were located in Lower Manhattan, New York City. All 240 restaurants remained open for business in 2020–2021 as their names appeared in both years (2019 and 2020) in the SafeGraph dataset. Second, based on the “Placekey” of 240 restaurants, we further retrieved origin-destination records (Dataset 2) from SafeGraph, containing information about the origin of customers as the home census tract (i.e. census tract “ID”), the number of visitations in a restaurant per week, and the month and year of such visitations (Li et al., Citation2021). It is worth noticing that SafeGraph only accounts for the visitations of a place if such a visitation lasts longer than 4 minutes. In other words, people coming to a restaurant to pick up take-away orders would be not accounted if the time staying in a restaurant is less than 4 minutes, neither for home deliveries – which may introduce some data bias that we would discuss in the ending section.
Third, we collected the attributes of restaurants (Dataset 3) from Yelp (www.yelp.com), one of the most popular customer-review websites in North America, providing the name of restaurants, its location (latitude and longitude), type (e.g. Chinese and Italian), and the average cost per customer (in the US dollar). Yelp data has been widely applied in the restaurant studies in the context of COVID-19 (e.g. Karniouchina et al., Citation2022; Kostromitina et al., Citation2021; Luo & Xu, Citation2021). To retrieve Yelp data, we defined the searching keywords as “Lower Manhattan” in the “Restaurant” category, resulting in 190 restaurants. Fourth, the demographic and socioeconomic characteristics at the census tract level (Dataset 4) were retrieved from the US Census Bureau (Citation2019), including the number of population and children, age, ethnicity, household income, family composition, car ownership, education, labor force status, occupation, and access to public transport. They were used as independent variables in the ensuing regression analysis.
3.2.2. Step 2: data processing and manipulating
We implemented a range of data manipulation to process the four datasets by locating the restaurants based on the X, Y coordinates collected from Yelp and matching up their locations and names from Dataset 1 and 3, consequently generating a final list of 147 restaurants in Lower Manhattan as our study population. Based on these 147 restaurants, Dataset 2 was filtered to 94,567 visitation records with 69,518 (75.5%) in 2019 and 25,049 (26.5%) in 2020. In Dataset 3, restaurant types originally provided by Yelp were arbitrary with mixed classifications based on food types, cuisine, and places; they were reclassified on the primary type (). In addition, the average cost per customer originally retrieved from Yelp was in a categorical form (e.g. ranging from $ ($5–15) to (above $60)) which had been further numericized as $10, 20, 45, and 60 in the calculation of revenue.
Table 1. Reclassification of restaurant types.
Furthermore, it is worth noting that if the number of visitations per week in a particular restaurant is 1, it would be dropped from SafeGraph due to privacy concern; if less than or equal to 4, it is recorded as 4 though it is likely to be 2, 3, or 4 in reality. To address this data bias, we generated randomized numbers (i.e. integers ranging from 2 to 4) proportionally through a curve estimation algorithm (see Supplementary Note 1 that contains Figure S1 and Table S2). This final restaurant dataset (Dataset 5) integrated all information from Dataset 1 to 4, including restaurant types and average costs per customer which enabled us to analyze the change of restaurant customers and revenue by restaurant type from 1 January 2019 to 31 December 2020.
3.2.3. Step 3: Spatial analytics
We conducted three sets of spatial statistical analyses at different spatial scales. First, we generated a statistical summary of restaurant customers and revenue by type at the national level via cross tabulation and box plotting. We also took account of the data representation that the sampling size of SafeGraph was based on the 10% of mobile devices in the US when calculating the lost customers and revenue that should be enlarged by ten times for more realistic estimates (SafeGraph, Citation2020). Second, an origin-destination analysis was employed to track the change of customers and revenue from 2019 to 2020 in their origins at both the state and county level. We also graphed the relationship between the number of lost customers and the distance between customers’ home states and Lower Manhattan, as well as mapped out the most popular restaurant in home counties (origins where restaurant customers reside).
Third, we employed an ordinary least squares (OLS) regression to test out the relationship between lost customers at the census tract level and the neighbourhood characteristics of home tracts (the origins where restaurant customers reside). OLS is a type of linear least squares method for estimating the unknown parameters in a linear regression model. OLS chooses the parameters of a linear function of a set of explanatory variables by the principle of least squares – minimizing the sum of the squares of the differences between the observed dependent variable (values of the variable being observed) in the given dataset and those predicted by the linear function of the independent variable. The OLS regression is written as:
where denotes the matrix containing a set of observed independent variables (i.e. demographic and socioeconomic characteristics of census tracts);
denotes the coefficient of the matrix
;
denotes the intercept;
denotes the error terms.
Based on the result of the OLS regression (see Supplementary Table S3), we check the spatial autocorrelation of the residuals generated by OLS. If the residuals are spatially autocorrelated, it means that the OLS model may not be reliable because of violating the assumption of OLS that independent variables should be indirectly related. Spatial autocorrelation is characterized by a correlation in a signal among nearby locations in space. Statistically, we utilized the Moran’s Index as a measure of spatial autocorrelation (technical details in Anselin et al. (Citation2010)). The value of Moran’s Index ranges from −1 (negative spatial autocorrelation) to +1 (positive spatial autocorrelation). In our analysis, the spatial autocorrelation report (Figure S2) generated in ArcGIS Pro 2.8 shows that the z-score is 46.412 and Moran’s Index is 0.028 with p-value as 0, indicating there is a strong spatial autocorrelation in the residuals generated by OLS and further revealing that there is a need to upgrade the OLS model to a spatial autoregressive model to avoid the bias caused by spatial autocorrelation of independent variables. Thus, we employed a spatial lag model as a typical type of spatial autoregressive model to optimize the modelling performance.
SLR is a linear spatial autoregressive regression model originated in spatial econometrics. SLR has the advantage of diminishing the data bias brought by the potential spatial autocorrelation of dependent and independent variables, revealing the spatial heterogeneity among variables, and avoiding unreliable significance tests (Anselin, Citation2009). It is also capable of providing location-specific parameter estimates at the regression points in a given spatial unit (Fotheringham et al., Citation2003). The parameter estimates are mappable to facilitate interpretation and to highlight spatial variation in the relationship between lost customers and neighborhood characteristics. SLR involves the construction of a spatial weight matrix, defined by setting up the first-order rook’s move contiguity (adjacent edges) and using the diagnostics from GeoDa to determine the most appropriate weight matrix (Anselin et al., Citation2010). In our SLR model, the dependent variable Y denotes the lost customers from 2019 to 2020 in each census tract, normalized by the total population (), based on the assumption that the propensity of people for dining out is similar across urban space and the count of restaurant customers in an area unit is propensity-controlled, proportionally associated with the total population of that area (Ali et al., Citation2019). Each of Y was considered as a spatial lag variable on the idea that the number of lost customers in one census tract was spatial autocorrelated with that in its neighbouring tracts (with a spatial-lag effect), given that nearby neighborhoods were more likely to be affected by the same COVID-19 restriction policies and/or to have similar demographic and socioeconomic characteristics that may relate to similar dietary habits (Cunha et al., Citation2010). Thus, the SLR model is specified as (Anselin et al., Citation2010):
where denotes the matrix containing a set of observed independent variables (i.e. demographic and socioeconomic characteristics of census tracts);
denotes the coefficient of the matrix
;
is the disturbance of spatial weight matrix of each dependent variable
defined in Eq. (2);
denotes the error terms;
denotes the spatial autoregressive structure of the spatial weight matrix;
(bold as a vector variable) denotes the spatial weight matrix of the dependent variable
, calculated as an inverse distance weighting in Eq. (4):
where denotes the distance between the centroid of spatial unit (i.e. a census tract)
and
;
is a positive exponent, typically
= 1.
We ran three SLR models for the combination of New York state and New Jersey state as a whole, and each of the two states, respectively, in GeoDa, an open-source GIS software (Anselin et al., Citation2010). The SLR results included a set of global coefficients as the mean of local coefficients in all census tracts to indicate the overall relationship between each dependent and independent variable (). The coefficients of independent variables were standardized to be comparable across different census tracts. The SLR results also provided a global R-square to indicate the overall model performance and a series of local R-squares in a given census tract to reveal the spatial variation of the relationships between lost customers and neighborhood characteristics.
Table 2. Dependent and independent variables used in the regression model.
4. Results
4.1. Change of restaurant customers and revenue from 2019 to 2020
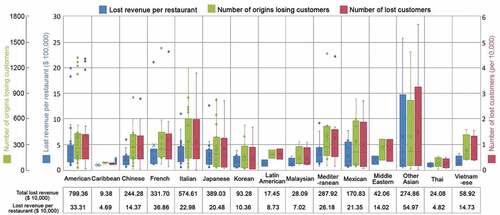
The number of lost customers and revenue from 2019 to 2020 by restaurant type are shown in . For the range of lost customers (correspondingly the range of origins where lost customers reside), it is largest in other Asian restaurants (including Burman, Laotian, and Indonesian restaurants), followed by Mexican, Italian, and Japanese restaurants. For the range of lost revenue per restaurant, it is again largest in other Asian restaurants, following by Mexican, Italian, Japanese, and American restaurants. However, for the total lost revenue (in the table underneath X-axis), American restaurants rank the top (loss of $7,993,600), followed by Italian ($5,746,100) and Japanese restaurants ($3,890,300). It is possibly due to American restaurants (a total of 24 in Lower Manhattan) being more than other restaurants. For the average lost revenue per restaurant, other Asian restaurants rank the top (the average loss of $549,700 per restaurant), followed by French ($368,600) and American restaurants ($333,100). It indicates the COVID-19 pandemic has a more severe impact on other Asian restaurants (including Burman, Laotian, and Indonesian restaurants), in terms of lost customers and the average lost revenue per restaurant, compared to the major Asian restaurants such as Chinese, Japanese, and Korean restaurants.
Figure 3. Lost customers and revenue from 2019 to 2020 by restaurant type.
4.2. Locales of lost customers and revenue by state and county
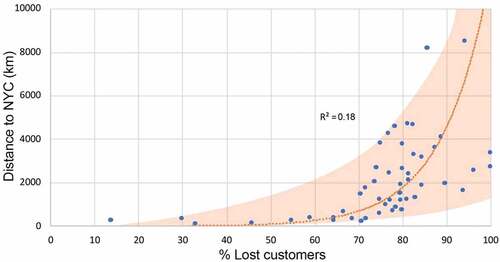
The spatial pattern of home states with the percentage of lost customers from 2019 to 2020 is revealed in . A number of states in the central and central-north US mainland (i.e. Wyoming, Nebraska, North Dakota, Montana, Idaho, Iowa, and Wisconsin) encounter the most obvious losses of customers above 87%. It is possible due to that these states locate far away from NYC with large areas in rural and natural landscape and relatively less population and have a smaller number of visitations to NYC restaurants before the pandemic. Social restriction policies implemented after the COVID-19 outbreak (e.g. cancellation of air flights) impede the human mobility in these statues that may lead to a substantial decrease of customers visiting NYC restaurants in 2020. Conversely, the states nearby NYC (i.e. New York, New Jersey, Vermont, Connecticut, Massachusetts, and Pennsylvania) have a relatively lower percentage of lost customers (less than 55%). The relationship between lost customers and the distance between states and NYC is graphed in . It has a clear exponential pattern revealing a distance-decay effect that a shorter distance from a state to NYC is associated with a lower percentage of lost customers. It is particular the case for the state of New York, New Jersey, and Connecticut, as indicated in , possibly explained by the fact that people living nearby or within NYC have easy access to restaurants in Lower Manhattan compared to those living in home states far away.
Figure 4. Home states with the percentage of lost customers from 2019 to 2020.
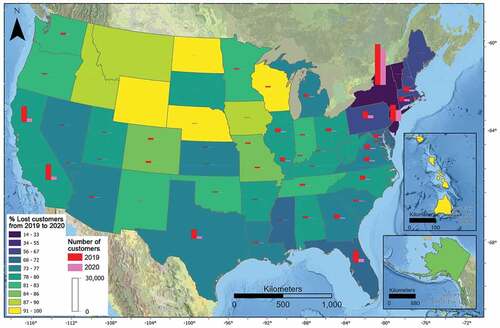
Figure 5. Relationship between lost customers and the distance of states to NYC.
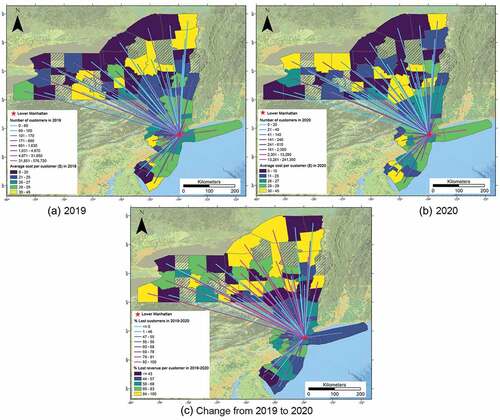
We further examine the percentage of lost customers and lost revenue in home counties with the top 20% visitations to NYC in both 2019 and 2020 and these counties are all located in New York and New Jersey (). It is clear that counties far away from NYC in the north of New York state have relatively a smaller number of customers in 2019 and 2020 (indicated as light blue lines in ) compared to the nearby counties with a larger number of customers (indicated as purple lines). However, the pattern in the percentage of lost customers varies across space (). Counties with less than 43% of lost revenue per customer (dark blue areas) are associated with lower percentages of lost customers (less than 55% indicated as light blue and blue lines) and such counties are populated and urbanized areas where medium- and small-sized cities (i.e. Albany, Syracuse, Rochester, and Buffalo) are located. In contrast, counties with higher lost revenue per customer (yellow areas) are associated with higher percentage of lost customers (purple lines) and such counties are remote and rural counties located in the north and west of New York.
Figure 6. (A) The number of customers and average costs per customer by county in 2019; (B) the number of customers and average costs per customer by county in 2020; (C) the percentage of lost customers and lost revenue per customer by county in 2019–2020. Note: This analysis focuses on the counties with the top 20% visitations in both 2019 and 2020 and these counties are all located in New York and New Jersey; dash-patterned areas ranking beyond the top 20% visitations are excluded.
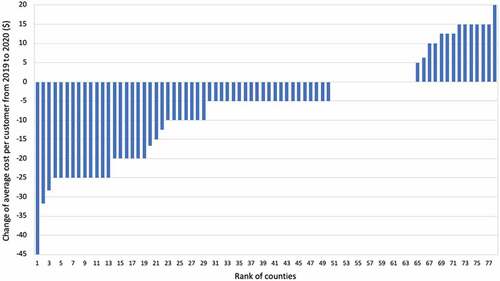
We mapped out the type of restaurants in Lower Manhattan most favored by each county (reflected by the largest number of visitations) in 2019 and 2020 (). There are 63 counties (80.7% out of the 78) that changed the favorite restaurant types from 2019 to 2020 (). Among these 63 counties, 51 counties (80.9%) spend less average cost per customer in their favorite restaurants (a decrease ranging from $5 to $45), reflecting the potential financial impact of COVID-19 on the restaurant consumption of population who may tend to spend less in dining outside. It may be also partially explained by the COVID-19 restriction policies that customers may change more toward restaurants with easy access for drive-in or take-out (e.g. American restaurants) which were usually cheaper than fine restaurants (e.g. French restaurants).
Figure 7. Top restaurants favored by each county in 2019 and 2020.
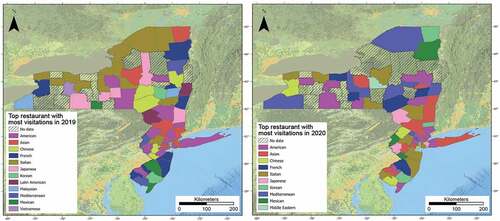
Figure 8. Change in the average cost per customer spent in the favorite restaurant by county from 2019 to 2020.
4.3. Relationship between lost customers with neighborhood characteristics
The standardized coefficients generated by the SLR model () indicate to what extent lost customers are associated with the demographic and socioeconomic characteristics of census tracts. In general, variables including the population density, distance, and the percentage of schoolers, low education, low income, short commute, and public transit commute are negatively (at least p < 0.05) associated with lost customers. It reflects that home tracts with larger proportions of schoolers and commuter by public transit tend to lose less customers visiting the restaurants in Lower Manhattan during the pandemic. It somehow implies that COVID-19 restriction policies (e.g. school closure and the temporary closure of public transit) may impede human mobility during the pandemic peak but have limited impacts on restaurant visitations in the yearly basis. What is beyond our expectation is that areas with a lower socioeconomic status (e.g. the concentration of low-educated and low-income population) tend to lose less customers visiting the restaurants. It could be possible that essential workers, usually with a lower socioeconomic status, had the exemptions from the COVID-19 restriction policies even during the pandemic peak and need to work onsite regularly with freedom for dining outside.
Table 3. SLR modelling results.
In contrast, home tracts with higher proportions of elderly, white population, households with children and without cars and people working at home tend to lose more customers (p < 0.05). It is partially because unemployed people who may have financial concerns or who may largely stay at home without going outside for jobs tend to dine outside less frequently during the pandemic. Moreover, households without cars might have difficulties to travel to restaurants in NYC. It might also be explained by the implementation of lockdown and home-dwelling orders that keep more people stay at home, in particular, the elderly in face of higher risk of infection and people working at home who may have less intent to go outside. When breaking down to different states, the relationship between the preceding variables and lost customers remains consistent in home tracts in New York while slightly inconsistent in New Jersey. More specifically, the discrepancies between New Jersey and New York lie in the fact that the percentage of white insignificantly associated with lost customers in New York become significant in New Jersey (coefficient = 0.135, p < 0.01). But the percentage of unemployed and households without cars significantly associated with lost customers in New York become insignificant in New Jersey. It reflects that the spatial heterogeneity exists in the interrelationship between lost customers and neighbourhood characteristics and further reveals the diverse impact of COVID-19 on restaurant visitations and the shift of dining-out behaviours.
5. Discussion and conclusion
Our study constructs a GIS-based analytical framework to quantify and evaluate the impact of COVID-19 on the restaurant industry that can be extended to other industries. This analytical framework consists of big data mining and web crawling techniques, and GIS-based analytics to create and analyze an integral restaurant dataset in a given study area. Taking 147 restaurants in Lower Manhattan, NYC as the pilot study, we find that the COVID-19 pandemic has a more severe impact on other Asian restaurants (e.g. Burman, Laotian, and Indonesian restaurants) in terms of lost customers and average lost revenue per restaurant compared to the major Asian restaurants (e.g. Chinese, Japanese, and Korean), European restaurants (e.g. Italian and French), American and Latin American restaurants. There is a distance–decay relationship between lost customers and locales where customers reside. Home states or counties with shorter distances to NYC are associated with lower percentages of lost customers. Comparably, people living within NYC or areas nearby NYC in New York, New Jersey, and Connecticut have relatively easy access to restaurants in Lower Manhattan and thus are subject to weaker influence by the pandemic on their restaurant visitations. There also exists a potential financial impact of COVID-19 on people’s average consumption on restaurants, and they tend to spend less in dining in restaurants during the pandemic. Moreover, the interrelationship between lost customers and neighbourhood characteristics varies across space, further revealing the diverse impact of COVID-19 on restaurant visitations and the shift of dining-out behaviours.
Our findings and analytical framework advance the current knowledge in the field of industrial evaluation, hospitality management, and policy making in a number of ways. First, our analytical framework for evaluating the impact of COVID-19 on the restaurant industry can be implemented to other industries and be developed as parts of economic initiatives in response to future pandemics or public emergencies. The POI data derived from SafeGraph contain multiple types of places including green parks and national parks, supermarkets, pharmacies, transport stations, liquor stores, to name a few (SafeGraph, Citation2020). By following our analytical framework, further efforts can be made to estimate the effect of COVID-19 on a particular industry based on the visitation to avenues in that industry. It also has great potentials to be extended to a nationwide evaluation of the restaurant industry during the pandemic in the US, based on the nationwide records of +800,000 restaurants. Second, while existing research also examined restaurant visits using SafeGraph data (e.g. Banerjee et al., Citation2021), our analytical framework enables the estimation of lost revenues across different types of restaurants, by integrating SafeGraph data with Yelp data. Our findings are at various spatial scales that can be used for policy making in governments at different levels. Third, our findings enrich the existing qualitative studies that dominantly focus on hospitality management (e.g. Brizek et al., Citation2021; Byrd et al., Citation2021; Gkoumas, Citation2021; Nhamo et al., Citation2020; Peng & Chen, Citation2021; Song et al., Citation2021) with quantifiable and mappable measures in terms of lost restaurant customers and revenue, and the locales where lost most customers and revenue. These spatial explicit measures can be adopted by end-users with specific purposes.
Our study provides empirical evidence for designating effective strategies and economic recovery initiatives in the post-lockdown era. For local government officers (e.g. a town supervisor), they may be especially interested to know how the restaurants in the local districts of their charge have been affected by the COVID-19 pandemic. While such information could be collected via surveys with the restaurant owners, such a process requires a considerable amount of financial and labor resources that may not be available to the local district after the hard hit of the pandemic. Even when such resources are available, restaurant owners may not be able to accurately memorize the number of customers or estimate the revenue loss. Our analytical framework, therefore, provides a possible solution for local government officers to better understand and estimate the negative impact of COVID-19 on local restaurants with a lower cost of resources and time. Such impact estimations can then support the development of suitable financial programs to subsidize the affected restaurants. In addition, our analytical framework can also provide information on the general regions where the customers of a restaurant come. Such geographic information could be distributed to restaurant owners to help them decide where to put new advertisements to help attract their customers back during the recovery process.
There are several limitations in our study that can be further improved by future efforts to extend our findings. First, given the privacy concerns, the tract-level records with weekly visitation below four have been roughly assigned as four (see Step 2 in Section 3.2). We have to rectify these records by generating randomized numbers via a curve estimation (i.e. integers ranging from 2 to 4) to reduce the data bias caused by the fuzzy records. Despite that the estimated visitation counts might not perfectly comply with restaurant visitation patterns in the real world, such a tailored, data-driven randomization process allows us to approximate real restaurant visitation patterns in a reasonable manner. Future efforts can be made to explore other data sources in order to accurately capture the POI visitation patterns of places with low visitation records. However, extra caution needs to be exercised to avoid the potential violation of users’ privacy during data retrieval and processing. Second, we aim to explain the loss of restaurant visitations in NYC by selecting a total of 13 explanatory variables from demographic, socioeconomic, and travel behavioural perspectives. Although it has been observed that there are strong relationships between these variables and restaurant visitations, we cannot rule out the possible contribution of other factors that are not included in this study. Future studies are encouraged to incorporate more explanatory variables and extend the study area to a larger spatial scale (e.g. the whole US territory). Furthermore, it is suggested to select uncorrelated factors to reduce the potential concern of multicollinearity, for example, by involving a principal component analysis for variable dimensional reduction purposes. Furthermore, future studies could utilize different types of models (e.g. more advanced spatial models or machine learning models) to examine the relationship between restaurant visitations and neighbourhood profiles of customers’ origins. Third, the POI dataset we used only documents the physical visitations of restaurants based on the criterion that a visitation would only be accounted if the duration of that visit to a given POI lasted at least 4 minutes. It somehow fails to consider restaurant delivery services and take-out services that last shorter than 4 minutes, which may be supplemented by running a survey or questionnaire to roughly estimate the ratio of dine-in and take-out that can be further used to improve the data accuracy.
To conclude, we constructed a GIS-based analytical framework integrating the big data mining, web crawling techniques, and spatial-economic modelling to estimate the broader effect of COVID-19 on the restaurant industry. It has great potentials to be applied to evaluate the effect of COVID-19 on other industries and extended to other geographic contexts for combating the resurge of COVID-19 in the post-pandemic era. We call for researchers, government officials, policymakers, urban planners, and public and private authorities to employ our analytical framework for prevention and control of future virus outbreaks and public health emergencies arising from the increasing level of globalisation, urbanisation, and the human invasion of ecosystems.
Supplemental Material
Download MS Word (246.1 KB)Acknowledgments
The authors would like to thank SafeGraph Inc. for permitting access to various SafeGraph datasets including the restaurant visitations in weekly patterns; the authors would also thank the effort made by Dr Yingjie Hu from the Department of Geography, University at Buffalo for editing, commenting and improving the quality of this article.
Disclosure statement
No potential conflict of interest was reported by the authors.
Data availability statement
All data are publicly available that can be retrieved from the sources as below: 1) point of interest records from SafeGraph (Citation2020) (https://www.safegraph.com/products/places); 2) origin-destination restaurant visitation records from SafeGraph (Citation2020) (https://docs.safegraph.com/docs/monthly-patterns); 3) attributes of restaurants from Yelp (Citation2020) (https://www.yelp.com/dataset); 4) census data from US Census Bureau (Citation2019) (https://www.census.gov/programs-surveys/acs/news/updates/2019.html). Data processing and analytical modelling were conducted in ArcGIS Pro 2.8.
Supplementary material
Supplemental data for this article can be accessed online at https://doi.org/10.1080/20964471.2022.2163130.
Additional information
Funding
Notes on contributors

Siqin Wang
Siqin Wang is a research fellow funded by Japan Society of Promotion of Sciences from Graduate School of Interdisciplinary Information Studies, University of Tokyo, Japan. She is also an honorary research fellow from School of Earth and Environmental Sciences, University of Queensland, Brisbane, Australia. Her research interest is applying GIS-based framework and skills integrating big data analytics and geoinformatics in computational social science and urban studies, particularly in the domain of human migration and mobility, digital health geography, built environment, social vulnerability, and broad human-environment interactions.

Ruomei Wang
Ruomei Wang was a Master student graduated from School of Earth and Environmental Sciences, University of Queensland, Brisbane, Australia. Her research interest is geospatial analysis, socioeconomic data analysis, carbon neutral pathway planning, and wind resources assessment.

Xiao Huang
Xiao Huang received his Ph.D. degree in Geography from the University of South Carolina in 2020. He is a faculty member (Assistant Professor) in the Department of Geosciences, and the Center for Advanced Spatial Technologies (CAST) at the University of Arkansas with his expertise in GeoAI, deep learning, big data, remote sensing, and social sensing. His teaching interests encompass undergraduate and graduate courses that involve geospatial analysis, data mining, geovisualization, and natural hazards.

Zhenlong Li
Zhenlong Li is an Associate Professor in the Department of Geography and Director of the Center for GIScience and Geospatial Big Data (CeGIS) at the University of South Carolina (USC), where he established and leads the Geoinformation and Big Data Research Laboratory (GIBD). Dr. Li is recognized as a Breakthrough Star by USC in 2020 and selected as one of the Geospatial World 50 Rising Stars by the Geospatial Media and Communications in 2021. He is also a Peter and Bonnie McCausland Faculty Fellow (2020–2023) at the USC College of Arts and Sciences. Dr. Li’s primary research field is GIScience with a focus on geospatial big data analytics, high performance spatial computing, and GeoAI/CyberGIS with applications to disaster management, public health, human dynamics, and climate analysis.

Shuming Bao
Shuming Bao received his Ph.D. in applied economics from Clemson University. He is currently the director of the China Data Institute in the US, and the co-director of the Geocomputation Center for Social Sciences at Wuhan University. He was a faculty member and the director of the China Data Center at the University of Michigan in Ann Arbor before he started the China Data Institute in 2018. Dr. Bao has published more than 90 papers in the areas of GIS, regional economics, and spatial data analysis.
References
- Ali, F., Harris, K. J., & Ryu, K. (2019). Consumers’ return intentions towards a restaurant with foodborne illness outbreaks: Differences across restaurant type and consumers’ dining frequency. Food Control, 98, 424–430. https://doi.org/10.1016/j.foodcont.2018.12.001
- Anselin, L. (2009). Spatial regression. The SAGE Handbook of Spatial Analysis, 1, 255–276.
- Anselin, L., Syabri, I., & Kho, Y. (2010). GeoDa: An introduction to spatial data analysis. In L. Anselin, I. Syabri & Y. Kho (Eds.), Handbook of applied spatial analysis (pp. 73–89). Springer.
- Austin, S. B., Melly, S. J., Sanchez, B. N., Patel, A., Buka, S., & Gortmaker, S. L. (2005). Clustering of fast-food restaurants around schools: A novel application of spatial statistics to the study of food environments. American Journal of Public Health, 95(9), 1575–1581. https://doi.org/10.2105/AJPH.2004.056341
- Bagozzi, R. P., Wong, N., Abe, S., & Bergami, M. (2000). Cultural and situational contingencies and the theory of reasoned action: Application to fast food restaurant consumption. Journal of Consumer Psychology, 9(2), 97–106. https://doi.org/10.1207/S15327663JCP0902_4
- Banerjee, T., Nayak, A., & Zhao, H. (2021). A county-level study of the effects of state-mandated COVID-19 lockdowns on urban and rural restaurant visits using consumers’ cell phone geo-location data. Journal of Public Health, 1–10. https://doi.org/10.1007/s10389-020-01473-y
- Beaulac, J., Kristjansson, E., & Cummins, S. (2009). A systematic review of food deserts. Preventing Chronic Disease, 6(3), A105.
- Block, J. P., Scribner, R. A., & Desalvo, K. B. (2004). Fast food, race/ethnicity, and income: A geographic analysis. American Journal of Preventive Medicine, 27(3), 211–217. https://doi.org/10.1016/S0749-3797(04)00139-4
- Bocock, D. R. (2008). Consumption. Routledge.
- Bowman, S. A., Gortmaker, S. L., Ebbeling, C. B., Pereira, M. A., & Ludwig, D. S. (2004). Effects of fast-food consumption on energy intake and diet quality among children in a national household survey. Pediatrics, 113(1), 112–118. https://doi.org/10.1542/peds.113.1.112
- Brizek, M. G., Frash, R. E., McLeod, B. M., & Patience, M. O. (2021). Independent restaurant operator perspectives in the wake of the COVID-19 pandemic. International Journal of Hospitality Management, 93, 102766. https://doi.org/10.1016/j.ijhm.2020.102766
- Burgoine, T., & Harrison, F. (2013). Comparing the accuracy of two secondary food environment data sources in the UK across socio-economic and urban/rural divides. International Journal of Health Geographics, 12(1), 1–8. https://doi.org/10.1186/1476-072X-12-2
- Byrd, K., Her, E., Fan, A., Almanza, B., Liu, Y., & Leitch, S. (2021). Restaurants and COVID-19: What are consumers’ risk perceptions about restaurant food and its packaging during the pandemic? International Journal of Hospitality Management, 94, 102821. https://doi.org/10.1016/j.ijhm.2020.102821
- Carroll, G. R., & Torfason, M. T. (2011). Restaurant organizational forms and community in the U.S. in 2005. City & Community, 10(1), 1–24. https://doi.org/10.1111/j.1540-6040.2010.01350.x
- Cunha, D. B., de Almeida, R. M. V. R., Sichieri, R., & Pereira, R. A. (2010). Association of dietary patterns with BMI and waist circumference in a low-income neighbourhood in Brazil. The British Journal of Nutrition, 104(6), 908–913. https://doi.org/10.1017/S0007114510001479
- Dean, W. R., & Sharkey, J. R. (2011). Rural and urban differences in the associations between characteristics of the community food environment and fruit and vegetable intake. Journal of Nutrition Education and Behavior, 43(6), 426–433. https://doi.org/10.1016/j.jneb.2010.07.001
- Fotheringham, A. S., Brunsdon, C., & Charlton, M. (2003). Geographically weighted regression: The analysis of spatially varying relationships. John Wiley & Sons.
- Gkiotsalitis, K., & Cats, O. (2021). Public transport planning adaption under the COVID-19 pandemic crisis: Literature review of research needs and directions. Transport Reviews, 41(3), 374–392. https://doi.org/10.1080/01441647.2020.1857886
- Gkoumas, A. (2021). Developing an indicative model for preserving restaurant viability during the COVID-19 crisis. Tourism and Hospitality Research, 22(1), 18–31. https://doi.org/10.1177/1467358421998057
- Glaeser, E. L., Jin, G. Z., Leyden, B. T., & Luca, M. (2021). Learning from deregulation: The asymmetric impact of lockdown and reopening on risky behavior during COVID‐19. Journal of Regional Science, 61(4), 696–709. https://doi.org/10.1111/jors.12539
- Gursoy, D., & Chi, C. G. (2020). Effects of COVID-19 pandemic on hospitality industry: Review of the current situations and a research agenda. Journal of Hospitality Marketing & Management, 29(5), 527–529. https://doi.org/10.1080/19368623.2020.1788231
- Huang, X., Lu, J., Gao, S., Wang, S., Liu, Z., & Wei, H. (2022). Staying at home is a privilege: Evidence from fine-grained mobile phone location data in the United States during the COVID-19 pandemic. Annals of the American Association of Geographers, 112(1), 286–305. https://doi.org/10.1080/24694452.2021.1904819
- Hyun, S. S. (2009). Creating a model of customer equity for chain restaurant brand formation. International Journal of Hospitality Management, 28(4), 529–539. https://doi.org/10.1016/j.ijhm.2009.02.006
- Karniouchina, K., Sarangee, K., Theokary, C., & Kübler, R. (2022). The Impact of the COVID-19 Pandemic on Restaurant Resilience: Lessons, Generalizations, and Ideas for Future Research. Service Science.
- Kashem, S. B., Baker, D. M., González, S. R., & Lee, C. A. (2021). Exploring the nexus between social vulnerability, built environment, and the prevalence of COVID-19: A case study of Chicago. Sustainable Cities and Society, 75, 103261. https://doi.org/10.1016/j.scs.2021.103261
- Kostromitina, M., Keller, D., Cavusoglu, M., & Beloin, K. (2021). “His lack of a mask ruined everything.” Restaurant customer satisfaction during the COVID-19 outbreak: An analysis of Yelp review texts and star-ratings. International Journal of Hospitality Management, 98, 103048. https://doi.org/10.1016/j.ijhm.2021.103048
- Liang, X., & Andris, C. (2021). Measuring McCities: Landscapes of chain and independent restaurants in the United States. Environment and Planning B: Urban Analytics and City Science, 49(2), 23998083211014896. https://doi.org/10.1177/23998083211014896
- Li, Z., Huang, X., Hu, T., Ning, H., Ye, X., Huang, B., Li, X., & Yang, C. (2021). ODT FLOW: Extracting, analyzing, and sharing multi-source multi-scale human mobility. PLoS One, 16(8), e0255259. https://doi.org/10.1371/journal.pone.0255259
- Liu, H., & Lin, L. (2009). Food, culinary identity, and transnational culture: Chinese restaurant business in Southern California. Journal of Asian American Studies, 12(2), 135–162. https://doi.org/10.1353/jaas.0.0039
- Luo, Y., & Xu, X. (2021). Comparative study of deep learning models for analyzing online restaurant reviews in the era of the COVID-19 pandemic. International Journal of Hospitality Management, 94, 102849. https://doi.org/10.1016/j.ijhm.2020.102849
- Morland, K., Wing, S., Roux, A. D., & Poole, C. (2002). Neighborhood characteristics associated with the location of food stores and food service places. American Journal of Preventive Medicine, 22(1), 23–29. https://doi.org/10.1016/S0749-3797(01)00403-2
- Nhamo, G., Dube, K., & Chikodzi, D. (2020). Restaurants and COVID-19: A focus on sustainability and recovery pathways. In G. Nhamo , K. Dube & D. Chikodzi (Eds.), Counting the cost of COVID-19 on the global tourism industry (pp. 205–224). Springer. https://link.springer.com/book/10.1007/978-3-030-56231-1
- North American Industry Classification System. (2021). NAICS Code Search. Available at: https://www.naics.com/
- Peng, N., & Chen, A. (2021). Consumers’ luxury restaurant reservation session abandonment behavior during the COVID-19 pandemic: The influence of luxury restaurant attachment, emotional ambivalence, and luxury consumption goals. International Journal of Hospitality Management, 94, 102891. https://doi.org/10.1016/j.ijhm.2021.102891
- SafeGraph. (2020). U.S. Consumer Activity During COVID-19 Pandemic. Available at: https://www.safegraph.com
- Small, A. (2017) How fast food concerned the urban market. Available at: www.citylab.com/life/2017/03/how-fast-food-chains-cornered-the-urban-market/521148/(accessed 20 May 2022).
- Song, H. J., Yeon, J., & Lee, S. (2021). Impact of the COVID-19 pandemic: Evidence from the U.S. restaurant industry. International Journal of Hospitality Management, 92, 102702. https://doi.org/10.1016/j.ijhm.2020.102702
- Thompson, C. N., Baumgartner, J., Pichardo, C., Toro, B., Li, L., Arciuolo, R., Fine, A. … Fine, A. (2020). COVID-19 Outbreak—New York City, February 29–June 1, 2020. Morbidity and Mortality Weekly Report, 69(46), 1725. https://doi.org/10.15585/mmwr.mm6946a2
- US Census Bureau. (2019). Population estimates in 2019. Available at: https://www.census.gov/topics/population.html
- Weill, J. A., Stigler, M., Deschenes, O., & Springborn, M. R. (2020). Social distancing responses to COVID-19 emergency declarations strongly differentiated by income. Proceedings of the National Academy of Sciences, 117(33), 19658–19660. https://doi.org/10.1073/pnas.2009412117
- Wen, L., Sheng, M., & Sharp, B. (2022). The impact of COVID-19 on changes in community mobility and variation in transport modes. New Zealand Economic Papers, 56(1), 98–105. https://doi.org/10.1080/00779954.2020.1870536
- Yelp. (2020). Available at: https://www.yelp.com/
- Zhang, M., Gurung, A., Anglewicz, P., & Yun, K. (2021). COVID-19 and immigrant essential workers: Bhutanese and Burmese refugees in the United States. Public Health Reports, 136(1), 117–123. https://doi.org/10.1177/0033354920971720