
ABSTRACT
Quantitative assessment of community resilience can provide support for hazard mitigation, disaster risk reduction, disaster relief, and long-term sustainable development. Traditional resilience assessment tools are mostly theory-driven and lack empirical validation, which impedes scientific understanding of community resilience and practical decision-making of resilience improvement. In the advent of the Big Data Era, the increasing data availability and advances in computing and modeling techniques offer new opportunities to understand, measure, and promote community resilience. This article provides a comprehensive review of the definitions of community resilience, along with the traditional and emerging data and methods of quantitative resilience measurement. The theoretical bases, modeling principles, advantages, and disadvantages of the methods are discussed. Finally, we point out research avenues to overcome the existing challenges and develop robust methods to measure and promote community resilience. This article establishes guidance for scientists to further advance disaster research and for planners and policymakers to design actionable tools to develop sustainable and resilient communities.
1. Introduction
Due to climate change and rapid population growth in hazard-prone areas, human communities are increasingly confronted with the escalating threats of natural disasters, entailing significant socio-economic consequences. These disasters arise from both rapid-moving large-scale disturbances such as hurricanes and storm surges, as well as slow-moving processes such as coastal erosion, sea level rise (Nicholls et al., Citation1999), and the decline of ecosystem services (Spalding et al., Citation2014; Tebaldi et al., Citation2012). The devastating impacts of Hurricane Katrina and Rita in the Central Gulf Coast in 2005 have spurred heightened attention toward the resilience and long-term sustainability of human communities. Empirical evidence reveals that, even when exposed to the similar hazard intensities, communities exhibit varying degrees of impacts and diverse recovery patterns across socio-economic conditions (Finch et al., Citation2010; Fussell et al., Citation2010), public health (Burton, Citation2006), and psychological well-being (Adeola, Citation2009). These observed disparities can be attributed to the capacity of communities to “bounce back” from adverse conditions, commonly known as community resilience.
The quantitative measurement of community resilience has gained considerable attention in recent years (e.g. Cutter et al., Citation2010; Lam et al., Citation2016; Peacock, Citation2010) due to its provision of a structured and standardized approach for assessing and comparing resilience levels across different communities, regions, or time periods. Through rigorous statistical modeling, quantitative resilience measurements allow researchers to identify significant factors and relationships that shape community resilience, empowering evidence-based decision-making for policymakers and practitioners regarding the effectiveness of resilience-building interventions. Despite advancements in resilience research, challenges persist in quantitative resilience measurements. First, no consensus exists on the definition of resilience. Various definitions and conceptual frameworks adopted in different disciplines lead to diverse assessment methods, which often produce inconsistent or even contradictory outcomes. Second, existing resilience assessment tools are predominantly theory-driven, lacking empirical validation and ground-truthing. Finally, our understanding of the mechanisms underlying community resilience remains limited. Without knowing the underlying factors and their interplay, it is difficult to develop effective measures and actionable tools to promote community resilience.
In recent years, community resilience research has been revolutionized by the advancements in data acquisition and computing techniques. The concept of Big Earth Data (BED) emerges when the vision of Digital Earth entered into the era of Big Data (Guo et al., Citation2017). BED is defined as big data about the earth system obtained through earth observation means such as spaceborne, airborne, and ground sensors (Guo et al., Citation2016). In the recent literature, BED is more broadly defined as data about the Earth’s environment and human-environment interactions collected by cutting-edge technologies, including but not limited to in-situ sensor network, Web 2.0, mobile devices, citizen science, internet-of-things and social sensing contributed by human beings (Guo et al., Citation2017; Sudmanns et al., Citation2020; Yang et al., Citation2019). The convergence of BED and artificial intelligence (AI) has opened exciting new possibilities for studying and building community resilience. These emerging data sources and technologies offer real-time or near-real-time disaster monitoring capabilities, social sensing capabilities, and data-driven decision-making tools. Leveraging these tools and insights from BED has deepened our understanding of community resilience and holds tremendous potential for developing robust resilience measurements and decision-making tools.
Despite the rapid development of data-driven resilience measurement, there is limited discussion on the theoretical foundations, modeling principles, and the advantages and disadvantages of various resilience measurement approaches. To this end, this article aims to comprehensively review the definitions, conceptual frameworks, and quantitative measurement approaches of community resilience. Differentiated from existing review work on resilience measurements, this article sheds light on the recent progress of data-driven approaches on resilience measurements. Special attention will be paid to the use of emerging BED to address the pressing challenges in resilience research. The goals of the article are synthesizing existing research, identifying knowledge gaps, and providing guidance for future research directions.
2. Definitions of resilience
The concept of resilience has been widely explored in the literature; however, there is still a lack of consensus within the scientific community regarding its definition and conceptual framework. Holling (Citation1973) initially introduced the concept of resilience, characterizing it as the capacity of an ecological system to endure change amidst severe perturbations, while still maintaining its continued existence. In social sciences, Timmerman (Citation1981) proposed resilience as inherent conditions of a system that enable it to absorb and rebound from catastrophic events. Adger et al. (Citation2005) adopted a holistic perspective on resilience, defining it as the capacities of linked social-ecological systems for absorbing recurrent disturbances, self-organization, learning and adaptation. Cutter et al. (Citation2008) further refined this concept, asserting that community resilience encompasses not only the inherent conditions of a system to cope with threats, but also post-event, adaptive processes that facilitate the system to re-organize, change, and learn in response to such threats. Unlike engineered systems where resilience can be gauged using specific performance metrics, community resilience is complex and multifaceted, making it challenging to precisely quantify using observable indicators. Moreover, community resilience is dependent on complex human-environment interactions (Janssen et al., Citation2006), and it is a dynamic process involving adaptive learning and feedback loops. Unlike engineered systems where resilience can be gauged using specific performance metrics, resilience of human communities is inherently complex and multifaceted, and cannot be precisely quantified from observable indicators. Moreover, community resilience intricately reflects complex human-environment interactions in external stressors (Janssen et al., Citation2006) and is a dynamic process involving adaptive learning and feedback loops in coupled natural and human (CNH) systems (Lam et al., Citation2018, Citation2018).
Despite the extensive discussions in the literature, the scientific community has yet to reach a consensus on the definition and components of community resilience. Different disciplines adopt varying definitions and conceptual frameworks, shaping researchers’ understanding and interpretation of community resilience. An extensive literature synthesis conducted by Cai et al. (Citation2018), which analyzed 174 scholarly articles on resilience, reveals diverse attempts across disciplines, such as environmental science, geography, health, and civil engineering, to define resilience in the context of different hazards like floods, earthquakes, and climate change. More recently, the US National Institute of Standards and Technology (NIST) has created an inventory that documents 56 community resilience frameworks and assessment tools (Dillard, Citation2021; Walpole et al., Citation2021). These two synthetic studies reveal that regardless of the disciplines, study areas, and disaster types, the common words in defining resilience include anticipate, resist, absorb, response, recovery, self-organization, learning, adaptive capacity, indicating a shared understanding of resilience.
The interdisciplinary views of resilience also sparked the debate whether resilience should be considered as an outcome or a process, resulting in diverse frameworks for measuring resilience (Finch et al., Citation2010; McPhearson, Citation2014). From a process perspective, resilience refers to the capacity of a system or entity to adapt, respond, and recover from disturbances or shocks. This view focuses on the dynamic and ongoing process of learning, adaptation, and transformation that occur to bounce back from adversity. Due to its abstract nature and complex interrelationships, measuring the process of resilience often involves a combination of theoretical or even hypothetical indicators that capture various aspects of adaptive capacity, learning, social dynamics, and decision-making processes. On the other hand, resilience can also be viewed as an outcome or a state achieved after a disruption. In this view, resilience represents the ability to withstand and recover from shocks, maintain essential functions, and return to a desired state. The outcome of resilience can be measured by tangible indicators that demonstrate the successful recovery and restoration of a system. These divergent views of resilience further impede the standardization of the methods to measure and enhance community resilience.
3. Traditional measurement methods
Considerable research has been conducted to develop quantitative metrics to measure community resilience. Currently, the resilience measurements can be generally categorized as “top-down” and “bottom-up” approaches. The top-down measurements are constructed through established theories, predefined indicators, and expert opinions. As a typical example of the top-down approach, resilience indices compose measurable indicators that can represent intrinsic resilience characteristics. In contrast, the “bottom-up” measurements are built on empirical observations of socio-economic consequences in real disaster events. In other words, the resilience indices reflect the process view of resilience, while the empirical approaches use resilience outcomes to measure resilience and its relations with underlying processes. In this section, we categorize the resilience measurement methods as the index approaches (top-down) and empirical approaches (bottom-up).
3.1. The index approach
The development of indices for measuring and monitoring disaster resilience is the first fundamental step toward enhancing resilience. Resilience indices provide easily accessible, practical, and timely information to aid decision-making in disaster preparedness, response, and recovery. The synthesis analysis conducted by Cai et al. (Citation2018) revealed that 45% of the reviewed 174 articled have attempted to create quantitative resilience indices. Among the quantitative measurement methods employed, statistical and data mining techniques were the most commonly used, including correlation analysis, principal component analysis (PCA), multivariate regression, and clustering analysis. The primary data sources include census data, questionnaire surveys, interviews, fieldwork observations, and historical disaster records (Dillard, Citation2021; Walpole et al., Citation2021).
One widely used approach for resilience assessment is the creation of composite indices that synthesize socio-economic and environmental indicators. As the earliest and most cited resilience index, the Baseline Resilience Indicators for Communities (BRIC) aggregates a number of baseline indicators in different dimensions into an overall score (Cutter et al., Citation2010). As shown in , the BRIC index comprises a common set of variables in six different domains (i.e. social, economic, housing and infrastructure, institutional, community, and environmental). Initially, a sub-index is constructed for each capital by transforming the raw variables within the domain to a scale from 0 to 1 and assigning their positive or negative contributions to resilience. The sub-index scores are then aggregated using an equally weighted average method to calculate the final composite resilience score. Similarly, the Community Disaster Resilience Index (CDRI) categorizes resilience indicators into a 4 × 4 matrix of capital domains (i.e. the social, economic, physical, and human capital) and disaster phases (i.e. the mitigation, preparedness, response and recovery phase). These indicators are then aggregated to an overall index (Peacock, Citation2010). Other resilience indices, such as those proposed by Foster (Citation2012), Hung et al. (Citation2016), and Sherrieb et al. (Citation2010), employ various indicators, weighting schemes, and aggregation methods. Socio-economic indicators used in resilience indices are often derived from official data sources such as census data. A related method is scorecard, which applies qualitative methods to assess resilience-related items, actions or capacities (e.g. CARRI, Citation2013; Sempier et al., Citation2010). These resilience indices and scores provide essential baseline information regarding community resilience and its geographical disparities and temporal evolution.
Table 1. Components, indicators, data sources, pros and cons of well-known resilience indices including Baseline Resilience Indicators for Communities (BRIC), Community Disaster Resilience Index (CDRI), the Index of Community Resilience (ICR), and Climatic Hazard Resilience Indicators for Localities (CHRIL).
However, despite the multitude of efforts in creating resilience indices, a rigorous and universally accepted index for monitoring resilience enhancement progress remains elusive due to several limitations in existing methods. First, the weighting schemes used to aggregate resilience indicators into a composite index lack empirical validation and ground-truthing (Bakkensen et al., Citation2017; Cai et al., Citation2018). Second, there is an inconsistency in variable selection across different studies, and a lack of consensus on indicator selection across regions and disaster types, resulting in inconsistent resilience quantification outcomes (Beccari, Citation2016; Cutter, Citation2016). In addition, most existing measurement methods have no inferential capacity to predict resilience in other regions or under future scenarios. provides a summary of the common resilience indices in terms of their indicators, data sources, pros and cons.
3.2. Empirical approaches
Despite the wide use of indices and scorecards in resilience measurements, it remains unclear how well these scores and indices can explain disaster outcomes (Rufat et al., Citation2019). Recently, efforts have been made to validate the established resilience measurements with empirical data. A common method to validate resilience is comparing the resilience index with empirical data of disaster outcomes. Traditional methods of empirical data collection include questionnaire surveys, interviews, and observation of focus groups. For instance, Burton (Citation2015) used field surveys about the recovery process in coastal Mississippi after Hurricane Katrina to validate common indicators in resilience indices. This study identified 41 out of the 64 indicators being statistically associated with the recovery process, thereby enabling empirical validated indicator selection and resilience measurements. Additionally, Ji et al. (Citation2021) validates nine common resilient indicators with household surveys. Their results reveal that only a few of the indicators are empirically valid for explaining households’ resilience capacities. Bakkensen et al. (Citation2017) compared several well-known resilience and vulnerability indices with disaster outcomes such as fatalities, property damages and disaster declarations. Their study shows that the indices produce inconsistent results and are in different relations with the disaster outcomes. Another widely used validation method is to compare the developed resilience index with the established indices to prove the efficacy of the index. For example, Sherrieb et al. (Citation2010) and Scherzer et al. (Citation2019) compared their resilience indices with established vulnerability indices to evaluate the robustness of their indices. All these studies point out that the validation of the resilience indices is an essential step before applications in real-world decision-making processes.
In addition to validation, a growing number of studies incorporate empirical data in deriving or calibrating resilience measurements. As an example, Lam et al. (Citation2009) used repeated telephone and field surveys to study business recovery in New Orleans after Hurricane Katrina. The disparate recovery rates are used to differentiate resilience among communities. Analogously, Harte et al. (Citation2009) used field surveys to analyze communities’ response and recovery to fire hazards in Cape Town, South Africa, which are used to imply community resilience. Furthermore, the RIM model defines that resilience includes three elements (exposure, damage, and recovery) and two relationships (vulnerability and adaptability) (), assuming that a resilient community can resist damage and maintain a speedy population recovery after experiencing a high number of disasters (Cai et al., Citation2016; Lam et al., Citation2016). Using official databases (e.g. census data and hazard loss data), the elements and relations can be measured in administrative units, resulting in quantitative scores of community resilience.
Figure 1. The conceptual framework of the resilience inference model (RIM) (modified from Lam et al. (Citation2016)).
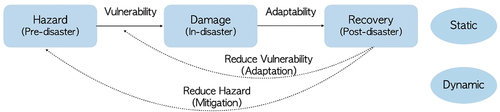
In these empirical approaches, community resilience is evaluated from empirical data observed in disasters, and thus overcome subjective indicator selection and weighting in the index approach. Moreover, these methods use observed disaster outcomes (e.g. recovery, fatalities, and damage) to validate or calibrate the indicators and models of resilience measurements. Although these studies create valuable insights into community resilience, some of data collection methods (e.g. surveys and interviews) are time-consuming, and thus the resultant analyses only cover small geographic areas. Studies relying on official data sources (e.g. census data) lack timeliness and cannot continuously monitor various community functions during a disaster process. These challenges hamper the development of comprehensive measurements to capture the dynamic and complexity of resilience.
4. Resilience measurement using Big Earth Data
With the advent of the big data era, geospatial data capturing human behaviors, environmental changes, and urban dynamics, are collected from various platforms at an unprecedented speed and scale. During hazardous events, Big Earth Data collected before, during, and after disasters creates empirical evidence for the theory-based assessments and provides novel insights to community resilience. In addition to the increasing data availability, advances in computing and machine learning techniques facilitate the transition from big data to actionable information and knowledge. As one of the four “Vs” (velocity, volume, variety and veracity) that characterize Big Data (Gandomi & Haider, Citation2015), the velocity of BED enables real-time or near-real-time monitoring of human dynamics at fine spatial and temporal resolutions. The velocity of BED proves particularly valuable during the preparedness, response, and recovery phases of a disaster, where situations rapidly evolve and data collection poses challenges. In the preparedness phase, BED data has been used in identifying risks and communicating preparedness and warning information (Anson et al., Citation2017), estimating disaster-related public awareness and sentiment in the preparedness phase (Zou et al., Citation2019). In response phase, BED is applied to analyze situational awareness (Huang & Xiao, Citation2015; Vongkusolkit & Huang, Citation2021), assess damage (Guan & Chen, Citation2014), identify evacuation routes (Chae et al., Citation2014), and rescue requests (Zhou et al., Citation2022; Zou et al., Citation2023). In the recovery phase, BED data can be used to track recovery curves of various community functions (Hong et al., Citation2021; Qiang et al., Citation2020; Yabe et al., Citation2022). Metrics derived from the recovery curves, such as maximum loss, total loss, and recovery speed, can be associated with intrinsic community characteristics (), creating empirically-based models to measure and predict resilience. Meanwhile, the social sensing capacities of volunteer geographic information (VGI), crowdsourced data, and social media data allow us to better observe human dynamics that cannot be observed by traditional data sources. This section will epitomize the pathways to understanding and measuring community resilience through various types of BED, including data from remote sensors (i.e., remote sensing and streetview images), data from socialsensors (i.e., social media and citizen science data), and human mobility data.
Figure 2. Conceptual framework of recovery curve.
4.1. Data from physical sensors
4.1.1. Remote sensing images
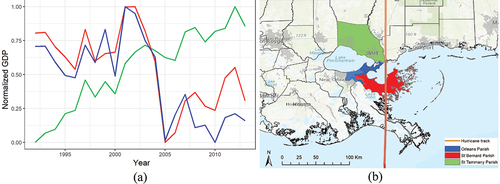
Remote sensing (RS) technologies play a crucial role in disaster management by providing valuable insights and aiding decision-making processes. RS images collected from a variety of sensors enable the rapid assessment of affected areas (Joyce et al., Citation2009), facilitating the identification of damaged infrastructures (Cooner et al., Citation2016; Dong & Shan, Citation2013), the extent of flooding (Bates, Citation2004; Peng et al., Citation2021), and providing support for the search and rescue of victims (Bevington et al., Citation2012). This information helps emergency responders prioritize their efforts, allocate resources efficiently, and plan evacuation routes. In resilience research, time series of RS images are often used to detect or assess the condition of objects that signalize disaster impacts and recovery of human communities and infrastructures. As an example, Brown et al. (Citation2010) utilized time series of very high resolution (VHR) images to detect key features (e.g. functioning roads, shelters, and shrimp ponds) at different time points to infer community recovery. Similarly, Bevington et al. (Citation2012) applies VHR images to monitor the temporal change of temporary shelters at multiple time points in the affected areas to evaluate post-disaster community recovery. Recently, Qiang et al. (Citation2020) utilized annual NTL images to analyze long-term economic disturbance and recovery before, during and after Hurricane Katrina in 2005 (). This study builds a model to estimate county-level Gross Domestic Product (GDP) from NTL radiance observed in RS images, and then uses time-series of RS images to construct economic recovery curves. Specifically, three metrics were calculated from the economic recovery curves, including maximum disturbance, recovery rate, and accumulated loss (also known as Area Under the Curve or AUC). These metrics are then associated with environmental and socio-economic conditions to understand the underlying factors that cause the different recovery patterns. Later, Xu and Qiang (Citation2021) used daily NTL images to detect short-term human dynamics in 2012 Hurricane Sandy. These studies reveal the spatial variation of recovery curves of community functions, reflecting differential resilience between rural and urban communities and communities with various socio-economic conditions.
Figure 3. GDP trajectories estimated from nighttime light in Hurricane Katrina (Qiang et al., Citation2020).
4.1.2. Street view images
In parallel to remote sensing imagery, street view imageries (SVIs) have emerged as a potent instrument for resilience assessment. SVIs in resilience research are primarily derived from web map platforms such as Bing Maps and Google Maps. SVIs at a higher frequency can be collected via systematically organized field trips (Burton et al., Citation2011; Meyer & Hendricks, Citation2018). In contrast to the top-down view of remote sensing imageries, SVIs provide street-level, horizontal views of the environment at an extremely high resolution, thereby offering distinct viewpoints on building and infrastructure damages (Zhai & Peng, Citation2020; Zou et al., Citation2022). Moreover, time series of SVIs can be used to track the post-disaster recovery (Burton et al., Citation2011), rebuilding (Curtis & Mills, Citation2012), and communities resettlement over time (Mabon, Citation2016).
4.2. Data from social sensors
4.2.1. Social media data
Most existing resilience indices are derived from sociodemographic data collected at regular time intervals, such as data from census and health agencies. However, these traditional data sources are only available at coarse spatial and temporal resolutions and do not provide detailed information about communities’ preparedness levels, actual impacts, responses, and recovery behaviors during a disaster management process, which reflects communities’ empirical resilience capacities. As a typical product in Web 2.0, social media has started to play an imperative role in information communication during disasters, offering a novel pathway to observing community behaviors and impacts and, thus, evaluating community resilience. Specifically, an increasing number of people have turned to social media to receive the latest disaster information and communicate with friends and rescue teams to prepare for, respond to, and recover from disasters. Meanwhile, social media users can act as intelligent sensors that collect information about their local disaster situation and impacts and share it in their social networks. Therefore, a growing number of studies have incorporated social media data in surveilling communities’ behaviors and damages during disasters to measure and enhance community resilience in recent years.
To compare the geographical disparities of social media usage and its applications in understanding and measuring disaster resilience, the first step is to geolocate social media data. Previous efforts commonly used three attributes to associate social media data with locations: geotags, user profiles, and message content (Lin et al., Citation2022). With the popularity of GPS-enabled mobile devices, social media users can geotag their messages with coordinates of points or places obtained from GPS. Those geotagged locations are considered the ground truth of where users sending social media messages are and, in specific scenarios, indicate where those messages are associated. Due to their high spatial accuracy and resolution, geotagged data are poised for fine-scale individual- or neighborhood-level analysis. An investigation calculated that around 1.5% of disaster-related messages are geotagged (Zou et al., Citation2019). In the absence of geo-tags, user locations can be predicted through addresses in user profiles. Many social media platforms allow users to fill in addresses when registering for their accounts. Those addresses can approximate user locations with their spatial scales ranging from a point to a country. User profile locations are suitable for large-scale, community-based (e.g. city or county level) analysis of user behaviors, as around 55% of social media data can be correctly associated with a city based on addresses in user profiles (Graham et al., Citation2014). Alternatively, addresses mentioned in social media content can be used. When people request rescue, share local disaster impacts and conditions, or discuss disaster events on social media, they usually mention locations in their messages (Zou et al., Citation2023). Those message-mentioned locations can be extracted and converted to points or polygons through processes of toponym recognition and toponym resolution (Wang et al., Citation2020). Recent investigations have developed deep learning-based models to identify toponyms from social media texts and achieved state-of-the-art performance (Zhou et al., Citation2023).
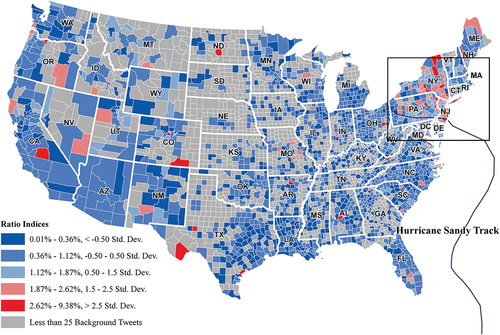
The geolocated social media data allow us to uncover geographic disparities in people’s perceptions, opinions, experiences, and behaviors throughout disaster management cycles, which cannot be captured in traditional data sources. Such information can increase our understanding of community resilience and potentially provide real-time support for disaster management. For instance, analyzing social media data can uncover spatial and temporal patterns of situational awareness in disasters and their relationships with community resilience (Huang & Xiao, Citation2015; Yu et al., Citation2019). Zou et al. (Citation2018, Citation2019) analyze the spatial-temporal patterns of Twitter activities during Hurricane Sandy and Harvey. As depicted in , when Hurricane Sandy landed in the U.S., Twitter users’ situational awareness of Hurricane Sandy was the highest, while their sentiment toward this event was the lowest. Concurrently, communities displaying a high discussion intensity were clustered in the northeastern United States, which was in the vicinity of the track of Hurricane Sandy and suffered more damage (). The analysis revealed significant social and geographical disparities in Twitter use in both events. Communities having better social and geographical conditions tend to use Twitter to communicate disaster information more often than socially and geographically disadvantaged groups. Also, studies show that Twitter data can estimate disaster damage, which is the outcome of community resilience. Drawing from examples such as Hurricanes Sandy in 2012, Matthew in 2016, and Harvey in 2017, several studies have found strong correlations between disaster-related Twitter activities, i.e. disaster-related discussion intensity and sentiment, and economic losses across multiple spatial and temporal scales (Kryvasheyeu et al., Citation2016; Mihunov et al., Citation2022; Yuan & Liu, Citation2020). Besides, social media can reveal discrepancies in crisis responses among different social groups. Yuan et al. (Citation2021) employed Twitter data to compare the crisis response in different demographic groups during Hurricane Florence. The results indicated that the Hispanic group was more likely to express negative sentiment than the Asian, African American, and white groups. Meanwhile, the male group revealed more negative sentiments than the female group. Using topic modeling, the prevalent topics in different population groups are identified. Most recently, a study examined if the social and geographical disparities in disaster-related social media use affect communities’ resilience to disasters (Wang et al., Citation2021). Through analyzing Twitter data during the 2012 Hurricane Isaac, the results imply that social media use during disasters could be improved to increase the resilience of affected communities.
Figure 4. The ratio and average sentiment of tweets related to Hurricane Sandy in the U.S.
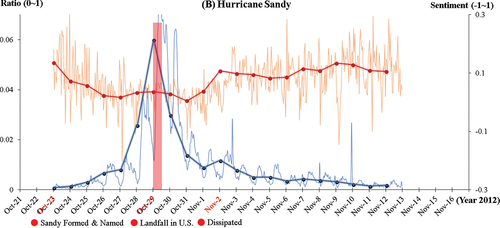
Figure 5. The county-level ratio of Sandy-related tweets in the contiguous U.S. (Zou et al., Citation2018).
4.2.2. VGI and citizen science data
Volunteered geographic information (VGI) and citizen science data also play an important role in disaster management. Arising with the advent of Web 2.0, these data types embody the concept of “citizen as sensors”, engaging public users to gather disaster-related information that proves vital for emergency response and relief efforts. Various web portals (Dixon et al., Citation2021; Ludwig et al., Citation2015; Naik, Citation2016; Pánek et al., Citation2017) and mobile apps (Hendricks et al., Citation2018; Wang et al., Citation2018; Yabut et al., Citation2017) have been designed to gather data from citizens regarding hazard extents, property or infrastructure damages, and recovery processes from citizen users in various disaster scenarios. However, unlike social media which are primarily used for social networking and communication, the VGI and citizen science platforms are designed to collect data of specific phenomena. The collection of VGI and citizen science data involved substantial groundwork to engage or incentivize users to submit specialized data through the platforms. Consequently, the quality of the VGI and citizen data science is usually higher than social media data that needs to be mined from a massive amount of irrelevant data. In addition to providing data about disaster resilience, the VGI and citizen science platforms can facilitate community engagement, information sharing, and social cohesion – all integral components that fortify community resilience.
4.3. Human mobility data
Human mobility data refers to information about the movement of people captured through location tracking devices such as GPS signals, connections to WiFi networks, credit card transactions, and other means. In disaster events, human mobility patterns can reflect disaster impacts on and recovery of human behaviors, social activities, and infrastructure conditions, which are central indicators of urban systems’ functionality before, during, and after a disaster. Thus, the dynamics of human mobility in disasters are proxies for understanding and assessing community resilience. With the popularity of mobile devices, anonymized human mobility data is becoming increasingly available. The most commonly used human mobility data are (1) mobile phone or GPS tracking data; (2) geotagged social media data (e.g. Twitter and Weibo); (3) and other digital footprints such as credit card transactions, bus rides, e-bike rentals, and rideshare (Haraguchi et al., Citation2022). The dynamics of human mobility detected from these data reflect hazard impacts to and the recovery of human communities. For example, Hong et al. (Citation2021) utilized mobile phone tracking data to analyze neighborhood-level evacuation and recovery patterns during Hurricane Harvey. This study uses recovery curves of human mobility during the hurricane to measure community resilience, and then associates the resilience with socio-economic variables. Using a similar approach, several invetigations (Wang et al., Citation2014, Citation2016) leveraged geotagged tweets to compare population movement trajectories in different phases of natural disasters as proxies to evaluate human mobility resilience. Qiang and Xu (Citation2020) used traffic data from Google Maps to monitor the dynamics of accessibility in a road network during a winter storm (). By utilizing the recovery curves of accessibility, it becomes possible to evaluate the resilience of the road network across various locations. Yuan et al. (Citation2022) applied credit card transactions to analyze disaster impacts on community residents, businesses, and infrastructure systems, as well as their recovery patterns. Deng et al. (Citation2021) collected 30 million GPS records from around 150,000 unique, anonymous users to study the evacuation patterns of Houston residents during the 2017 Hurricane Harvey. By computing the evacuation rates and distances, the research uncovers the disparity in evacuation tendencies between disadvantaged minority populations and more affluent residents. The study also highlights the strong social cohesion exhibited in the destination selections of evacuees from more privileged neighborhoods. Moreover, Yabe et al. (Citation2020) employed human mobility data from SafeGraph in a Bayesian causal inference framework to quantitatively assess the economic impact of disasters on businesses. Finally, summarizes the characteristics of various types of BED applied in disaster resilience research.
Figure 6. Recovery of accessibility to critical facilities in Winter Storm Harper (Qiang & Xu, Citation2020): (a) recovery curves of accessibility in census tracts and (b) resilience scores of the road network in census tracts.
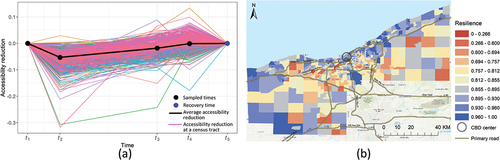
Table 2. Various types of Big Earth Data (BED) applied in disaster resilience research.
5. Challenges and future directions
Despite the great potential of BED in disaster resilience research, there are several challenges that warrant attention in future research.
First, the veracity of Big Data presents uncertainties for data-driven resilience analysis. BED data collected from diverse sources can be noisy, incomplete, or biased, which may result in flawed insights and erroneous conclusions in resilience analysis. As an example, social media data (e.g. Twitter data) is often criticized for the biased user demography and the existence of misinformation and fake news. To address these issues, numerous solutions have been proposed and tested. For example (Lin et al., Citation2023), utilized an AI-based M3 model to decipher the demographic information of social media users and revealed the demographic bias of social media data. Further, they applied the post-stratification method to mitigate the demographic biases when computing indices from social media data. Fake news can be detected through knowledge-based, style-based, stance-based, and propagation-based algorithms (Shu et al., Citation2017). Monti et al. (Citation2019) proposed a geometric deep learning approach to detect fake news on social media. The recent breakthrough in large language models (e.g. ChatGPT) can improve the detection accuracy of disaster information from social media data and translate the detected information into meaningful resilience indicators (Hu et al., Citation2023). Moreover, promoting social media use in underrepresented population groups is critical for developing equitable and inclusive resilience measurements for diverse communities (Mihunov et al., Citation2020; Wang et al., Citation2021).
Second, as a fundamental issue in geography, the effect of scale also exists in resilience research. Due to data availability, most resilience indices were derived at a single spatial scale (e.g. census tracts, counties, or states). The validity of these indices in guiding decision-making across different scales is uncertain. Moreover, resilience indicators that are validated at a specific scale might not be applicable at varying spatial levels (Song et al., Citation2020). In additional to the spatial scale, the appropriate time window to measure resilience raises several critical questions: (1) Does resilience implies rapid response and recovery from a single disaster or the sustainability over multiple or compound disasters in a longer-term perspective? (2) How do short-term resilience and long-term resilience differ in their driving factors? (3) Do we need different strategies to enhance community resilience across spatial and temporal scales? Considering these scale-related issues, it is crucial for future resilience measurement frameworks to account for multi-scale variations of resilience indicators and mechanisms. This approach will enable effective decision-making across different administrative levels and timeframes.
Third, a majority of current studies depend on a single data source and measurement approach, restricting the analytical scale and breadth of insights into community resilience. In forthcoming research, advanced data fusion and artificial intelligence (AI) methods should be embraced to amplify and synergize the strengths of diverse data types. For example, the integration of multi-source remote sensing data can effectively improve disaster monitoring and impact assessment (Li et al., Citation2021). Furthermore, social media data and mobile phone tracking data can complement each other by combining semantic information with precise locational data of population movements (Xing et al., Citation2021). In light of the progress in AI algorithms and growing availability of data for the algorithm training, the fusion of multi-source BED offers promising prospects for the development of more robust and comprehensive resilience measures.
Finally, most resilience research focuses on correlations instead of causalities. However, the correlations detected in statistical analysis do not necessarily indicate actionable levers that can effectively promote community resilience. To develop useful planning and policy-making tools, advanced modeling techniques should be applied to quantify the dynamic interrelations and feedback loops among resilience factors. Recently, there is a growing interest in leveraging the power of citizen science and Community-Based Participatory Research (CBPR) to engage communities in the resilience assessment process. Local knowledge from communities and stakeholders can contribute to the construction and validation of resilience assessment tools. Aided with VGI and data crowdsourcing tools, these bottom-up approaches can collect ground-truth data to quantify causal linkages between resilience indicators and disaster outcomes, offering practical support for resilience-related decision-making.
6. Conclusions
This article presents a comprehensive review of quantitative resilience measurement approaches, focusing particularly on the latest research leveraging Big Earth Data (BED). By synthesizing diverse studies using various types of BED, this article identifies the fundamental issues in resilience measurements, highlights the opportunities and challenges of BED brought to resilience research, and outlines future research avenues to address the challenges. Overall, the synergy between BED and advanced modeling techniques holds the potential to bring about a paradigm shift in community resilience assessment. This synergy enables evidence-based decision-making and fosters the development of actionable tools and strategies to enhance community resilience. The BED’s capacity to observe human dynamics at unprecedented spatio-temporal granularities establishes linkages between disaster outcomes with intrinsic resilience characteristics, providing evidence-based resilience measurements. On the one hand, the BED-based resilience assessments overcome the issues of arbitrary indicator selection, weighting, and lack of empirical validation in the traditional resilience measurements. On the other hand, the timely and scalable data acquisition provide support for rapid impact assessment and real-time monitoring of socio-economic disturbances and recovery processes. Moreover, BED’s capacity for social sensing introduces novel perspectives into understanding socio-economic processes influencing community resilience, which are often unobservable through conventional data sources. Looking forward, the BED-based resilience measurements are poised to integrate AI and data fusion techniques to create multi-dimensional, empirically validated, scale-specific, and equitable measurements and strategies for promoting community resilience.
Disclosure statement
No potential conflict of interest was reported by the author(s).
Additional information
Funding
Notes on contributors

Yi Qiang
Yi Qiang is an Associate Professor and the Graduate Director for the Geography, Environmental Science and Policy programs at the School of Geosciences, University of South Florida. He holds a Ph.D. in Geography from Ghent University, MS in GIScience from University of Edinburgh, BS in GIS from Beijing Normal University. His primary research areas are in GIScience and spatial data science, with focuses on spatio-temporal modeling, geovisualization, disaster management, and coupled natural and human (CNH) systems. Dr. Qiang lead the Laboratory of Computational Spatial Science for Sustainability (COMPASS Lab, https://www.compasslab.info/) at University of South Florida. His current projects cover topics on multi-scale spatio-temporal data modeling, community resilience assessment, sustainable agriculture, and climate/disaster-driven human migration. His research projects are funded by NSF, USDA, NOAA, and Florida DEP.

Lei Zou
Lei Zou is an Assistant Professor in the Department of Geography at Texas A&M University, directing the Geospatial Exploration and Resolution (GEAR) Lab (https://www.geoearlab.com/). He received his Ph.D. in Environmental Sciences from Louisiana State University in 2017. His research focus is fostering a healthy, resilient, and sustainable future for human communities amidst changing climates and environments through spatial and responsible thinking, novel big data, AI-supported methods, interdisciplinary collaboration, and community outreach. He spearheads over 20 interdisciplinary projects and has published over 60 articles in academic journals and conference proceedings and as book chapters. Meanwhile, he serves as the vice chair for the International Cartographic Association Commission on Geospatial Analysis and Modeling (ICA-GAM), the vice chair for the Geographic Information Sciences & Systems Group at the American Association of Geographers (AAG-GISS), a board director of the U.S. Cartography and Geographic Information Society (CaGIS), and an editorial board member of the International Journal of Digital Earth.

Heng Cai
Heng Cai is an Assistant Professor in the Department of Geography at Texas A&M University. She received her Ph.D. in Environmental Sciences from Louisiana State University in 2017. Her research primarily focuses on geographic information science, disaster resilience, socio-environmental sustainability, and environmental health. Dr. Cai leads the GIScience for Resilience (GIResilience) Research Group (https://www.gis-resilience.info), in which her team investigates human activities and environmental changes, and their complex interactions under the threats posed by recurrent natural hazards and persistent climate changes through geospatial data mining, modeling, and decision-making support tool development.
References
- Adeola, F. O. (2009). Mental health & psychosocial distress sequelae of Katrina: An empirical study of survivors. Human Ecology Review, 16(2), 195–210.
- Adger, W. N., Hughes, T. P., Folke, C., Carpenter, S. R., & Rockström, J. (2005). Social-ecological resilience to coastal disasters. Science, 309(5737), 1036–1039. https://doi.org/10.1126/science.1112122
- Anson, S., Watson, H., Wadhwa, K., & Metz, K. (2017). Analysing social media data for disaster preparedness: Understanding the opportunities and barriers faced by humanitarian actors. International Journal of Disaster Risk Reduction, 21, 131–139. https://doi.org/10.1016/j.ijdrr.2016.11.014
- Bakkensen, L. A., Fox‐Lent, C., Read, L. K., & Linkov, I. (2017). Validating resilience and vulnerability indices in the context of natural disasters. Risk Analysis, 37(5), 982–1004. https://doi.org/10.1111/risa.12677
- Bates, P. D. (2004). Remote sensing and flood inundation modelling. Hydrological Processes, 18(13), 2593–2597. https://doi.org/10.1002/hyp.5649
- Beccari, B. (2016). A comparative analysis of disaster Risk, vulnerability and resilience composite indicators. PLOS Currents Disasters. https://doi.org/10.1371/currents.dis.453df025e34b682e9737f95070f9b970
- Bevington, J. S., Hill, A. A., Davidson, R. A., Chang, S. E., Vicini, A., Adams, B. J., & Eguchi, R. T. (2012). Measuring, monitoring, and Evaluating post-disaster recovery: A key element in understanding community resilience. 2033–2043. https://doi.org/10.1061/41171(401)177
- Brown, D. M., Platt, S., Bevington, J., Saito, K., Adams, B., Chenvidyakarn, T., Spence, R., Ratana, C., & Khan, A. (2010). Monitoring and Evaluating post-disaster recovery using high-resolution satellite imagery – towards standardised indicators for post-disaster recovery. https://www.semanticscholar.org/paper/Monitoring-and-Evaluating-Post-Disaster-Recovery-%E2%80%93-Brown-Platt/b43229bd5a5e9fb85d562ee98c5e4768cef75c05
- Burton, A. (2006). Health disparities: Crisis not over for hurricane victims. Environmental Health Perspectives, 114(8), A462. https://doi.org/10.1289/ehp.114-a462
- Burton, C. G. (2015). A validation of metrics for community resilience to natural hazards and disasters using the recovery from Hurricane Katrina as a case study. Annals of the Association of American Geographers, 105(1), 67–86. https://doi.org/10.1080/00045608.2014.960039
- Burton, C., Mitchell, J. T., & Cutter, S. L. (2011). Evaluating post-Katrina recovery in Mississippi using repeat photography. Disasters, 35(3), 488–509. https://doi.org/10.1111/j.1467-7717.2010.01227.x
- Cai, H., Lam, N. S. N., Qiang, Y., Zou, L., Correll, R. M., & Mihunov, V. (2018). A synthesis of disaster resilience measurement methods and indices. International Journal of Disaster Risk Reduction, 31, 844–855. https://doi.org/10.1016/j.ijdrr.2018.07.015
- Cai, H., Lam, N. S.-N., Zou, L., Qiang, Y., & Li, K. (2016). Assessing community resilience to coastal hazards in the Lower Mississippi River Basin. Water, 8(46), 1–18. https://doi.org/10.3390/w8020046
- CARRI. (2013). Building resilience in America’s communities: Observations and implications of the CRS pilots (community & regional resilience (CARRI) Report). https://merid.org/case-study/community-and-regional-resilience-institute/wp-content/uploads/2013/05/CRS-Final-Report.pdf
- Chae, J., Thom, D., Jang, Y., Kim, S., Ertl, T., & Ebert, D. S. (2014). Public behavior response analysis in disaster events utilizing visual analytics of microblog data. Computers & Graphics, 38, 51–60. https://doi.org/10.1016/j.cag.2013.10.008
- Cooner, A. J., Shao, Y., & Campbell, J. B. (2016). Detection of urban damage using Remote sensing and machine learning algorithms: Revisiting the 2010 Haiti earthquake. Remote Sensing, 8(10), 868. Article 10. https://doi.org/10.3390/rs8100868
- Curtis, A., & Mills, J. W. (2012). Spatial video data collection in a post-disaster landscape: The Tuscaloosa Tornado of April 27th 2011. Applied Geography, 32(2), 393–400. https://doi.org/10.1016/j.apgeog.2011.06.002
- Cutter, S. L. (2016). The landscape of disaster resilience indicators in the USA. Natural Hazards, 80(2), 741–758. https://doi.org/10.1007/s11069-015-1993-2
- Cutter, S. L., Ash, K. D., & Emrich, C. T. (2014). The geographies of community disaster resilience. Global Environmental Change, 29, 65–77. https://doi.org/10.1016/j.gloenvcha.2014.08.005
- Cutter, S. L., Barnes, L., Berry, M., Burton, C., Evans, E., Tate, E., & Webb, J. (2008). A place-based model for understanding community resilience to natural disasters. Global Environmental Change, 18(4), 598–606. https://doi.org/10.1016/j.gloenvcha.2008.07.013
- Cutter, S. L., Burton, C. G., & Emrich, C. T. (2010). Disaster resilience indicators for benchmarking baseline conditions. Journal of Homeland Security and Emergency Management, 7(1), 14. https://doi.org/10.2202/1547-7355.1732
- Deng, H., Aldrich, D. P., Danziger, M. M., Gao, J., Phillips, N. E., Cornelius, S. P., & Wang, Q. R. (2021). High-resolution human mobility data reveal race and wealth disparities in disaster evacuation patterns. Humanities and Social Sciences Communications, 8(1). Article 1. https://doi.org/10.1057/s41599-021-00824-8.
- Dillard, M. (2021). Inventory of community resilience indicators & assessment frameworks Accessed 2022-01-24. Na-Tional Institute of Standards and Technology. https://doi.org/10.18434/Mds2-2297
- Dixon, B., Johns, R., & Fernandez, A. (2021). The role of crowdsourced data, participatory decision-making and mapping of flood related events. Applied Geography, 128, 102393. https://doi.org/10.1016/j.apgeog.2021.102393
- Dong, L., & Shan, J. (2013). A comprehensive review of earthquake-induced building damage detection with remote sensing techniques. ISPRS Journal of Photogrammetry and Remote Sensing, 84, 85–99. https://doi.org/10.1016/j.isprsjprs.2013.06.011
- Finch, C., Emrich, C. T., & Cutter, S. L. (2010). Disaster disparities and differential recovery in New Orleans. Population and Environment, 31(4), 179–202. https://doi.org/10.1007/s11111-009-0099-8
- Foster, K. (2012). In search of regional resilience. In M. Weir, H. Wial, & H. Wolman (Eds.), Building regional resilience: Urban and regional policy and its effects (Vol. 4, pp. 24–59). Brookings Institute Press.
- Fussell, E., Sastry, N., & VanLandingham, M. (2010). Race, socioeconomic status, and return migration to New Orleans after Hurricane Katrina. Population and Environment, 31(1), 20–42. https://doi.org/10.1007/s11111-009-0092-2
- Gandomi, A., & Haider, M. (2015). Beyond the hype: Big data concepts, methods, and analytics. International Journal of Information Management, 35(2), 137–144. https://doi.org/10.1016/j.ijinfomgt.2014.10.007
- Graham, M., Hale, S. A., & Gaffney, D. (2014). Where in the World are You? Geolocation and language identification in Twitter. The Professional Geographer, 66(4), 568–578. https://doi.org/10.1080/00330124.2014.907699
- Guan, X., & Chen, C. (2014). Using social media data to understand and assess disasters. Natural Hazards, 74(2), 837–850. https://doi.org/10.1007/s11069-014-1217-1
- Guo, H., Liu, Z., Jiang, H., Wang, C., Liu, J., & Liang, D. (2017). Big Earth data: A new challenge and opportunity for Digital Earth’s development. International Journal of Digital Earth, 10(1), 1–12. https://doi.org/10.1080/17538947.2016.1264490
- Guo, H., Wang, L., & Liang, D. (2016). Big Earth data from space: A new engine for Earth science. Science Bulletin, 61(7), 505–513. https://doi.org/10.1007/s11434-016-1041-y
- Haraguchi, M., Nishino, A., Kodaka, A., Allaire, M., Lall, U., Kuei-Hsien, L., Onda, K., Tsubouchi, K., & Kohtake, N. (2022). Human mobility data and analysis for urban resilience: A systematic review. Environment and Planning B: Urban Analytics and City Science, 49(5), 1507–1535. https://doi.org/10.1177/23998083221075634
- Harte, E. W., Childs, I. R. W., & Hastings, P. A. (2009). Imizamo Yethu: A case study of community resilience to fire hazard in an informal settlement Cape Town, South Africa. Geographical Research, 47(2), 142–154. https://doi.org/10.1111/j.1745-5871.2008.00561.x
- Hendricks, M. D., Meyer, M. A., Gharaibeh, N. G., Van Zandt, S., Masterson, J., Cooper, J. T., Horney, J. A., & Berke, P. (2018). The development of a participatory assessment technique for infrastructure: Neighborhood-level monitoring towards sustainable infrastructure systems. Sustainable Cities and Society, 38, 265–274. https://doi.org/10.1016/j.scs.2017.12.039
- Holling, C. S. (1973). Resilience and stability of ecological systems. Annual Review of Ecology and Systematics, 4(1), 1–23. https://doi.org/10.1146/annurev.es.04.110173.000245
- Hong, B., Bonczak, B. J., Gupta, A., & Kontokosta, C. E. (2021). Measuring inequality in community resilience to natural disasters using large-scale mobility data. Nature Communications, 12(1), 1870. https://doi.org/10.1038/s41467-021-22160-w
- Huang, Q., & Xiao, Y. (2015). Geographic situational awareness: Mining tweets for disaster preparedness, emergency response, impact, and recovery. ISPRS International Journal of Geo-Information, 4(3), 1549–1568. Article 3. https://doi.org/10.3390/ijgi4031549
- Hu, Y., Mai, G., Cundy, C., Choi, K., Lao, N., Liu, W., Lakhanpal, G., Zhou, R. Z., & Joseph, K. (2023). Geo-knowledge-guided GPT models improve the extraction of location descriptions from disaster-related social media messages. International Journal of Geographical Information Science, 1–30. https://doi.org/10.1080/13658816.2023.2266495
- Hung, H.-C., Yang, C.-Y., Chien, C.-Y., & Liu, Y.-C. (2016). Building resilience: Mainstreaming community participation into integrated assessment of resilience to climatic hazards in metropolitan land use management. Land Use Policy, 50, 48–58. https://doi.org/10.1016/j.landusepol.2015.08.029
- Janssen, M. A., Schoon, M. L., Ke, W., & Börner, K. (2006). Scholarly networks on resilience, vulnerability and adaptation within the human dimensions of global environmental change. Global Environmental Change, 16(3), 240–252. https://doi.org/10.1016/j.gloenvcha.2006.04.001
- Ji, T., Wei, H.-H., Sim, T., Yang, L. E., & Scheffran, J. (2021). Disaggregated validation of disaster-resilience indicators using household survey data: A case study of Hong Kong. Sustainable Cities and Society, 67, 102726. https://doi.org/10.1016/j.scs.2021.102726
- Joyce, K. E., Belliss, S. E., Samsonov, S. V., McNeill, S. J., & Glassey, P. J. (2009). A review of the status of satellite remote sensing and image processing techniques for mapping natural hazards and disasters. Progress in Physical Geography: Earth and Environment, 33(2), 183–207. https://doi.org/10.1177/0309133309339563
- Kryvasheyeu, Y., Chen, H., Obradovich, N., Moro, E., Van Hentenryck, P., Fowler, J., & Cebrian, M. (2016). Rapid assessment of disaster damage using social media activity. Science Advances, 2(3), e1500779. https://doi.org/10.1126/sciadv.1500779
- Lam, N. S. N., Pace, K., Campanella, R., LeSage, J., Arenas, H., & Scalas, E. (2009). Business return in New Orleans: Decision making amid post-Katrina uncertainty. PLoS ONE, 4(8), e6765. https://doi.org/10.1371/journal.pone.0006765
- Lam, N. S.-N., Qiang, Y., Li, K., Cai, H., Zou, L., & Mihunov#, V. (2018). Extending resilience assessment to dynamic System modeling: Perspectives on human dynamics and climate change research. Journal of Coastal Research, 85, 1401–1405. https://doi.org/10.2112/SI85-281.1
- Lam, N. S. N., Reams, M., Li, K., Li, C., & Mata, L. P. (2016). Measuring community resilience to coastal hazards along the Northern Gulf of Mexico. Natural Hazards Review, 17(1), e193–e193. https://doi.org/10.1061/(ASCE)NH.1527-6996.0000193
- Lam, N. S.-N., Xu, Y. J., Liu, K., Dismukes, D. E., Reams, M., Pace, R. K., Qiang, Y., Narra, S., Li, K., Bianchette, T. A., Cai, H., Zou, L., & Mihunov, V. (2018). Understanding the Mississippi River Delta as a coupled natural-human System: Research methods, challenges, and prospects. Water, 10(8), 1054. https://doi.org/10.3390/w10081054
- Li, J., Liu, Z., Lei, X., & Wang, L. (2021). Distributed fusion of heterogeneous Remote sensing and social media data: A review and New developments. Proceedings of the IEEE, 109(8), 1350–1363. https://doi.org/10.1109/JPROC.2021.3079176
- Lin, B., Zou, L., Duffield, N., Mostafavi, A., Cai, H., Zhou, B., Tao, J., Yang, M., Mandal, D., & Abedin, J. (2022). Revealing the linguistic and geographical disparities of public awareness to covid-19 outbreak through social media. International Journal of Digital Earth, 15(1), 868–889. https://doi.org/10.1080/17538947.2022.2070677
- Lin, B., Zou, L., Zhao, B., Huang, X., Cai, H., Yang, M., & Zhou, B. (2023). Sensing the pulse of the pandemic: Geovisualizing the demographic disparities of public sentiment toward COVID-19 through social media. (arXiv:2304.06120). arXiv. https://doi.org/10.48550/arXiv.2304.06120
- Ludwig, T., Siebigteroth, T., & Pipek, V. (2015). CrowdMonitor: Monitoring physical and Digital activities of citizens during emergencies. In L. M. Aiello & D. McFarland (Eds.), Social Informatics (pp. 421–428). Springer International Publishing. https://doi.org/10.1007/978-3-319-15168-7_51
- Mabon, L. (2016). Charting disaster recovery via Google street view: A social Science perspective on challenges raised by the Fukushima nuclear disaster. International Journal of Disaster Risk Science, 7(2), 175–185. https://doi.org/10.1007/s13753-016-0087-4
- McPhearson, T. (2014). The rise of resilience: Linking resilience and sustainability in city planning. The Nature of Cities, 10, 1–6. https://www.thenatureofcities.com/2014/06/08/the-rise-of-resilience-linking-resilience-and-sustainability-in-city-planning/#
- Meyer, M. A., & Hendricks, M. D. (2018). Using photography to assess Housing damage and rebuilding progress for disaster recovery Planning. Journal of the American Planning Association, 84(2), 127–144. https://doi.org/10.1080/01944363.2018.1430606
- Mihunov, V. V., Jafari, N. H., Wang, K., Lam, N. S. N., & Govender, D. (2022). Disaster impacts surveillance from social media with topic modeling and feature extraction: Case of Hurricane Harvey. International Journal of Disaster Risk Science, 13(5), 729–742. https://doi.org/10.1007/s13753-022-00442-1
- Mihunov, V. V., Lam, N. S. N., Zou, L., Wang, Z., & Wang, K. (2020). Use of Twitter in disaster rescue: Lessons learned from Hurricane Harvey. International Journal of Digital Earth, 13(12), 1454–1466. https://doi.org/10.1080/17538947.2020.1729879
- Monti, F., Frasca, F., Eynard, D., Mannion, D., & Bronstein, M. M. (2019). Fake News Detection on Social Media Using Geometric Deep Learning. arXiv. https://doi.org/10.48550/arXiv.1902.06673
- Naik, N. (2016). Flooded streets — a crowdsourced sensing system for disaster response: A case study. 2016 IEEE International Symposium on Systems Engineering (ISSE), 1–3. https://doi.org/10.1109/SysEng.2016.7753186
- Nicholls, R. J., Hoozemans, F. M. J., & Marchand, M. (1999). Increasing flood risk and wetland losses due to global sea-level rise: Regional and global analyses. Global Environmental Change, 9(Supplement 1), S69–S87. https://doi.org/10.1016/S0959-3780(99)00019-9
- Pánek, J., Marek, L., Pászto, V., & Valůch, J. (2017). The crisis Map of the Czech Republic: The nationwide deployment of an Ushahidi application for disasters. Disasters, 41(4), 649–671. https://doi.org/10.1111/disa.12221
- Peacock, W. G. (2010). Final Report advancing the resilience of coastal localities 10-02R.
- Peng, B., Huang, Q., Vongkusolkit, J., Gao, S., Wright, D. B., Fang, Z. N., & Qiang, Y. (2021). Urban flood mapping with bi-temporal multispectral imagery via a self-supervised learning framework. Journal of Selected Topics in Applied Earth Observations and Remote Sensing, 14, 2001–2016. https://doi.org/10.1109/JSTARS.2020.3047677
- Qiang, Y., Huang, Q., & Xu, J. (2020). Observing community resilience from space: Using nighttime lights to model economic disturbance and recovery pattern in natural disaster. Sustainable Cities and Society, 57, 57. https://doi.org/10.1016/j.scs.2020.102115
- Qiang, Y., & Xu, J. (2020). Empirical assessment of road network resilience in natural hazards using crowdsourced traffic data. International Journal of Geographical Information Science, 34(12), 2434–2450. https://doi.org/10.1080/13658816.2019.1694681
- Rufat, S., Tate, E., Emrich, C. T., & Antolini, F. (2019). How valid are social vulnerability models? Annals of the American Association of Geographers, 109(4), 1131–1153. https://doi.org/10.1080/24694452.2018.1535887
- Scherzer, S., Lujala, P., & Rød, J. K. (2019). A community resilience index for Norway: An adaptation of the baseline resilience indicators for communities (BRIC). International Journal of Disaster Risk Reduction, 36, 101107. https://doi.org/10.1016/j.ijdrr.2019.101107
- Sempier, T. T., Swann, D. L., Emmer, R., Sempier, S. H., & Schneider, M. (2010). Coastal Community Resilience Index: A Community Self-Assessment (MASGP-08-014). http://masgc.org/assets/uploads/publications/662/coastal_community_resilience_index.pdf
- Sherrieb, K., Norris, F. H., & Galea, S. (2010). Measuring capacities for community resilience. Social Indicators Research, 99(2), 227–247. https://doi.org/10.1007/s11205-010-9576-9
- Shu, K., Sliva, A., Wang, S., Tang, J., & Liu, H. (2017). Fake news detection on social media: A data Mining perspective. ACM SIGKDD Explorations Newsletter, 19(1), 22–36. https://doi.org/10.1145/3137597.3137600
- Song, J., Huang, B., Li, R., & Pandey, R. (2020). Construction of the scale-specific resilience index to facilitate multiscale decision making in disaster management: A case study of the 2015 Nepal earthquake. Social Indicators Research, 148(1), 189–223. https://doi.org/10.1007/s11205-019-02188-8
- Spalding, M. D., McIvor, A. L., Beck, M. W., Koch, E. W., Möller, I., Reed, D. J., Rubinoff, P., Spencer, T., Tolhurst, T. J., Wamsley, T. V., van Wesenbeeck, B. K., Wolanski, E., & Woodroffe, C. D. (2014). Coastal ecosystems: A critical element of Risk Reduction. Conservation Letters, 7(3), 293–301. https://doi.org/10.1111/conl.12074
- Sudmanns, M., Tiede, D., Lang, S., Bergstedt, H., Trost, G., Augustin, H., Baraldi, A., & Blaschke, T. (2020). Big Earth data: Disruptive changes in Earth observation data management and analysis? International Journal of Digital Earth, 13(7), 832–850. https://doi.org/10.1080/17538947.2019.1585976
- Tebaldi, C., Strauss, B. H., & Zervas, C. E. (2012). Modelling sea level rise impacts on storm surges along US coasts. Environmental Research Letters, 7(1), 014032. https://doi.org/10.1088/1748-9326/7/1/014032
- Timmerman, P. (1981). Vulnerability, resilience and the Collapse of Society—A review of models and possible climatic applications. Institute for Environmental Studies, University of Toronto.;/z-wcorg/.
- Vongkusolkit, J., & Huang, Q. (2021). Situational awareness extraction: A comprehensive review of social media data classification during natural hazards. Annals of GIS, 27(1), 5–28. https://doi.org/10.1080/19475683.2020.1817146
- Walpole, E. H., Loerzel, J., & Dillard, M. (2021). A review of community resilience frameworks and assessment tools: An annotated bibliography. National Institute for Standards and Technology.
- Wang, J., Hu, Y., & Joseph, K. (2020). NeuroTPR: A neuro-net toponym recognition model for extracting locations from social media messages. Transactions in GIS, 24(3), 719–735. https://doi.org/10.1111/tgis.12627
- Wang, K., Lam, N. S. N., Zou, L., & Mihunov, V. (2021). Twitter use in Hurricane Isaac and its implications for disaster resilience. ISPRS International Journal of Geo-Information, 10(3), 116. Article 3. https://doi.org/10.3390/ijgi10030116
- Wang, R.-Q., Mao, H., Wang, Y., Rae, C., & Shaw, W. (2018). Hyper-resolution monitoring of urban flooding with social media and crowdsourcing data. Computers & Geosciences, 111, 139–147. https://doi.org/10.1016/j.cageo.2017.11.008
- Wang, Q., Taylor, J. E., & Braunstein, L. A. (2016). Patterns and limitations of urban human mobility resilience under the influence of multiple types of natural disaster. PloS One, 11(1), e0147299. https://doi.org/10.1371/journal.pone.0147299
- Wang, Q., Taylor, J. E., & Wu, Y. (2014). Quantifying human mobility perturbation and resilience in hurricane sandy. PLOS ONE, 9(11), e112608. https://doi.org/10.1371/journal.pone.0112608
- Xing, Z., Zhang, X., Zan, X., Xiao, C., Li, B., Han, K., Liu, Z., & Liu, J. (2021). Crowdsourced social media and mobile phone signaling data for disaster impact assessment: A case study of the 8.8 Jiuzhaigou earthquake. International Journal of Disaster Risk Reduction, 58, 102200. https://doi.org/10.1016/j.ijdrr.2021.102200
- Xu, J., & Qiang, Y. (2021). Spatial assessment of community resilience from 2012 Hurricane Sandy using nighttime light. Remote Sensing, 13(20), 4128. Article 20. https://doi.org/10.3390/rs13204128
- Yabe, T., Rao, P. S. C., Ukkusuri, S. V., & Cutter, S. L. (2022). Toward data-driven, dynamical complex systems approaches to disaster resilience. Proceedings of the National Academy of Sciences, 119(8), e2111997119. https://doi.org/10.1073/pnas.2111997119
- Yabe, T., Zhang, Y., & Ukkusuri, S. V. (2020). Quantifying the economic impact of disasters on businesses using human mobility data: A bayesian causal inference approach. EPJ Data Science, 9(1). Article 1. https://doi.org/10.1140/epjds/s13688-020-00255-6.
- Yabut, E. R., Balceda, C. D., San Juan, R. E. Q., Tumamak, J. R., Velasquez, R. E., Jamis, M. N., & Manuel, R. E. (2017). E-wasBaha: A mobile application framework for flood monitoring in Metro Manila using crowdsourcing. 2017IEEE 9th International Conference on Humanoid, Nanotechnology, Information Technology, Communication and Control, Environment and Management (HNICEM), 1–6. https://doi.org/10.1109/HNICEM.2017.8269533
- Yang, C., Yu, M., Li, Y., Hu, F., Jiang, Y., Liu, Q., Sha, D., Xu, M., & Gu, J. (2019). Big Earth data analytics: A survey. Big Earth Data, 3(2), 83–107. https://doi.org/10.1080/20964471.2019.1611175
- Yuan, F., Esmalian, A., Oztekin, B., & Mostafavi, A. (2022). Unveiling spatial patterns of disaster impacts and recovery using credit card transaction fluctuations. Environment and Planning B: Urban Analytics and City Science, 49(9), 2378–2391. https://doi.org/10.1177/23998083221090246
- Yuan, F., Li, M., Liu, R., Zhai, W., & Qi, B. (2021). Social media for enhanced understanding of disaster resilience during hurricane florence. International Journal of Information Management, 57, 102289. https://doi.org/10.1016/j.ijinfomgt.2020.102289
- Yuan, F., & Liu, R. (2020). Mining social media data for rapid damage assessment during Hurricane Matthew: Feasibility study. Journal of Computing in Civil Engineering, 34(3), 05020001. https://doi.org/10.1061/(ASCE)CP.1943-5487.0000877
- Yu, M., Huang, Q., Qin, H., Scheele, C., & Yang, C. (2019). Deep learning for real-time social media text classification for situation awareness – using Hurricanes Sandy, Harvey, and Irma as case studies. International Journal of Digital Earth, 12(11), 1230–1247. https://doi.org/10.1080/17538947.2019.1574316
- Zhai, W., & Peng, Z.-R. (2020). Damage assessment using google street view: Evidence from hurricane Michael in Mexico Beach, Florida. Applied Geography, 123, 102252. https://doi.org/10.1016/j.apgeog.2020.102252
- Zhou, B., Zou, L., Hu, Y., Qiang, Y., & Goldberg, D. (2023). TopoBERT: A plug and play toponym recognition module harnessing fine-tuned BERT. International Journal of Digital Earth, 16(1), 3045–3063. arXiv Preprint arXiv:2301.13631. https://doi.org/10.1080/17538947.2023.2239794
- Zhou, B., Zou, L., Mostafavi, A., Lin, B., Yang, M., Gharaibeh, N., Cai, H., Abedin, J., & Mandal, D. (2022). VictimFinder: Harvesting rescue requests in disaster response from social media with BERT. Computers, Environment and Urban Systems, 95, 101824. https://doi.org/10.1016/j.compenvurbsys.2022.101824
- Zou, L., Lam, N. S. N., Cai, H., & Qiang, Y. (2018). Mining Twitter data for improved understanding of disaster resilience. Annals of the American Association of Geographers, 108(5), 1422–1441. https://doi.org/10.1080/24694452.2017.1421897
- Zou, L., Lam, N. S. N., Shams, S., Cai, H., Meyer, M. A., Yang, S., Lee, K., Park, S.-J., & Reams, M. A. (2019). Social and geographical disparities in Twitter use during Hurricane Harvey. International Journal of Digital Earth, 12(11), 1300–1318. https://doi.org/10.1080/17538947.2018.1545878
- Zou, L., Liao, D., Lam, N. S. N., Meyer, M. A., Gharaibeh, N. G., Cai, H., Zhou, B., & Li, D. (2023). Social media for emergency rescue: An analysis of rescue requests on Twitter during Hurricane Harvey. International Journal of Disaster Risk Reduction, 85, 103513. https://doi.org/10.1016/j.ijdrr.2022.103513
- Zou, B., Peng, B., & Huang, Q. (2022). Flood depth assessment with location-based social network data and Google street view—A case study with buildings as reference objects. IGARSS 2022 - 2022 IEEE International Geoscience and Remote Sensing Symposium, 1344–1347. https://doi.org/10.1109/IGARSS46834.2022.9884254