
ABSTRACT
We aim to investigate the hypoglycaemic and antioxidant effects of submerged Ganoderma lucidum cultures and elucidate the potential mechanisms behind these effects using a type 2 diabetic rat model. Diabetic rats were daily fed with a high-fat diet supplemented with 1% or 3% freeze-dried whole submerged cultures of G. lucidum or mycelia for 5 weeks. We observed significantly decreased fasting plasma glucose levels, homoeostasis model assessment equation-insulin resistance, and plasma glucose in oral glucose tolerance test. Furthermore, we observed increased levels of glycogen, hepatic hexokinase, glucose-6-phosphate dehydrogenase, and intestinal disaccharidase activities. G. lucidum supplement downregulated the plasma levels of aspartate aminotransferase, alanine aminotransferase, creatinine, and urea nitrogen as well as liver and kidney levels of thiobarbituric acid reactive substances. Based on the hypoglycaemic and antioxidant effects of G. lucidum submerged cultures, we recommend the potential application of these products as functional foods or additives for controlling type 2 diabetes.
Abbreviations ALT: Alanine aminotransferase; AST: Aspartate aminotransferase; BUN: Blood urea nitrogen; BW: Body weight; CREA: Creatinine; FPG: Fasting plasma glucose; G6Pase: Glucose-6-phosphatase; G6PD: Glucose-6-phosphate dehydrogenase; HOMA-IR: Homoeostasis model assessment of insulin resistance; OGTT: Oral glucose tolerance test; PTP: Protein tyrosine phosphatase; STZ: Streptozotocin; TBARS: Thiobarbituric acid reactive substances
Introduction
Ganoderma lucidum, a white rot basidiomycete that grows on logs, is one of the most famous traditional Chinese medicines and has been used as a food supplement in East Asia for centuries (Wachtel-Galor et al. Citation2011). The fruiting bodies of G. lucidum possess numerous biological activities, including anti-tumour, immune modulatory, hepatoprotective, antioxidant, anti-ageing, and hypoglycaemic effects (Wachtel-Galor et al. Citation2011; Girometta Citation2019). Although fruiting bodies are produced naturally, they are not produced in sufficient quantities for commercial use (Wachtel-Galor et al. Citation2011). The artificial cultivation of fruiting bodies takes approximately 3–5 months. In contrast, submerged ganoderma cultures only take 2–3 weeks to produce large amounts of bioactive ingredients such as mycelium, polysaccharides, and ganoderic acid. Generally, the advantages of submerged cultures compared to traditional basidiocarp cultivation include lower production and time costs, less space requirement, easier control of environmental conditions, and higher yields, purity, and rejuvenation (Wachtel-Galor et al. Citation2011).
Type 2 diabetes, a long-term metabolic disorder characterised by high plasma glucose levels and insulin resistance, mainly caused by obesity and lack of exercise, accounting for approximately 90% of diabetes cases (Wu et al. Citation2014). Long-term complications of high plasma glucose levels include heart diseases, stroke, and diabetic retinopathy, which can cause blindness, kidney failure, and poor limbic blood flow, possibly leading to amputations (Olokoba et al. Citation2012). Diabetes is diagnosed by blood tests, such as fasting plasma glucose (FPG) test, oral glucose tolerance test (OGTT), and homoeostasis model assessment of insulin resistance (HOMA-IR)(Boyko et al. Citation2007). To date, type 2 diabetes has been controlled through weight loss, healthy eating, regular exercise, diabetes medication or insulin therapy, and blood sugar monitoring (Olokoba et al. Citation2012). Nevertheless, these strategies are just designed for the retardation of development or progression of complications.
It has been well known that hyperglycaemia in patients with type 2 diabetes is not only associated with insulin resistance but also with endogenous glucose production. Hepatic control of endogenous glucose homoeostasis is achieved via the coordination of signalling pathways that regulate glycogen synthesis, glycogenolysis, and gluconeogenesis (Sloop et al. Citation2007). Glucose-6-phosphatase (G6Pase) and hexokinase are key regulators for endogenous glucose production, and the reduction of G6Pase/hexokinase ratio might improve glucose control in type 2 diabetes (Sloop et al. Citation2007). Diabetes and the deficiency of glucose-6-phosphate dehydrogenase (G6PD), the major enzyme that catalyzes the first step of the pentose phosphate pathway, have been reported to aggravate each other, and a possible association has been reported between diabetes and G6PD deficiency (Heymann et al. Citation2012). On the other hand, intestinal disaccharidase, a critical enzyme involved in the digestion of disaccharides into glucose, is also important for the regulation of plasma glucose levels (Neyrinck et al. Citation2016). Collectively, enzymes related to glucose absorption or metabolism are also potential targets for developing therapeutic strategies for hyperglycaemia.
Hyperglycaemia in diabetes is a key mechanism leading to oxidative stress, which is related to organ damage. Oxidative stress is one of the major pathogenic mechanisms involved in the progression of diabetes and diabetic complications, such as liver and kidney damage (Raza et al. Citation2011). Moreover, lipid peroxidation-mediated tissue damage has been detected during the progression of diabetes, which is also one of the specific features of chronic diabetes (Manna et al. Citation2010). Therefore, natural products with antioxidant activity are important because they can potentially improve the oxidative complications associated with diabetes.
Although several studies have reported the hypoglycaemic and antioxidant potentials of G. lucidum fruiting bodies (He et al. Citation2006; Seto et al. Citation2009; Xiao et al. Citation2012; Zheng et al. Citation2012; Pan et al. Citation2013; Bach et al. Citation2018), the composition and relative proportions of G. lucidum basidiocarp cultivation are different from those of submerged culture (Wachtel-Galor et al. Citation2011). In addition, the yield of mycelia and extracellular polysaccharides obtained from submerged G. lucidum cultures varies with the culture conditions (Chang et al. Citation2006). Therefore, it would be of great interest to know whether the submerged G. lucidum cultures also possess hypoglycaemic and antioxidant effects. In the present study, we used a type 2 diabetic rat model to deepen our understanding of the hypoglycaemic and antioxidant effects of submerged G. lucidum culture, and to explore its mechanism of action. First, we measured the contents of mycelium and extracellular polysaccharides in the submerged G. lucidum cultures. Next, the STZ-induced diabetic rats were daily fed with a high-fat diet supplemented with 1% or 3% freeze-dried whole submerged G. lucidum cultures (1 G or 3 G) or mycelia (1 M or 3 M) for 5 weeks. FPG and HOMA-IR levels were measured, and OGTT was conducted in rats fed with a G. lucidum-supplemented diet to explore its hypoglycaemic effects. Liver glycogen levels and hepatic hexokinase, G6Pase, G6PD, and intestinal disaccharidase activities were evaluated to illustrate the potential mechanism of action behind the antioxidant effects of submerged G. lucidum cultures. Finally, the levels of aspartate aminotransferase (AST), alanine aminotransferase (ALT), creatinine (CREA), and urea nitrogen (BUN) in plasma as well as levels of thiobarbituric acid reactive substances (TBARS) in the liver and kidney were measured to investigate the antioxidant and protective effects of G. lucidum against diabetes-related organ damage.
Materials and methods
Chemicals and reagents
All chemicals and reagents were purchased from Sigma-Aldrich Chemical Co. (St. Louis, MO, USA) unless otherwise stated. The rat insulin enzyme-linked immunosorbent assay (ELISA) kit was purchased from Randox Laboratories, Ltd. (Crumlin, UK), and the glucose detection kit was purchased from Audit Diagnostics (Cork, Ireland).
Preservation, culture and sample preparation
G. lucidum BCRC 36123 purchased from the Bioresources Collection and Research Centre (Hsinchu, Taiwan) was maintained on Gano medium (2.4 g glucose, 0.6 g yeast extract in 100 mL deionised water) agar plates and cultured at 30°C for 7 days. Next, pieces of mycelium pad (0.5 x 0.5 cm2) were cut from the culture plate and inoculated into preserving medium at room temperature for 2 h followed by overnight storage at 4°C. The liquid cultures were then stored at −80°C. For culturing, the frozen pieces were thawed at 37°C and cultured on Gano medium agar plates at 30°C for 7 days. Two mycelial pieces were cut from the culture plate and inoculated into a flask containing Gano medium and incubated at 30°C with shaking at 110 rpm for 7 days. Finally, based on the methods in our previous report (Chang et al. Citation2006), the cultivated mycelia were separated by centrifugation. After being thoroughly washed, the collected precipitated mycelia were freeze-dried and weighed. The extracellular polysaccharides in supernatant were precipitated by ethanol, washed, and finally freeze-dried and weighed. Whole submerged cultures and precipitated mycelia were freeze-dried and stored at −20°C for animal experiments.
Animals and experimental design
Eight-week-old male Sprague-Dawley rats were obtained from BioLASCO Taiwan Co., Ltd. (Taipei, Taiwan). On arrival, rats were housed in stainless steel cages with diet and water provided ad libitum for 1 week before treatment. Rats were kept under humid conditions (30%–70%) and 12-h light/dark cycle in a temperature (23°C ± 2°C)-controlled environment. All animal experiments were performed in accordance with the guidelines for the care and use of laboratory animals and approved by the Institutional Animal Care and Use Committee of the National Taiwan Ocean University.
The rats were randomly divided into six groups (n = 8): normal control (NC), diabetic control (DC), diabetic rats fed with 1% or 3% freeze-dried whole submerged G. lucidum culture-supplemented diets (1 G or 3 G), and diabetic rats fed with 1% or 3% freeze-dried G. lucidum mycelia-supplemented diets (1 M or 3 M). For the induction of type 2 diabetes, the rats were subcutaneously injected with nicotinamide (230 mg/kg BW) and STZ (65 mg/kg BW) with a 15-min interval (Masiello et al. Citation1998). After 1 week, OGTT was performed to confirm the successful induction of diabetes, and the rats were daily fed with a G. lucidum supplement diet for 5 weeks. The intake levels of food and water, body weight, urine volume, and faecal weight were measured weekly. OGTT was performed again at the fourth week after diabetes induction, and blood, liver, and intestinal tissue samples were harvested after sacrifice of the rats at the fifth week for further analysis ().
Figure 1. Protocols of diabetes induction and G. lucidum treatment. Sprague-Dawley rats were injected with nicotinamide and streptozotocin (STZ) to induce type 2 diabetes. After 1 week, oral glucose tolerance test (OGTT) was performed to verify successful induction of diabetes. The rats in normal control (NC) group did not receive any treatment through the experiment. Diabetic rats were randomly divided to 5 groups (n = 8): diabetic control (DC); diabetic + 1% G (1 G); diabetic + 3% G (3 G); diabetic + 1% M (1 M) and diabetic + 3% M (3 M). Except for the rat in NC and DC groups, the other rats were daily fed with G. lucidum powder supplement diets as described in Materials and methods. OGTT was performed again at week 5. All rats were weighted and sacrificed at week 6 to harvest the samples of blood, liver and small intestine for further analysis
Evaluation of the plasma levels of glucose, insulin, AST, ALT, CREA, and BUN
Blood samples were collected for the preparation of plasma at the designated time points after the beginning of OGTT and before sacrifice. The plasma glucose, insulin, AST, ALT, CREA, and BUN levels were measured using a glucose detection kit, insulin ELISA kit, and Enzymatic Kits (Randox Laboratories Limited, UK), respectively, according to the manufacturer’s instructions. The HOMA-IR was calculated using the equation described in the previous study (Boyko et al. Citation2007).
Evaluation of the levels of glycogen, hexokinase, glucose-6-phosphatase, and glucose-6-phosphate dehydrogenase in the liver
Liver glycogen level was measured and calculated as described previously (Murat and Serfaty Citation1974). Briefly, liver samples were homogenised in citrate buffer/tri-sodium citrate solution. After centrifugation, the supernatant was harvested, and the glucose level was measured at 505 nm using a glucose detection kit. The other part of supernatant was mixed with amyloglucosidase and incubated at 37°C for 4 h. After centrifugation, the supernatant was harvested, and the glucose level was measured to calculate the concentration of glycogen. In order to determine the activities of hepatic enzymes pertaining to the control of endogenous glucose homoeostasis, liver samples were homogenised in N-acetyl-cysteine buffer and centrifuged to obtain the cytosol of hepatocytes. Hexokinase, G6Pase, and G6PD activities in the cytosol of hepatocytes were measured as described previously (Erickson et al. Citation1978).
Evaluation of disaccharidase activity in the intestinal mucosal tissues
The activity of intestinal disaccharidase, including maltase, lactase and sucrose, was measured based on the method described by Dahlqvist (Citation1968). Briefly, the mucosal tissues of small intestine were harvested and homogenised in maleic acid buffer. After centrifugation, the supernatant was harvested and mixed with either maltose, lactose, or sucrose. The mixtures were incubated at 37°C for 60 min and then 100°C for 2 min to completely inactivate disaccharidase. Glucose and protein levels were measured using a glucose detection kit and Bio-Rad protein assay, respectively, according to the manufacturer’s instructions.
Evaluation of TBARS levels in the liver and kidney
Liver and kidney samples were homogenised as described in the previous section. Homogenised samples were mixed with phosphoric acid and thiobarbituric acid and incubated at 95°C for 45 min. After cooling down, the samples were mixed with n-butanol and centrifuged to collect the supernatants for the measurement of optical density.
Statistical analysis
All data were expressed as the mean ± standard error of mean for each treatment group. Statistical analysis was performed by SPSS 12.0 software, and independent sample t-test was used to assess the statistical difference between treatment groups and the DC control. All p-values < 0.05 were considered statistically significant.
Results
Mycelia and polysaccharide levels in the submerged G. lucidum cultures and the intake doses of G. lucidum
After incubation of G. lucidum at 30°C for 7 days, the amounts of mycelia and extracellular polysaccharides in culture were measured (Chang et al. Citation2006). As shown in , mycelia and extracellular polysaccharide levels were 6.56 ± 0.74 g/L and 0.50 ± 0.08 g/L, respectively. The pH value of the cultured medium was decreased from 6.24 ± 0.05 at the beginning to 3.90 ± 0.07 at the end of incubation ().
Table 1. Contents of mycelium, extracellular polysaccharides and pH value in the submerged culture of Ganoderma lucidum at 30°C for 7 days
Based on the food intake and body weights of rats (), the intake doses of mycelia were calculated as 0.5, 1.5, 0.46, and 1.39 g/kg/day for rats in the 1 G, 3 G, 1 M, and 3 M groups, respectively. Extracellular polysaccharide intake was calculated as 36 and 107 mg/kg/day for rats in the 1 G and 3 G groups, respectively.
Table 2. The average daily food intake, drinking water intake, urine volume and faeces weights of rats fed with G. lucidum-containing high- cholesterol diets
Table 3. The body weights, small intestine, liver and kidney weights of diabetic rats fed with G. lucidum-containing high-cholesterol diets
Diets supplemented with G. lucidum reduced the plasma glucose levels
In order to confirm the induction of diabetes, OGTT was performed 1 week after STZ injection. After oral administration with glucose, the plasma glucose level was markedly elevated in rats injected with STZ compared with that in the NC group, indicating successful induction of diabetes (). OGTT was performed to investigate the hypoglycaemic effects of G. lucidum after feeding the rats with G. lucidum supplement diets for 4 weeks. Although the plasma glucose level was only slightly lower in rats in the 1 G, 1 M, and 3 M groups, it was significantly reduced in the 3 G group compared with that in the DC group (). In order to confirm the hypoglycaemic effects of the G. lucidum supplement diets, the FPG levels and liver glycogen concentration were measured. Consistent with the results obtained from OGTT, the FPG levels in the 3 G group, but not those in other treatment groups, was significantly reduced compared with that in the DC group (). In parallel, similar trend of plasma insulin levels were observed for each group (). As HOMA-IR can more consistently predict type 2 diabetes compared with other insulin resistance indices, we further calculated HOMA-IR based on FPG and insulin levels (Boyko et al. Citation2007). We observed that 3 G treatment significantly reduced HOMA-IR (). Furthermore, the glycogen level in the liver was significantly increased in the 3 G, 1 M, and 3 M groups (). Accordingly, we suggest the potential involvement of carbohydrate metabolism in the hypoglycaemic effect of G. lucidum.
Figure 2. The concentration of plasma glucose in rats before and after G. lucidum powder supplement in oral glucose tolerance test (OGTT). The rats were injected with nicotinamide and STZ for the induction of diabetes and fed with G. lucidum powder supplement diets for 5 weeks as described in Materials and methods. (a) Before and (b) after G. lucidum powder supplement for 4 weeks, the blood samples were collected at 0, 30, 60 and 120 min after glucose administration. The concentration of plasma glucose was measured by enzymatic kit following the supplier’s instruction. Results are expressed as mean ± SEM for each group of rats (n = 8). #p < 0.05 compared with the NC group; *p < 0.05 compared with the DC group. NC: normal control; DC: diabetic control; 1 G: diabetic rats fed with 1% G. lucidum powders; 3 G: diabetic rats fed with 3% G. lucidum powders; 1 M: diabetic rats fed with 1% G. lucidum mycelium powders. 3 M: diabetic rats fed with 3% G. lucidum mycelium powders
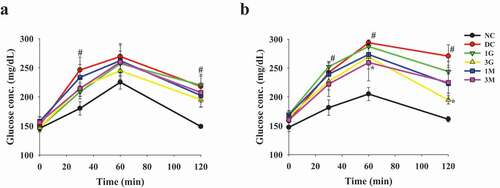
Figure 3. The levels of plasma glucose parameters and glycogen concentrations in liver of diabetic rats fed with G. lucidum powder supplement diets. The rats were injected with nicotinamide and STZ for the induction of diabetes and fed with G. lucidum powder supplement diets for 5 weeks. The blood samples were collected, and rats were sacrificed to harvest liver samples. The levels of (a) glucose and (b) insulin in plasma and (d) glycogen in liver were detected, and the value of (c) homoeostasis model assessment equation-insulin resistance (HOMA-IR) was calculated as described in Materials and methods. Results are expressed as mean ± SEM for each group of rats (n = 8). #p < 0.05 compared with the NC group; *p < 0.05 compared with the DC group. NC: normal control; DC: diabetic control; 1 G: diabetic rats fed with 1% G. lucidum powders; 3 G: diabetic rats fed with 3% G. lucidum powders; 1 M: diabetic rats fed with 1% G. lucidum mycelium powders. 3 M: diabetic rats fed with 3% G. lucidum mycelium powders
G. lucidum supplement diets modulated the activities of hepatic carbohydrate metabolism enzymes
Based on the above results, we further elucidated the influence of G. lucidum supplement diets on the activities of carbohydrate metabolism enzymes. Hexokinase and G6PD activities in rat livers in the DC group were significantly reduced compared with those in the NC group ( (a,b)). However, G. lucidum supplement diets, particularly 3 G, could reverse the diminished activities of hexokinase and G6PD ( (a,b)). Although G6Pase activity was comparable between each group, the G6Pase/hexokinase ratio was reduced in rats fed with G. lucidum supplement diets compared with that in the DC group ( (c,d)). These findings suggest that modulation of carbohydrate metabolism enzyme activities is one of the major mechanisms behind the hypoglycaemic effect of G. lucidum.
Figure 4. The activities of carbohydrate metabolism enzymes in liver of diabetic rats fed with G. lucidum powder supplement diets. The rats were injected with nicotinamide and STZ for the induction of diabetes and fed with G. lucidum powder supplement diets for 5 weeks. The rats were sacrificed, and the liver samples were harvested and prepared for the detection of (a) hexokinase, (b) glucose-6-phosphate dehydrogenase (G6PD) and (c) glucose-6-phosphatase (G6Pase) activities and calculation of (d) G6Pase/hexokinase ratio as described in Materials and methods. Results are expressed as mean ± SEM for each group of rats (n = 8). p < 0.05 compared with the NC group; *p < 0.05 compared with the DC group. NC: normal control; DC: diabetic control; 1 G: diabetic rats fed with 1% G. lucidum powders; 3 G: diabetic rats fed with 3% G. lucidum powders; 1 M: diabetic rats fed with 1% G. lucidum mycelium powders. 3 M: diabetic rats fed with 3% G. lucidum mycelium powders
G. lucidum supplement diets ameliorated diabetes-associated intestinal damage
In some cases of chronic diabetes, the enteric nerves supplying in the small intestine might be affected, leading to abnormal motility, secretion, or absorption (Wolosin and Edelman Citation2000). Decreased intestinal absorption of glucose would stimulate glycogenolysis in the liver and subsequently result in hyperglycaemia (Pan et al. Citation2013). Therefore, we also investigated the changes in small intestinal weight and the activities of disaccharidases in the small intestine. Small intestinal weight was slightly reduced in STZ-injected rats compared with that in the NC group (). The G. lucidum supplement diets did not induce significant alterations in the small intestinal weight (). Notably, maltase, lactase, and sucrase activities were markedly reduced in STZ-injected rats. However, the G. lucidum supplement diets significantly reversed the reduction in lactase and sucrase activities ( (a,b)). These findings suggested a potential protective effect of G. lucidum supplement diets against diabetes-induced intestinal damage.
Figure 5. The activities of small intestinal disaccharidases in diabetic rats fed with G. lucidum powder supplement diets. The rats were injected with nicotinamide and STZ for the induction of diabetes and fed with G. lucidum powder supplement diets for 5 weeks. The rats were sacrificed, and the tissues of small intestine were harvested and prepared to evaluate the activities of (a) lactase, (b) sucrase and (c) maltase as described in Materials and methods. Results are expressed as mean ± SEM for each group of rats (n = 8). p < 0.05 compared with the NC group; *p < 0.05 compared with the DC group. NC: normal control; DC: diabetic control; 1 G: diabetic rats fed with 1% G. lucidum powders; 3 G: diabetic rats fed with 3% G. lucidum powders; 1 M: diabetic rats fed with 1% G. lucidum mycelium powders. 3 M: diabetic rats fed with 3% G. lucidum mycelium powders
G. lucidum supplement diets attenuated diabetes-associated oxidative damage in the liver and kidney
As hyperglycaemia during diabetes is the pivotal mechanism leading to oxidative stress in tissues and organs, we finally investigated the antioxidant and protective effects of the G. lucidum supplement diets against diabetes-associated liver and kidney damage. Impaired liver and kidney functions were evidenced by increased plasma levels of ALT, CREA and BUN in diabetic rats compared with the levels in the NC group, although the level of AST was not significantly different between each group (). The G. lucidum supplement diets significantly reduced ALT, CREA, and BUN levels (). In addition, liver and kidney levels of TBARS, a marker for lipid peroxidation, were also reduced in rats fed with the G. lucidum supplement diets (). These findings suggest the beneficial effects of the G. lucidum supplement diets on the improvement of impaired liver and kidney functions in diabetic rats, which was closely associated with its antioxidant activity.
Figure 6. The concentrations of plasma (a) aspartate aminotransferase (AST), (b) alanine aminotransferase (ALT), (c) creatinine (CREA) and (d) blood urea nitrogen (BUN) in rats fed with G. lucidum powder supplement diets. The rats were injected with nicotinamide and STZ for the induction of diabetes and fed with G. lucidum powder supplement diets for 5 weeks. The blood samples were collected individually for the detection of plasma AST, ALT, CREA and BUN as described in Materials and methods. Results are expressed as mean ± SEM for each group of rats (n = 8). #p < 0.05 compared with the NC group; *p < 0.05 compared with the DC group. NC: normal control; DC: diabetic control; 1 G: diabetic rats fed with 1% G. lucidum powders; 3 G: diabetic rats fed with 3% G. lucidum powders; 1 M: diabetic rats fed with 1% G. lucidum mycelium powders. 3 M: diabetic rats fed with 3% G. lucidum mycelium powders
Figure 7. The concentrations of thiobarbituric acid reactive substances (TBARS) in the (a) liver and (b) kidney of rats fed with G. lucidum powder supplement diets. The rats were injected with nicotinamide and STZ for the induction of diabetes and fed with G. lucidum powder supplement diets for 5 weeks. The rats were then sacrificed to isolate the liver and kidney tissues. The concentration of TBARS in the liver and kidney was measured as described in Materials and methods. Results are expressed as mean ± SEM for each group of rats (n = 8). #p < 0.05 compared with the NC group; *p < 0.05 compared with the DC group. NC: normal control; DC: diabetic control; 1 G: diabetic rats fed with 1% G. lucidum powders; 3 G: diabetic rats fed with 3% G. lucidum powders; 1 M: diabetic rats fed with 1% G. lucidum mycelium powders. 3 M: diabetic rats fed with 3% G. lucidum mycelium powders
Discussion
Fungi and their metabolites are the main source of bioactive molecules that show biological activity (Girometta Citation2019; Ogbole et al. Citation2019). Among these sources, G. lucidum fruiting bodies have been reported to have antidiabetic activities. However, there is limited information on the hypoglycaemic and antioxidant effects of submerged G. lucidum cultures and the mechanism of action behind these effects. In the present study, we demonstrated the hypoglycaemic activity of whole submerged G. lucidum cultures and elucidated its potential mechanism in a rat model of type 2 diabetes. This notion has been substantiated by several lines of evidence. Firstly, dietary supplementation with 3 G culture for 5 weeks significantly reduced FPG and HOMA-IR levels in rats with type 2 diabetes. Secondly, OGTT showed a markedly reduced plasma glucose levels in diabetic rats fed with a 3 G supplement diet. Thirdly, an elevated liver glycogen level, enhanced hepatic hexokinase, G6PD, intestinal lactase and sucrase activity, and a lower G6Pase/hexokinase ratio were observed in rats fed with the G. lucidum supplement diet. Furthermore, diabetes-associated oxidative damage in the liver and kidney, as indicated by increased plasma levels of ALT, CREA, and BUN, was alleviated by G. lucidum supplementation. Our data clearly substantiate the hypoglycaemic and antioxidant activities of G. lucidum submerged cultures and provide critical insights into the mechanisms of action behind their effects.
G. lucidum fruiting bodies has been shown to exhibit hypoglycaemic activity. For example, consumption of the water extract of G. lucidum fruiting bodies (0.03 and 0.3 g/kg per day for 4 weeks) could decrease the plasma glucose levels through suppression of the hepatic PEPCK gene expression in db/db mice (Seto et al. Citation2009). The 30-day treatment with the hydroethanolic extract (containing beta-glucan, proteins, and phenols) of G. lucidum fruiting bodies exhibited hypoglycaemic effects in STZ-induced diabetic rats (Bach et al. Citation2018). In addition, many identified bioactive constituents in G. lucidum fruiting bodies, such as polysaccharides, proteoglycans, proteins, ganoderic acids, and triterpenoids, have been shown to exhibit hypoglycaemic activities (Ma et al. Citation2015). Polysaccharides inhibited hyperglycaemia by regulating the expression of several key enzymes in the glucose metabolism pathway, such as hepatic glucokinase, phosphofructokinase, G6PD, hepatic glycogen phosphorylase, fructose-1,6-bisphosphatase, phosphoenolpyruvate carboxykinase, and G6Pase (Xiao et al. Citation2012). G. lucidum proteoglycan could inhibit the activity of protein tyrosine phosphatase (PTP) 1B, a promising therapeutic target in diabetes, and ameliorated plasma glucose in db/db mice (Wang et al. Citation2012). In addition, decreased FPG was observed in rats with type 2 diabetes treated with the proteoglycan FYGL extracted from G. lucidum fruiting bodies. FYGL exerts its hypoglycaemic activity via the inhibition of PTP1B expression and activity (Teng et al. Citation2012). Moreover, treatment with submerged culture mycelium powder (1 g/kg/day) for 2 weeks reduced blood glucose and glycosylated haemoglobin concentrations in rats with type 1 diabetes (Vitak et al. Citation2015).
In the present study, a slightly lower plasma glucose level was observed in diabetic rats daily fed with a mycelia supplement diet compared with that in rats in the DC group. However, daily treatment with 3 G supplement diets significantly reduced plasma glucose levels, indicating that extracellular components may contain major compounds with hypoglycaemic activities and/or extracellular components exhibit a synergistic hypoglycaemic effect with mycelia. Polysaccharides are among the major extracellular components contained in whole submerged G. lucidum cultures, and polysaccharide intake was calculated as 36 and 107 mg/kg/day for rats in the 1 G and 3 G groups, respectively. Xiao et al. (Citation2012) have reported that daily treatment with polysaccharides extracted from G. lucidum fruiting bodies (50–100 mg/kg) significantly decreases fasting serum glucose levels in rats with type 2 diabetes in a dose-dependent manner. Most importantly, the hypoglycaemic effect of polysaccharides has been associated with decreased expression of several key enzymes involved in gluconeogenesis and/or glycogenolysis (Xiao et al. Citation2012). Concordantly, our data also show enhanced hexokinase and G6PD activities and decreased G6Pase/hexokinase ratio in diabetic rats fed with a 3 G supplement diet. Accordingly, we suggest that extracellular polysaccharides harvested from submerged cultures and those extracted from fruiting bodies might exert their hypoglycaemic effects through the same mechanism of action.
Type 2 diabetes is an inflammatory metabolic disease that is commonly accompanied by increased oxidative stress. It has been reported that G. lucidum could reduce peroxide accumulation in the body by increasing antioxidant enzyme activity in the blood and liver (Jia et al. Citation2009). Both ethanol and water extracts of G. lucidum could reduce lipid peroxidation in the liver and kidney (Shieh et al. Citation2001). Supplementation with G. lucidum fruiting bodies polysaccharides decreased plasma CREA and BUN levels via the modulation of lipid peroxidation (He et al. Citation2006). We further demonstrated that supplementation with submerged G. lucidum cultures and their mycelia improved liver and kidney function potentially via the attenuation of oxidative stress. In the current study, the value of AST was comparable between each group. It is suggested that the oxidative stress elicited by the employed animal model was not violent enough to damage the mitochondria, since ALT and AST are critical enzymes prevalently located in the hepatocyte cytoplasm and mitochondria, respectively (Glinghammar et al. Citation2009; Jiang et al. Citation2015). Based on the results of the present study and previous studies, it could be speculated that polysaccharides are potential active components of G. lucidum with antioxidant activities and protective effects against liver and kidney damage.
Conclusion
Our findings provide the first evidence of the dose-dependent hypoglycaemic activity of submerged G. lucidum cultures in type 2 diabetic rats, which has been closely associated with the modulation of carbohydrate digestion and metabolism. Antioxidant activities of submerged G. lucidum cultures potentially contribute to their protective effect against diabetes-associated liver and kidney damage. Because of the advantages of submerged cultures over basidiocarp cultivation and their promising hypoglycaemic and antioxidant activities, the products of submerged G. lucidum cultures could prospectively be developed as functional foods or additives for controlling type 2 diabetes.
Author’s Contribution
G. J. Tsai conceived, designed and supervised this study. W. K. Lin performed the experiments. C. H. Huang and S. H. Chang analyzed the data and wrote the paper. G. J. Tsai revised the manuscript.
Disclosure Statement
There are no conflicts of interest associated with this publication and there has been no significant financial support for this work that could have influenced its outcome.
Data Availability
The data used to support the findings of this study are available from the corresponding author upon request.
Additional information
Funding
References
- Bach EE, Hi EMB, Martins AMC, Nascimento PAM, Wadt NSY. 2018. Hypoglicemic and hypolipedimic effects of Ganoderma lucidum in streptozotocin-induced diabetic rats. Med (Basel). 5(3):78.
- Boyko EJ, Magliano D, Shaw JE. 2007. Insulin sensitivity and insulin secretion determined by homeostasis model assessment and risk of diabetes in a multiethnic cohort of women: the women’s health initiative observational study: response to Song et al. Diabetes Care. 30(11):e110. author reply e111.
- Chang M-Y, Tsai G-J, Houng J-Y. 2006. Optimization of the medium composition for the submerged culture of Ganoderma lucidum by Taguchi array design and steepest ascent method. Enzyme Microb Technol. 38(3–4):407–414.
- Dahlqvist A. 1968. Assay of intestinal disaccharidases. Anal Biochem. 22(1):99–107.
- Erickson RH, Zakim D, Vessey DA. 1978. Preparation and properties of a phospholipid-free form of microsomal UDP-glucuronyltransferase. Biochem. 17(18):3706–3711.
- Girometta C. 2019. Antimicrobial properties of fomitopsis officinalis in the light of its bioactive metabolites: a review. Mycol. 10(1):32–39.
- Glinghammar B, Rafter I, Lindström AK, Hedberg JJ, Andersson HB, Lindblom P, Berg AL, Cotgreave I. 2009. Detection of the mitochondrial and catalytically active alanine aminotransferase in human tissues and plasma. Int J Mol Med. 23(5):621–623.
- He CY, Li WD, Guo SX, Lin SQ, Lin ZB. 2006. Effect of polysaccharides from Ganoderma lucidum on streptozotocin-induced diabetic nephropathy in mice. J Asian Nat Prod Res. 8(8):705–711.
- Heymann AD, Cohen Y, Chodick G. 2012. Glucose-6-phosphate dehydrogenase deficiency and type 2 diabetes. Diabetes Care. 35(8):e58.
- Jia J, Zhang X, Hu Y-S, Wu Y, Wang Q-Z, Li -N-N, Guo Q-C, Dong X-C. 2009. Evaluation of in vivo antioxidant activities of Ganoderma lucidum polysaccharides in STZ-diabetic rats. Food Chem. 115(1):32–36.
- Jiang X, Chang H, Zhou Y. 2015. Expression, purification and preliminary crystallographic studies of human glutamate oxaloacetate transaminase 1 (GOT1). Protein Expr Purif. 113:102–106.
- Ma H-T, Hsieh J-F, Chen S-T. 2015. Anti-diabetic effects of Ganoderma lucidum. Phytochem. 114:109–113.
- Manna P, Ghosh J, Das J, Sil PC. 2010. Streptozotocin induced activation of oxidative stress responsive splenic cell signaling pathways: protective role of arjunolic acid. Toxicol Appl Pharmacol. 244(2):114–129.
- Masiello P, Broca C, Gross R, Roye M, Manteghetti M, Hillaire-Buys D, Novelli M, Ribes G. 1998. Experimental NIDDM: development of a new model in adult rats administered streptozotocin and nicotinamide. Diabetes. 47(2):224–229.
- Murat JC, Serfaty A. 1974. Simple enzymatic determination of polysaccharide (glycogen) content of animal tissues. Clin Chem. 20(12):1576–1577.
- Neyrinck AM, Pachikian B, Taminiau B, Daube G, Frederick R, Cani PD, Bindels LB, Delzenne NM. 2016. Intestinal sucrase as a novel target contributing to the regulation of glycemia by prebiotics. PLoS One. 11(8):e0160488.
- Ogbole OO, Nkumah AO, Linus AU, Falade MO. 2019. Molecular identification, in vivo and in vitro activities of Calvatia gigantea (macro-fungus) as an antidiabetic agent. Mycol. 10(3):166–173.
- Olokoba AB, Obateru OA, Olokoba LB. 2012. Type 2 diabetes mellitus: a review of current trends. Oman Med J. 27(4):269–273.
- Pan D, Zhang D, Wu J, Chen C, Xu Z, Yang H, Zhou P. 2013. Antidiabetic, antihyperlipidemic and antioxidant activities of a novel proteoglycan from ganoderma lucidum fruiting bodies on db/db mice and the possible mechanism. PLoS One. 8(7):e68332.
- Raza H, Prabu SK, John A, Avadhani NG. 2011. Impaired mitochondrial respiratory functions and oxidative stress in streptozotocin-induced diabetic rats. Int J Mol Sci. 12(5):3133–3147.
- Seto SW, Lam TY, Tam HL, Au AL, Chan SW, Wu JH, Yu PH, Leung GP, Ngai SM, Yeung JH, et al. 2009. Novel hypoglycemic effects of Ganoderma lucidum water-extract in obese/diabetic (+db/+db) mice. Phytomed. 16(5):426–436.
- Shieh YH, Liu CF, Huang YK, Yang JY, Wu IL, Lin CH, Li SC. 2001. Evaluation of the hepatic and renal-protective effects of Ganoderma lucidum in mice. Am J Chin Med. 29(3–4):501–507.
- Sloop KW, Showalter AD, Cox AL, Cao JX, Siesky AM, Zhang HY, Irizarry AR, Murray SF, Booten SL, Finger EA, et al. 2007. Specific reduction of hepatic glucose 6-phosphate transporter-1 ameliorates diabetes while avoiding complications of glycogen storage disease. J Biol Chem. 282(26):19113–19121.
- Teng BS, Wang CD, Zhang D, Wu JS, Pan D, Pan LF, Yang HJ, Zhou P. 2012. Hypoglycemic effect and mechanism of a proteoglycan from ganoderma lucidum on streptozotocin-induced type 2 diabetic rats. Eur Rev Med Pharmacol Sci. 16(2):166–175.
- Vitak TY, Wasser SP, Nevo E, Sybirna NO. 2015. The effect of the medicinal mushrooms Agaricus brasiliensis and Ganoderma lucidum (Higher basidiomycetes) on the erythron system in normal and streptozotocin-induced diabetic rats. Int J Med Mushrooms. 17(3):277–286.
- Wachtel-Galor S, Yuen J, Buswell JA, Benzie IFF. 2011. Ganoderma lucidum (Lingzhi or Reishi): A medicinal mushroom. In: nd, Benzie IFF, Wachtel-Galor S, editors. Herbal medicine: biomolecular and clinical aspects. Boca Raton (FL): CRC Press/Taylor & Francis.
- Wang CD, Teng BS, He YM, Wu JS, Pan D, Pan LF, Zhang D, Fan ZH, Yang HJ, Zhou P. 2012. Effect of a novel proteoglycan PTP1B inhibitor from Ganoderma lucidum on the amelioration of hyperglycaemia and dyslipidaemia in db/db mice. Br J Nutr. 108(11):2014–2025.
- Wolosin JD, Edelman SV. 2000. Diabetes and the gastrointestinal tract. Clin Diabetes. 18(4):148.
- Wu Y, Ding Y, Tanaka Y, Zhang W. 2014. Risk factors contributing to type 2 diabetes and recent advances in the treatment and prevention. Int J Med Sci. 11(11):1185–1200.
- Xiao C, Wu QP, Cai W, Tan JB, Yang XB, Zhang JM. 2012. Hypoglycemic effects of Ganoderma lucidum polysaccharides in type 2 diabetic mice. Arch Pharm Res. 35(10):1793–1801.
- Zheng J, Yang B, Yu Y, Chen Q, Huang T, Li D. 2012. Ganoderma lucidum polysaccharides exert anti-hyperglycemic effect on streptozotocin-induced diabetic rats through affecting β-cells. Comb Chem High Throughput Screen. 15(7):542–550.