
ABSTRACT
Emerging evidence showed that lncRNAs play important roles in a wide range of biological processes of fungi such as Saccharomyces cerevisiae. However, systemic identification of lncRNAs in non-model fungi is a challenging task as the efficiency of rRNA removal has been proved to be affected by mismatches of universal rRNA-targeting probes of commercial kits, which forces deeper sequencing depth and increases costs. Here, we developed a low-cost and simple rRNA depletion method (rProbe) that could efficiently remove more than 99% rRNA in both yeast and mycelium samples of Talaromyces marneffei. The efficiency and robustness of rProbe were demonstrated to outperform the Illumina Ribo-Zero kit. Using rProbe RNA-seq, we identified 115 differentially expressed lncRNAs and constructed lncRNA-mRNA co-expression network related to dimorphic switch of T. marneffei. Our rRNA removal method has the potential to be a useful tool to explore non-coding transcriptomes of non-model fungi by adjusting rRNA probe sequences species specifically.
Introduction
Long non-coding RNAs (lncRNAs) have been demonstrated to widely participate in development, metabolism and other key biological processes in organism systems (Fatica and Bozzoni Citation2014; Beermann et al. Citation2016). Compared with hundreds of thousands of well-studied lncRNAs in human (Volders et al. Citation2019), only a small set of fungal lncRNAs are confirmed to be functional (Cemel et al. Citation2017; Kim et al. Citation2018; Till et al. Citation2018; Wang et al. Citation2019a, Citation2019b; Ye et al. Citation2021). Genome-wide screening of fungal transcriptomes is warranted to improve the understanding of fungal lncRNAs as most non-model fungi without comprehensive lncRNA annotations. To increase sequencing depth and reduce cost, rRNA removal preparation is recommended for non-coding transcriptome analysis (Stark et al. Citation2019). However, one of the commonly used commercial kits for fungal rRNA depletion, the Ribo-Zero Gold rRNA Removal Kit from Illumina, has been discontinued in 2018.
As so far, most rRNA-depleted libraries are constructed by enzyme-based hybridisation subtraction or custom-designed biotinylated oligonucleotide pull-down (Stark et al. Citation2019). Probes that are complementary to rRNA allow selective depletion in both approaches and thus become a key step in determining removal efficiency. The mismatches in target rRNA sequences have been proved to be an important factor affecting the rRNA residual ratio due to the sequence-specific hybridisation between the targeted rRNA and the oligonucleotide probes (Huang et al. Citation2020; Zeng et al. Citation2020). However, fungal rRNA sequences vary largely among main clades (Tedersoo et al. Citation2018), which makes it difficult for universal rRNA probes, such as Saccharomyces cerevisiae-based kits, to provide effective and stable rRNA removal effects for fungi with diverse phylogenetic affinity (Telzrow et al. Citation2021).
Here, we developed a highly efficient species-specific rRNA removal protocol (rProbe) based on Talaromyces marneffei, a dimorphic fungus that exists in the form of both mould and yeast. Our results showed that compared with Illumina Ribo-Zero Kit, the rProbe had a more efficient and stable rRNA removal performance without disrupting transcriptome. Using rProbe RNA-seq, we constructed a dimorphic switch-related network consisting of DE lncRNAs as well as co-expressed mRNAs. Our rProbe protocol could be a valuable tool for mining fungal non-coding transcriptomes by adjusting the sequence of the rRNA probes.
Results
rProbe protocol enables to remove approximately 99% of rRNA in the yeast phase of Talaromyces marneffei
rRNA subtraction hybridisation strategies are widely used for mammalian rRNA depletion (Morlan et al. Citation2012; Adiconis et al. Citation2013). We thus aimed to implement and modify a similar method for fungi rRNA depletion. Among the ribosomes of eukaryotes, 5S, 5.8S, 18S and 28S are the most abundant rRNA transcripts, accounting for a rough 80% of the total RNA (Kraus et al. Citation2019; Phelps et al. Citation2021). In order to deplete most of the rRNAs from total RNA, we first identified the 5S, 5.8S, 18S and 28S, as well as ITS1 and ITS2 rRNA sequences based on draft genome from Illumina assemblies of Talaromyces marneffei PM1 strain (Woo et al. Citation2011) using software RNAmmer (Lagesen et al. Citation2007) and blasted against NCBI to confirm the rRNA sequences. The rDNA tandem repeats consisting of 5S rRNA of 116 bp, 5.8S rRNA of 158 bp, 18S rRNA of 1800 bp as well as 28S rRNA of 3459 bp were identified in the PM1 strain.
To ensure efficient removal, the length of rRNA-targeting oligonucleotide DNA probes should satisfy specific rRNA fragments binding, as well as be accessible to the rRNA structural hidden sites (Culviner et al. Citation2020; Huang et al. Citation2020). On that account, continuous complementary DNA probes with the length of 80-nt were synthesised in a head-to-tail manner and evaluated for possible cross-hybridisation using BLAST (Altschul et al. Citation1990). Then the probes were mixed with the input total RNA at the ratio of probes/rRNA equal to 2:1. At a final volume of 15 μL, the probe and target rRNA were hybridised through a gradient cooling programmeat a controlled rate of −0.1°C/s from 95°C to 22°C. Subsequently, the rRNA fragments in the hybrid double-stranded structure formed during this process were specifically hydrolysed by RNase H. The remaining DNA probes were then removed from the mixture by DNase I, and the RNA was purified for downstream analysis ().
Figure 1. Efficiency of the rProbe protocol in yeast samples of T. marneffei.
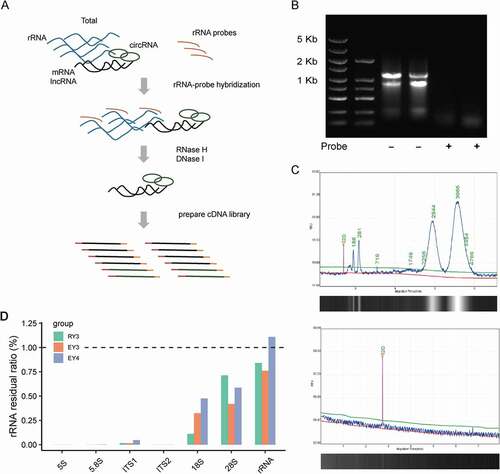
In order to assess the efficiency of rRNA removal, total RNA samples and processed RNA samples were analysed by RNA agarose gel electrophoresis and Qseq1 Bio-Fragment Analyser (BiOptic Inc., China). Compared with untreated RNA samples, no significant residual 18S and 28S rRNA was detected after rRNA depletion (). To further accurately evaluate the efficiency of our rRNA removal protocol, we prepared the rRNA depletion strand-specific libraries for Illumina sequencing. Using paired-end sequencing, paired reads >65 million were generated in each library. By mapping reads of RNA-seq to the 5S, 5.8S 18S, 28S, ITS1 and ITS2 rRNA sequences, all the rRNA depletion libraries showed a low residual of rRNA less than 1% (). We then calculated the fraction of reads aligning to different rRNAs in each sample separately. Among the remaining rRNA fragments, 18S and 28S rRNA accounted for the main parts, which may be due to the complex secondary structure restricting the binding of the probe (Supplementary Table S1). These results showed that the rRNA probes were effective to remove the vast majority of ribosomal RNAs.
rProbe protocol is comparable to commercial Ribo-Zero Kit in rRNA removal efficiency and transcriptome disruption
In order to compare the rRNA depletion efficiency of rProbe protocol and commercially available kits in yeast RNA samples of T. marneffei, we downloaded RNA-seq of T. marneffei PM1 strain processed by Ribo-Zero Gold rRNA Removal Kit from NCBI (Lau et al. Citation2018) and mapping reads to rRNA sequences as above. To check whether the potential batch effect was caused by experimental artefacts that would confound our results, we performed principal component analysis (PCA) between our RNA-seq and downloaded data as suggested (Reese et al. Citation2013). No significant batch effects were observed (Supplementary Fig. S1 A and B). Through mapping RNA-seq to the target rRNA sequences, we calculated the rRNA residual ratio of samples separately. The rRNA residual ratio of rProbe protocol was lower than that of Ribo-Zero Kit (p value = 0.02875, Wilcoxon rank-sum exact test), with better robustness among samples (). To confirm whether the sequencing depth and library size have an impact on the efficiency quantitation, we randomly sampled 1 million reads from the original fastq files of each sample and to achieve equivalent library size. The rRNA residual ratio proved to be independent of the sequencing depth (Supplementary Fig. S1 C).
Figure 2. rRNA removal efficiency of rProbe method and Illumina Ribo-Zero Kit.
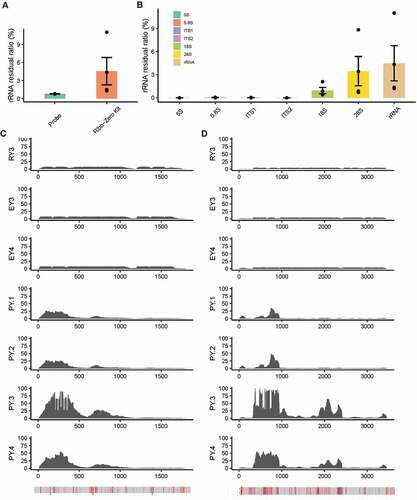
Noted that the 28S rRNA removal efficiency of the Ribo-Zero Kit was unstable (), we wonder whether the instability performance of the Ribo-Zero Kit was related to the differences of rRNA sequences between T. marneffei and S. cerevisiae. We then calculated the base depth distribution of 18S and 28S rRNA in RNA-seq of rProbe and Ribo-Zero Kit. In contrast with rProbe libraries, reads mapping to 18S and 28S rRNA in Ribo-Zero Kit libraries formed distinct peaks in mismatch enriched regions (). Notably, most of the mismatch-dependent rRNA residue was enriched in the 5ʹ end, while the fewer rRNA residual in the 3ʹ end may be related to the slight degradation of rRNA in the process of RNA extraction.
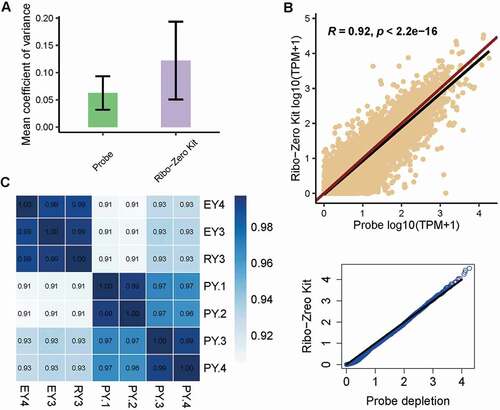
In order to determine whether our rProbe protocol could be applied to construct high-quality RNA-seq libraries, we first compared the evenness of transcript coverage between the two methods. The mean coefficient of variation (CV) for the 1,000 most highly expressed genes in each library was calculated, and the lower CV value indicated the lower variation biological replicates (). We next performed gene expression correlation analysis between these libraries. Overall, the rProbe samples showed high consistency with Ribo-Zero Kit samples (R = 0.92, p-value < 2.2e-16, ), and the consistency remained even in low sequencing depth when all libraries were adjusted to one million paired reads (R = 0.93, p-value < 2.2e-16, Supplementary Fig. S1 D). Quantile–quantile plot showed points lie on a straight line, indicating there was no global shift in expression profile between the rProbe method and Ribo-Zero Kit (). Further analysis showed that the libraries generated from the rProbe protocol were highly correlated with the Ribo-Zero Kit libraries separately, with correlation coefficients exceeding 0.9 (). The consistency among rProbe samples was 0.99, suggesting the good repeatability of our methods. Totally, RNA-seq of rProbe rRNA depletion method exhibited similar transcriptomic landscapes with Ribo-Zero Kit.
Figure 3. RNA-seq quality control metrics.
rProbe method has concordant gene expression with poly(A) selection method in both yeast and mycelium samples
We further applied the rProbe protocol to mycelium RNA samples of T. marneffei. As expected, the rProbe method was able to efficiently deplete 99% rRNA as that of yeast RNA samples (). RNA-seq analysis revealed that there was no significant removal difference between different phases (p value = 0.1, Wilcoxon rank-sum exact test). We then examined the consistency of samples, correlation coefficients among mycelium groups were greater than 0.9, and the correlation coefficients between mycelium samples and yeast samples were above 0.8, indicating libraries processed by the rProbe method had strong robustness.
Figure 4. Efficiency of the rProbe protocol in mycelium samples of T. marneffei.
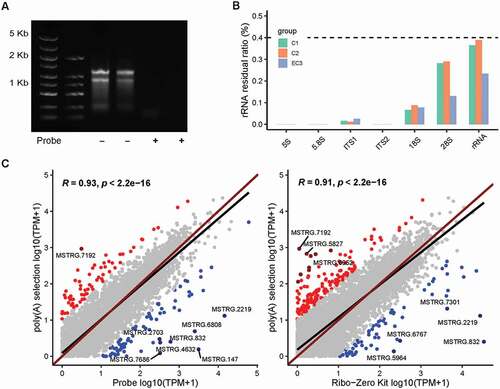
Since a subset of lncRNA transcripts lack poly(A) tails, poly(A) selection isolated only the 3ʹ-most portion of transcripts, leading to bias in enriching low abundance poly(A) tail RNAs and non-poly(A) tail lncRNAs (Yang et al. Citation2011). We reasoned that the rProbe RNA-seq was able to enrich non-poly(A) tail lncRNA that were neglected in the poly(A) selection method. Therefore, we prepared poly(A) libraries and sequenced mycelium and yeast samples of T. marneffei. In order to understand the differences between the two methods as a whole, we compared the expression of the global transcript between the rRNA depletion method and poly(A) selection libraries (). In general, libraries of the rProbe method and Ribo-Zero Kit were highly correlated to the poly(A) selection method (R = 0.93, 0.91 separately). Although the overall concordance was high, less than 3% of genes showed exceptionally high expressions and large differences between the two protocols, without cross-hybridisation with the rRNA probes.
Construction of lncRNA-mRNA co-expression dimorphic switch network
We then identified lncRNA of rProbe libraries and poly(A) libraries. In the rProbe libraries, over 10% of the reads were identified as lncRNA reads, while in the poly(A) selection library only 6% of reads were detected as lncRNA, suggesting the rRNA depletion method enable to enrich lncRNAs (). Final lncRNA candidates were determined by the intersection of CPC2, CNCI, PfamScan and FEElnc. A total 229 of lncRNAs with the threshold of TPM >1 in all three samples of yeast or mycelium phase were kept for downstream analysis. Differentially expressed lncRNAs (DE-lncRNAs) between yeast and mycelium were determined using DEseq2. Overall, 115 lncRNA transcripts were differentially expressed between yeast and mycelium (p < 0.05 and fold change > 2), in which 89 lncRNAs were up-regulated in the yeast phase and 26 lncRNAs were up-regulated in mycelium (). Intriguingly, we found among all DE-lncRNAs, five lncRNAs could only be detected in rProbe libraries but not in poly(A) selection libraries, which indicates that they might not have poly(A) tails.
Figure 5. Identification of DE lncRNA between mycelium and yeast.
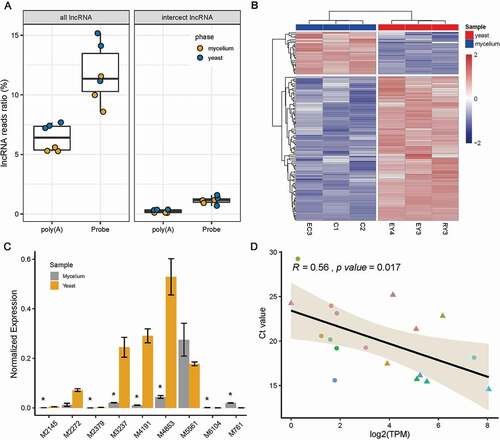
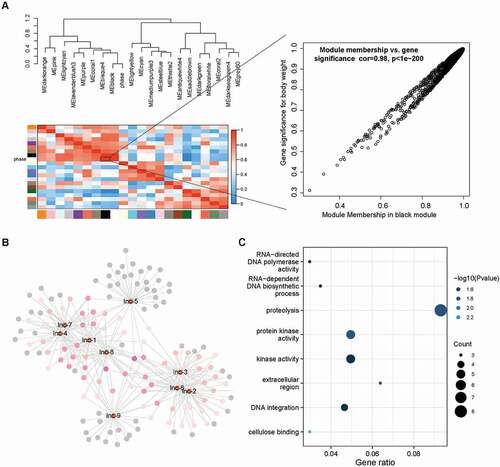
In order to understand the potential function of lncRNAs in dimorphic switch, we first selected the top 10 DE lncRNAs for RT-qPCR validation, excluding the lncRNA MSTRG.6914 which did not have available primers (). Due to the inevitable influence of mRNA isoforms, the expression levels of selected lncRNAs did not show an ideal linear relationship with RNA-seq data (). We next constructed the lncRNA-mRNA co-expression network of the top 10 DE lncRNA using WGCNA. Remarkably, nine of the top 10 DE-lncRNA were enriched in the black module which was high correlative with the phenotype of yeast/mycelium (correlation coefficient = 0.98 and p value < 1e-05, ). According to the value of intra-module connectivity, genes co-expressed with DE lncRNA ranked in the top 30 were selected for visualisation using Cytoscape (). LncRNA-1, lncRNA-4, lncRNA-7 and lncRNA-8 formed a highly connected centre with the hub gene MSTRG.6454 which highly co-expressed with seven of the top 10 DE lncRNA. Gene MSTRG.6454 encoded a homolog of D-aminopeptidase, which is reported to be one of the important components of fungal secretome that associated with the fungal environmental adaptation (Muszewska et al. Citation2017). Functional enrichment analysis of co-expressed genes showed Gene Ontology terms related to “metabolism of nucleic acid”, “protein kinase activity”, “oxidative stress”, “carbohydrate metabolism” as well as “cellulose binding” were significantly enriched in the network (, Supplementary Table S2).
Figure 6. Co-expression network of top 10 DE-lncRNA.
Discussion
High-throughput RNA sequencing and analysis revolutionise microbial research and provide new insights into coding and/or non-coding transcriptome profiling. As rRNA constitutes a very large fraction of the total RNA, RNA enrichment is an essential step to reduce cost and increase the sequencing depth of desired transcripts. Thus, numerous rRNA-depletion methods have been developed including commercial kits such as Ribo-Zero Gold rRNA Removal Kit (Yeast), which has not yet launched new alternatives for fungi after discontinued. Several studies have reported the species-specific RNA-seq library construction methods that use hybrid-subtraction strategies for rRNA removal in higher eukaryotes and bacteria (Giannoukos et al. Citation2012; Thompson et al. Citation2020; Zeng et al. Citation2020). Recently, a similar method has also been reported in Cryptococcus neoformans (Telzrow et al. Citation2021).
In this study, we described the establishment of an efficient rRNA depletion method (rProbe) to understand the lncRNAome of T. marneffei during the dimorphic switch. For both forms of mycelium and yeast, the low rRNA residual and slight target-off effect were sufficient for most RNA-seq study conditions. Systematic RNA-seq data comparison indicated that RNA-seq from rProbe libraries yielded a highly correlative transcriptomic landscape with that of the commonly used Illumina Ribo-Zero Kit and poly(A) selection method. However, about 3% of genes showed significant expression changes between rProbe and poly(A) selection method, as same as the disturbance have been reported (Morlan et al. Citation2012; Zhao et al. Citation2018; Thompson et al. Citation2020). Culture condition and library preparation that makes the RNA pool differ in concentration and composition might be one of the explanations.
Approximately half of the lncRNAs showed different expression levels between mycelium and yeast forms, as previously mentioned lncRNA plays fine-tuning roles in environment response (Beermann et al. Citation2016; Yu et al. Citation2019). In the co-expression network, we found mRNAs co-expressed with lncRNA were mainly enriched in fungal metabolism, protease activity and development processes, which supported that metabolically pre-adapted is a key step of the dimorphic switch in order to adapt host environment (Pasricha et al. Citation2017).
In conclusion, through species-specific rRNA probes, we offered an efficient and scalable tool for rRNA removal that is available to both yeast and mycelium RNA samples of T. marneffei. The rProbe has the potential to be applied to other fungi by adjusting the sequence of oligonucleotide probes.
Materials and methods
Strains, media and culture conditions
Wild type T. marneffei strain PM1 used in this study was separated from an HIV-negative patient from Hong Kong (Woo et al. Citation2011). Yeast was cultivated at 37°C in Sabouraud Dextrose Agar (SDA) medium for 7 days and mycelium was cultivated at 25°C in the SDA medium for 7 days. All cultures were harvested and purified as described (Yang et al. Citation2014), and immediately frozen in liquid nitrogen for total RNA extraction.
RNA extraction
Total RNA of T. marneffei was extracted by E.Z.N.A. Fungal RNA Mini Kit. RNA quality was determined using Qsep1 Bio-Fragment Analyser (BiOptic, Inc., New Taipei City, Taiwan). RNA with Q-score > 8 were selected for downstream processing.
rRNA depletion
Ribosomal RNA sequences, including 5S, 5.8S, 18S, 28S, ITS1 and ITS2 rRNA, were searched in the whole genome using RNAmmer (Lagesen et al. Citation2007). Similar to the previous method (Phelps et al. Citation2021), non-overlapping complementary DNA probes of 80-nt were synthesised (TSINGKE, Beijing, China) and mixed, in which 18S and 28S rRNA with a final concentration of 1 μM, and ITS1, ITS2, 5S as well as 5.8S rRNA with a final concentration of 0.05 μM. The primer sequences are listed in Supplementary Table S2. First, a total of 2 μg RNA was mixed with 1 μL rRNA probes mixture and 2 μL of hybridisation buffer (750 mM Tris-HCl, 750 mM NaCl) at a final volume of 15 μL, and incubated at 95°C for 2 minutes, slowly cooled to 22°C with the speed of −0.1°C/s, then kept at 22°C for 5 minutes. Next, the rRNA in DNA-RNA hybrid molecules were hydrolysed by thermostable RNase H mixture (NEB, USA) at 50°C for 30 minutes according to protocol. Residual DNA probes were removed by DNase I mixture (NEB, USA) at 37°C for 30 minutes. Finally, RNA was isolated and purified by 2.5 × RNA Clean Beads (Vazyme, Nanjing, China) and stored at −80°C. In order to ensure a valid comparison of the rRNA depletion efficiency, all samples were performed on the same input RNA, with the comparisons repeated using biological triplicate for yeast and mycelium respectively.
rProbe RNA-seq library construction and sequencing
Libraries of rProbe protocol were prepared with VAHTS Universal V6 RNA-seq Library Prep Kit for Illumina (Vazyme, Nanjing, China) according to the manufacturer’s protocol. Briefly, the purified RNA was fragmented into short fragments of 250–300 nt using fragmentation buffer and reverse transcribed into cDNA with random hexamer primers. The second strands were synthesised with dUTP for the strand-specific RNA-seq library. Samples were mixed with adaptors, respectively, for ligation and amplification. Final PCR products were purified with 0.9 × DNA Clean Beads (Vazyme, Nanjing, China) and sequenced on Illumina HiSeq Xten platform (Annoroad, Beijing, China) using paired-end sequencing (2 × 150 bases). About 60 to 90 million pairs of reads were generated from each library (n = 6).
Analysis of rRNA depletion efficiency
Adapters and low quality reads were removed by cutadapt (Martin Citation2011) according to library-specific adapter ligation. After quality control, sequencing reads were aligned to rRNA sequences of T. marneffei using Bowtie2 (Langmead and Salzberg Citation2012) with parameters of – qc-filter and – no-unal for calculating the rRNA residual ratio. To quantify the efficiency of probe-based rRNA depletion, rRNA residual ratio was defined as all reads mapping to 5S, 5.8S, 18S, 28S, ITS1 and ITS2 rRNA loci divided by total reads number in each sample. Then residual rRNA reads were removed by parameter – un-conc-gz and clean reads were obtained and used for downstream processes.
Ploy(A)+ selection RNA-seq library construction and sequencing
A total of 6 libraries of three biological replicates from each condition were constructed using oligo (dT) enrichment independently. Sequencing was carried out on an Illumina HiSeq X platform with paired-end 150 bp reads.
RNA-sequencing read mapping and normalisation
All probe-based rRNA depletion libraries and poly(A)+ libraries were mapped to the Talaromyces marneffei PM1 genome assembly using Hisat2 (Kim et al. Citation2019) with the following parameters -max-intronlen 2000 and – rna-strandness RF, guided by Talaromyces marneffei PM1 annotation file. The gene-level expression matrix was calculated by Stringtie (Pertea et al. Citation2016). All reads mapping to specific genome regions were then summed and normalised by transcripts per million (TPM). This normalised quantity was then used in all downstream analyses. The same analysis pipeline was performed on the Illumina Ribo-Zero Gold rRNA Removal Kit processed RNA-seq download from NCBI (PRJNA353903).
Identification and different expression of lncRNA
Transcripts of all samples were deduplicated and merged by Stringtie merge command, and annotated by gffcompare (Pertea and Pertea Citation2020). Transcripts with annotation of “opxui” were selected as potential lncRNA. Then lncRNAs were filtered by intersecting the results of CPC2 (Kang et al. Citation2017), PfamScan (Finn et al. Citation2014), CNCI (Sun et al. Citation2013) and FEElnc (Wucher et al. Citation2017), and transcripts with TPM > 1 were selected as the final lncRNA sets. Differentially expressed lncRNAs between the yeast and mycelium samples were identified using R package DEseq2 (Love et al. Citation2014), with the criterion of |log2 fold change| > 1 and adjust p value < 0.05.
lncRNA co-expression network construction
The R package WGCNA (Langfelder and Horvath Citation2008) was used to construct a lncRNA-mRNA co-expression network. In brief, a gene co-expression network was constructed based on RNA-seq of libraries and the estimated best soft threshold power was selected. Average linkage hierarchical clustering was performed and network modules were identified using a dynamic tree cut algorithm with a minimum cluster size of 30. The correlation between modules and phenotype (yeast and mycelium) was calculated. Finally, modules containing DE lncRNA and high correlation were selected for visualisation using Cytoscape.
Co-expressed gene annotation and GO Analysis
Co-expressed genes were annotated using Blastx (https://blast.ncbi.nlm.nih.gov) and UniProt database (https://www.uniprot.org). R package clusterProfiler (Wu et al. Citation2021) was used to perform enrichment analysis on gene function annotations (GO entries).
Data and code availability
The code used for RNA-seq analysis in this study is available in a GitHub repository (https://github.com/yukkikou/rRNA_depletion_2021).
The raw and processed sequencing data are available on BIG Submission and will be accessible through project number PRJCA006591.
Supplemental Material
Download Zip (1.8 MB)Disclosure statement
No potential conflict of interest was reported by the author(s).
Supplementary material
Supplemental data for this article can be accessed here.
Additional information
Funding
Related Research Data
References
- Adiconis X, Borges-Rivera D, Satija R, DeLuca DS, Busby MA, Berlin AM, Sivachenko A, Thompson DA, Wysoker A, Fennell T, et al. 2013. Comparative analysis of RNA sequencing methods for degraded or low-input samples. Nat Methods. 10(7):623–629. DOI:https://doi.org/10.1038/nmeth.2483.
- Altschul SF, Gish W, Miller W, Myers EW, Lipman DJ. 1990. Basic local alignment search tool. J Mol Biol. 215(3):403–410. DOI:https://doi.org/10.1016/S0022-2836(05)80360-2.
- Beermann J, Piccoli M-T, Viereck J, Thum T. 2016. Non-coding RNAs in development and disease: background, mechanisms, and therapeutic approaches. Physiol Rev. 96(4):1297–1325. DOI:https://doi.org/10.1152/physrev.00041.2015.
- Cemel IA, Ha N, Schermann G, Yonekawa S, Brunner M. 2017. The coding and noncoding transcriptome of Neurospora crassa. BMC Genomics. 18(1):978. DOI:https://doi.org/10.1186/s12864-017-4360-8.
- Culviner PH, Guegler CK, Laub MT, Cooper VS. 2020. A simple, cost-effective, and robust method for rRNA depletion in RNA-sequencing studies. mBio. 11(2). DOI:https://doi.org/10.1128/mBio.00010-20.
- Fatica A, Bozzoni I. 2014. Long non-coding RNAs: new players in cell differentiation and development. Nat Rev Genet. 15(1):7–21. DOI:https://doi.org/10.1038/nrg3606.
- Finn RD, Bateman A, Clements J, Coggill P, Eberhardt RY, Eddy SR, Heger A, Hetherington K, Holm L, Mistry J, et al. 2014. Pfam: the protein families database. Nucleic Acids Res. 42( Database issue):D222–D230. DOI:https://doi.org/10.1093/nar/gkt1223.
- Giannoukos G, Ciulla DM, Huang K, Haas BJ, Izard J, Levin JZ, Livny J, Earl AM, Gevers D, Ward DV, et al. 2012. Efficient and robust RNA-seq process for cultured bacteria and complex community transcriptomes. Genome Biol. 13(3):R23. DOI:https://doi.org/10.1186/gb-2012-13-3-r23.
- Huang Y, Sheth RU, Kaufman A, Wang HH. 2020. Scalable and cost-effective ribonuclease-based rRNA depletion for transcriptomics. Nucleic Acids Res. 48(4):e20. DOI:https://doi.org/10.1093/nar/gkz1169.
- Kang Y-J, Yang D-C, Kong L, Hou M, Meng Y-Q, Wei L, Gao G. 2017. CPC2: a fast and accurate coding potential calculator based on sequence intrinsic features. Nucleic Acids Res. 45(W1):W12–W16. DOI:https://doi.org/10.1093/nar/gkx428.
- Kim D, Paggi JM, Park C, Bennett C, Salzberg SL. 2019. Graph-based genome alignment and genotyping with HISAT2 and HISAT-genotype. Nat Biotechnol. 37(8):907–915. DOI:https://doi.org/10.1038/s41587-019-0201-4.
- Kim W, Miguel-Rojas C, Wang J, Townsend JP, Trail F, Di Pietro A. 2018. Developmental dynamics of long noncoding rna expression during sexual fruiting body formation in Fusarium graminearum. mBio. 9(4):e01292–01218. DOI:https://doi.org/10.1128/mBio.01292-18.
- Kraus AJ, Brink BG, Siegel TN. 2019. Efficient and specific oligo-based depletion of rRNA. Sci Rep. 9(1):12281. DOI:https://doi.org/10.1038/s41598-019-48692-2.
- Lagesen K, Hallin P, Rødland EA, Staerfeldt H-H, Rognes T, Ussery DW. 2007. RNAmmer: consistent and rapid annotation of ribosomal RNA genes. Nucleic Acids Res. 35(9):3100–3108. DOI:https://doi.org/10.1093/nar/gkm160.
- Langfelder P, Horvath S. 2008. WGCNA: an R package for weighted correlation network analysis. BMC Bioinform. 9(1):559. DOI:https://doi.org/10.1186/1471-2105-9-559.
- Langmead B, Salzberg SL. 2012. Fast gapped-read alignment with Bowtie 2. Nat Methods. 9(4):357–359. DOI:https://doi.org/10.1038/nmeth.1923.
- Lau SKP, Lo GCS, Chow FWN, Fan RYY, Cai JJ, Yuen K-Y, Woo PCY, Taylor JW. 2018. Novel partitivirus enhances virulence of and causes aberrant gene expression in Talaromyces marneffei. mBio. 9(3):e00947–00918. DOI:https://doi.org/10.1128/mBio.00947-18.
- Love MI, Huber W, Anders S. 2014. Moderated estimation of fold change and dispersion for RNA-seq data with DESeq2. Genome Biol. 15(12):550. DOI:https://doi.org/10.1186/s13059-014-0550-8.
- Martin M. 2011. Cutadapt removes adapter sequences from high-throughput sequencing reads. MBnet J. 17(1):10–12. DOI:https://doi.org/10.14806/ej.17.1.200.
- Morlan JD, Qu K, Sinicropi DV, Dadras SS. 2012. Selective depletion of rRNA enables whole transcriptome profiling of archival fixed tissue. PLoS One. 7(8):e42882. DOI:https://doi.org/10.1371/journal.pone.0042882.
- Muszewska A, Stepniewska-Dziubinska MM, Steczkiewicz K, Pawlowska J, Dziedzic A, Ginalski K. 2017. Fungal lifestyle reflected in serine protease repertoire. Sci Rep. 7(1):9147. DOI:https://doi.org/10.1038/s41598-017-09644-w.
- Pasricha S, MacRae JI, Chua HH, Chambers J, Boyce KJ, McConville MJ, Andrianopoulos A. 2017. Extensive metabolic remodeling differentiates non-pathogenic and pathogenic growth forms of the dimorphic pathogen. Front Cell Infect Microbiol. 7:368. doi:https://doi.org/10.3389/fcimb.2017.00368.
- Pertea G, Pertea M. 2020. GFF utilities: GffRead and GffCompare. F1000Res. 9:304. doi:https://doi.org/10.12688/f1000research.23297.1.
- Pertea M, Kim D, Pertea GM, Leek JT, Salzberg SL. 2016. Transcript-level expression analysis of RNA-seq experiments with HISAT, StringTie and Ballgown. Nat Protoc. 11(9):1650–1667. DOI:https://doi.org/10.1038/nprot.2016.095.
- Phelps WA, Carlson AE, Lee MT. 2021. Optimized design of antisense oligomers for targeted rRNA depletion. Nucleic Acids Res. 49(1):e5. DOI:https://doi.org/10.1093/nar/gkaa1072.
- Reese SE, Archer KJ, Therneau TM, Atkinson EJ, Vachon CM, de Andrade M, Kocher J-PA, Eckel-Passow JE. 2013. A new statistic for identifying batch effects in high-throughput genomic data that uses guided principal component analysis. Bioinformatics (Oxford, England). 29(22):2877–2883. DOI:https://doi.org/10.1093/bioinformatics/btt480.
- Stark R, Grzelak M, Hadfield J. 2019. RNA sequencing: the teenage years. Nat Rev Genet. 20(11):631–656. DOI:https://doi.org/10.1038/s41576-019-0150-2.
- Sun L, Luo H, Bu D, Zhao G, Yu K, Zhang C, Liu Y, Chen R, Zhao Y. 2013. Utilizing sequence intrinsic composition to classify protein-coding and long non-coding transcripts. Nucleic Acids Res. 41(17):e166. DOI:https://doi.org/10.1093/nar/gkt646.
- Tedersoo L, Sánchez-Ramírez S, Kõljalg U, Bahram M, Döring M, Schigel D, May T, Ryberg M, Abarenkov K. 2018. High-level classification of the Fungi and a tool for evolutionary ecological analyses. Fungal Divers. 90(1):135–159. DOI:https://doi.org/10.1007/s13225-018-0401-0.
- Telzrow CL, Zwack PJ, Esher Righi S, Dietrich FS, Chan C, Owzar K, Alspaugh JA, Granek JA, Andrews B. 2021. Comparative analysis of RNA enrichment methods for preparation of Cryptococcus neoformans RNA sequencing libraries. G3 (Bethesda). 11(11). DOI:https://doi.org/10.1093/g3journal/jkab301.
- Thompson MK, Kiourlappou M, Davis I. 2020. Ribo-Pop: simple, cost-effective, and widely applicable ribosomal RNA depletion. RNA. 26(11):1731–1742. DOI:https://doi.org/10.1261/rna.076562.120.
- Till P, Pucher ME, Mach RL, Mach-Aigner AR. 2018. A long noncoding RNA promotes cellulase expression in Trichoderma reesei. Biotechnol Biofuels. 11(1):78. DOI:https://doi.org/10.1186/s13068-018-1081-4.
- Volders P-J, Anckaert J, Verheggen K, Nuytens J, Martens L, Mestdagh P, Vandesompele J. 2019. LNCipedia 5: towards a reference set of human long non-coding RNAs. Nucleic Acids Res. 47(D1):D135–D139. DOI:https://doi.org/10.1093/nar/gky1031.
- Wang Y, Shao Y, Zhu Y, Wang K, Ma B, Zhou Q, Chen A, Chen H. 2019a. XRN1-associated long non-coding RNAs may contribute to fungal virulence and sexual development in entomopathogenic fungus Cordyceps militaris. Pest Manag Sci. 75(12):3302–3311. DOI:https://doi.org/10.1002/ps.5453.
- Wang Z, Jiang Y, Wu H, Xie X, Huang B. 2019b. Genome-wide identification and functional prediction of long non-coding RNAs involved in the heat stress response in Metarhizium robertsii. Front Microbiol. 10:2336. doi:https://doi.org/10.3389/fmicb.2019.02336.
- Woo PCY, Lau SKP, Liu B, Cai JJ, Chong KTK, Tse H, Kao RYT, Chan C-M, Chow W-N, Yuen K-Y. 2011. Draft genome sequence of Penicillium marneffei strain PM1. Eukaryotic Cell. 10(12):1740–1741. DOI:https://doi.org/10.1128/EC.05255-11.
- Wu THE, Xu S, Chen M, Guo P, Dai Z, Feng T, Zhou L, Tang W, Zhan L, Fu X, et al. 2021. clusterProfiler 4.0: a universal enrichment tool for interpreting omics data. The Innovation. 2(3):100141. DOI:https://doi.org/10.1016/j.xinn.2021.100141.
- Wucher V, Legeai F, Hédan B, Rizk G, Lagoutte L, Leeb T, Jagannathan V, Cadieu E, David A, Lohi H, et al. 2017. FEELnc: a tool for long non-coding RNA annotation and its application to the dog transcriptome. Nucleic Acids Res. 45(8):e57. DOI:https://doi.org/10.1093/nar/gkw1306.
- Yang E, Chow W-N, Wang G, Woo PCY, Lau SKP, Yuen K-Y, Lin X, Cai JJ, Richardson PM. 2014. Signature gene expression reveals novel clues to the molecular mechanisms of dimorphic transition in Penicillium marneffei. PLoS Genet. 10(10):e1004662. DOI:https://doi.org/10.1371/journal.pgen.1004662.
- Yang L, Duff MO, Graveley BR, Carmichael GG, Chen L-L. 2011. Genomewide characterization of non-polyadenylated RNAs. Genome Biol. 12(2):R16. DOI:https://doi.org/10.1186/gb-2011-12-2-r16.
- Ye G, Zhang L, Zhou X. 2021. Long noncoding RNAs are potentially involved in the degeneration of virulence in an aphid-obligate pathogen, Conidiobolus obscurus (Entomophthoromycotina). Virulence. 12(1):1705–1716. DOI:https://doi.org/10.1080/21505594.2021.1938806.
- Yu Y, Zhang Y, Chen X, Chen Y. 2019. Plant noncoding RNAs: hidden players in development and stress responses. Annu Rev Cell Dev Biol. 35(1):407–431. DOI:https://doi.org/10.1146/annurev-cellbio-100818-125218.
- Zeng Z, Huang B, Wang X, Fan J, Zhang B, Yang L, Feng Y, Wu X, Luo H, Zhang J, et al. 2020. A reverse transcriptase-mediated ribosomal RNA depletion (RTR2D) strategy for the cost-effective construction of RNA sequencing libraries. J Adv Res. 24:239–250. DOI:https://doi.org/10.1016/j.jare.2019.12.005.
- Zhao S, Zhang Y, Gamini R, Zhang B, Von Schack D. 2018. Evaluation of two main RNA-seq approaches for gene quantification in clinical RNA sequencing: polyA+ selection versus rRNA depletion. Sci Rep. 8(1):4781. DOI:https://doi.org/10.1038/s41598-018-23226-4.