
ABSTRACT
Remotely-sensed Leaf Area Index (LAI) is vital to describe the vegetation canopy and assess plant growth condition and healthy status. However, sufficient instant ground LAI samples are pre-required for calibration or validation, which is generally difficult to collect. We proposed a method, LAI-Mobile, to use mobile phones with low-cost fisheye lens to take fisheye photos and to invert LAIs, which may be popularized for ordinary people to generate big volume of LAI sample data. The feasibility of LAI-Mobile was tested by comparing with LAI−2200 and GF-1 satellite data (GF = high resolution) in a pest-invaded Yunnan pine forest area in Yunnan province of China. Results show significant correlation between LAI-2200 and LAI-Mobile data for forest plots with coefficient of determination (R2) = 0.706 and Root Mean Square Error (RSME) = 0.241, and GF-1 satellite images (R2 = 0.659 and RMSE = 0.268). The linear regression shows a good agreement between the Moderate Resolution Imaging Spectroradiometer (MODIS) LAI product and the inverted GF-1 LAI, with R2 = 0.649, RMSE = 0.795. Despite larger uncertainty for single fisheye image than LAI-2200, LAI-mobile can provide fast and convenient method to collect large amount of LAI, which will support remote sensing inversion of LAI at large scale.
1. Introduction
Leaf Area Index (LAI) is the ratio of foliage area to ground area (Pince Citation1993), which is essential to vegetation canopy in ecology and forestry (Heiskanen et al. Citation2013). LAI has been widely used to monitor the growth and changes of vegetation (Liu, Qi, and Jin Citation2013), to drive ecological system, crop growth and forest growth models (Myneni et al. Citation2002; Soonnentaga et al. Citation2007), plant productivity (Scurlock, Cramer, and Olson et al. Citation1999), and pest invasion (Wang, Zhang, and Luo et al. Citation2006).
Remotely-sensed LAI is vital to describe the vegetation canopy and assess plant growth condition and healthy status. However, sufficient of instant ground LAI data is pre-required for calibration or validation. The traditional fully or partially harvesting method is accurate but time-consuming and tedious (Chen et al. ; Ren and Peng Citation1997). Therefore, indirect measurement methods using optical sensors have been widely used (Ma et al. Citation2008; Wilhelm, Ruwe, and Schlemmer Citation2000; Pacheco, Bannari, and Staenz et al. Citation2001; Garrigues, Shabanov, and Swanson et al. Citation2008; Shi, Gao, and Xie Citation2005), including plant canopy analyzer such as LAI −2000 or LAI-2200 (LI-COR) and TRAC utilizing the radiation transmission proportion (Hicks and Lascano Citation1995; Shawn, Douglas, and Stith Citation2013; He et al. Citation2015) and hemispherical photography such as WinSCANOPY or HemiView (Yang Citation2011; Liu, Qi, and Jin Citation2013).
However, current indirect measurement methods are still limited for large area LAI data collection. The instruments are still relatively expensive (~30,000 US dollars) if equipping for too many people at large area, which may not ensure the seasonal consistency of LAI at different locations. On the other hand, normal people like grass-roots staff cannot operate the instruments well without specified background knowledge training. In the basic level of forest farms, there are many staff working on forest fire patrol, resource survey, and pest forecast. If they agree to use low-cost and easy-to-use LAI instruments on hand, sufficient LAI data would be collected fast at large area, which may be popularized for ordinary people to generate big volume of LAI data.
The objective of this paper is to propose a new method called LAI-Mobile to use mobile phones with low-cost fisheye lens to collect forest LAI. A case study was conducted on Yunnan pine forests in Yunnan province of China to verify the feasibility of LAI-Mobile by comparing with LAI −2200 and GF-1 satellite data.
2. Materials and methods
2.1. Study area and sampling design
The study area is located at the Tianfeng Mountain (25°18′ N, 100°54′ E), Xiangyun county, Yunnan province, SW of China (see ). The elevation spans from 1720 to 2570 meters. The area has a typical mid temperate subtropical plateau monsoon climate, with distinct dry and wet seasons, and concentrated rainfall and strong solar light. The mean annual average temperature is 14.2°C. The mean annual rainfall is 783.7 mm. The perennial main wind direction is the southwest.
Figure 1. Sample plots (red dots) located at Xiangyun county in Yunnan province, SW of China (the image is GF-1 satellite image with 16 m resolution).
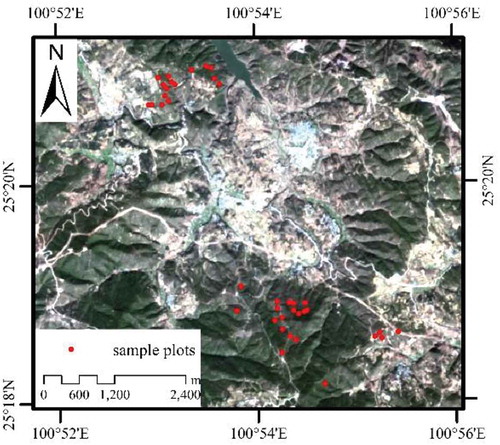
As the dominated tree species, the plantation of Yunnan pine (Pinus yunnanensis) suffered from a drought event and then serious beetle attacks in 2015 leading to relatively sparse distribution. Moderate damages by pine shoot beetles were evident in the plantation, and no pest control had been done. Trees ranged from 4–10 m in height; and the diameter at breast height (DBH) was less than 17 cm. 23 Yunnan pines plots were sampled including health and threatened stands to test the accuracy of tree LAI measurement and LAI inversion.
2.2. LAI-Mobile
2.2.1. Acquisition of stand canopy image based on a smart phone
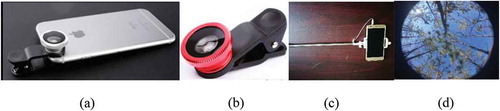
LAI-Mobile consists of a smart mobile phone (e.g. iPhone) and a cheap spherical lens like LQ – cjgj003 costing only 20 US dollars (see ). The basic principle is to take hemispherical images using the phone camera equipped with the fisheye lens. In each plot (see the red dots in ), the instrument was paralleled to the slop and lifted in 1.3 meters over the ground by selfie stick when measuring the plots LAI, which were measured and averaged. The phone location and orientation angles are recorded using measurements from the embedded GPS sensor and gyroscope sensor respectively.
Figure 2. LAI-Mobile instrument: (a) smart phone equipped with spherical lens; (b) spherical lens; (c) mobile phone fixed with selfie stick; (d) an example fisheye image acquired by LAI-Mobile paralleled to slop in 1.3 meters over ground.
2.2.2. Using CAN-EYE to classify hemispherical images and inverse LAI
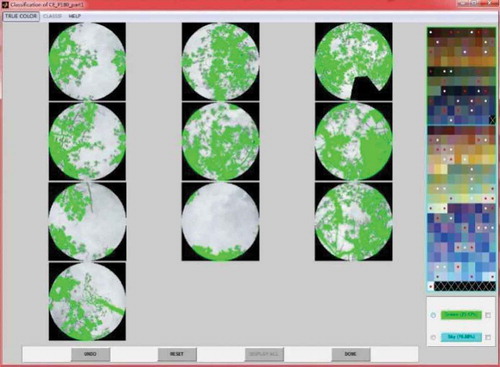
The image pre-processing and LAI extraction from the image are conducted using CAN – EYE V6.1 software (http://www6.paca.inra.fr/can-eye/Download). The major pre-processing steps include screening bad quality images, classifying sky from canopies, and estimating the pixel proportion of leaves in the whole image. The advantage of CAN-EYE is the batch processing for photos in the same folder using one configuration. provides a classification result of 10 images with CAN-EYE, in which the green pixels represent vegetation and the others are sky.
Figure 3. Hemispherical images classification with CAN-EYE, green pixels represent the vegetation.
The classified images were transformed into binary images for measuring the gap fraction, once the colors of the classes were allocated completely. Then, CAN-EYE processes the images to derive the LAI variables from the bi-directional gap fraction. If the gap fraction P0 can be derived from hemispherical images, LAI can be inversed based on the Poisson model:
Where is the view direction,
is zenith angle and
is the azimuth angle;
is the projection function.
The indirectly measured LAI is normally effective leaf area index with clumping effect (Chen and Black Citation1992). Based on a planimeter with possible allometric relationship to reduce the sampling, the CAN-EYE can simultaneously solve the clumping index and ‘true’ LAI as follows:
Where is the clumping index (
< 1),
is the inverted LAI of Equation (1).
2.3. Validation methods
2.3.1. Comparing to LAI-2200 plant canopy analyzer
Along with LAI-Mobile, a LAI-2200 Plant Canopy Analyzer (PCA) (LI-COR Inc.) was used to measure the LAI in all plots. Considering the stability and reliable measurement, LAI-2200 has been widely used and accepted viewed as ‘true values’ (Liao, Gai, and Yao et al. Citation2015; Fang et al. Citation2014; Paulo, Steven, and David et al. Citation2013), which will be used to validate LAI-mobile. The instrument was always held about 1.6 m above the background soil. The operator was staying below the instrument during measurement. Two radiation measurements made in open area and below the canopy determine canopy light interception ratios T(θ), or gap fractions, at 5 view angles (7°, 23°, 38°, 53°, and 68°). According to the Beer-Lambert Law and Miller formula (Miller, Citation1967), these ratios are linked to LAI.
Where the subscript refers to the
view angle;
is the constant weighting factor for the view angle
. The five weighting factors are 0.041, 0.131, 0.201, 0.290, and 0.337.
2.3.2. Comparing to MODIS LAI products
Using GF-1 NDVI (normalized differential vegetation index) products (16 m) as a bridge, plot LAI point-scale data were correlated to 16 m image (GF-1) and then averaged to 500 m scale (MODIS). GF-1 is the first of a series of high-resolution optical Earth observation satellites of China. Launched in April 2013, GF-1 is equipped with two panchromatic (2 m) and multispectral (8 m) cameras (PMC), and four WFV cameras with 16 m resolution. Each WFV camera has four bands (B1/blue: 0.45–0.52 µm, B2/green: 0.52–0.59 µm, B3/red: 0.63–0.69 µm, and B4/NIR: 0.77–0.89 µm) and a combined swath of 830 km. As a first trial, only one GF-1 WFV2 image (Jan 7th, 2017) centered at (100°42′ E, 25°36′ N) was used to calculate NDVI. Based on LAI-mobile LAI values, the regression between NDVI and LAI was fitted.
Then, the inversed LAI image from NDVI was upscaled to 500 m and compared to the MODIS LAI product. The LAI product is MCD15A2H, selected though LAADS DAAC website (https://ladsweb.modaps.eosdis.nasa.gov/). MCD15A2H is level 4 data and an 8-day composite product. LAI data sets were downloaded covering the period between 25 December 2016 and 1 February 2017, which are the closest to the field data collection dates.
3. Results and discussion
3.1. Comparison with LAI-2200
shows the highly consisting of 23 available measurement plots between LAI-Mobile produced and LAI-2200 using (R2 = 0.706, RSME = 0.241). LAI-Mobile is over-estimated for LAI less than 1.0, while under-estimated when LAI greater than 1.0.
Figure 4. The correlation analysis of LAI in 23 measurement plots between LAI-Mobile and LAI-2200.
3.2. Comparison with satellite image
The regression model between GF-1 NDVI and LAI-Mobile was found as: LAI = 0.1739e2.938×(NDVI), a good agreement was shown in , with R2 = 0.655 and RMSE = 0.446.
Figure 5. The regression model between LAI-Mobile data and GF-1 NDVI.
The LAI-2200 data were used to validate the accuracy of LAI retrieval results from GF-1 NDVI using the regression model in . Relatively high accuracy and correlation is found with R2 = 0.659 and RMSE = 0.268 ().
Figure 6. The verification analysis between LAI-Mobile and the LAI retrieved from the plots.
shows a positive correlation between the upscaled LAI-mobile LAI via GF-1 and the MODIS LAI product, with R2 = 0.649 and RMSE = 0.795. MODIS LAI is generally higher than LAI-mobile (almost 40%), which is due to the understory contribution (Wang et al. Citation2004; Yang et al. Citation2006; Liu Citation2014).
Figure 7. Comparison of LAI values between scaled LAI-mobile data and MODIS LAI product retrieval.
4. Conclusions
We presented a new approach LAI-Mobile using smart phones to collect field LAI. Comparing to LAI–2200, LAI-Mobile has comparable accuracy but advantages on higher efficiency (1/4 time of LAI-2200) and significant lower cost. In single observation, LAI-Mobile may have larger error; however large amount of LAI values will greatly reduce random errors. The usages of LAI-Mobile include providing relatively ground calibration or validation data for large scale satellite applications, which was roughly tested on MODIS products via GF-1 image.
However, there is still much work to further explore. First, LAI processing or image uploading should be done automatically in smart phone as APP, which could tell users how to better take fisheye photos instead of using software in computers. Second, the big data concept can be tested by collecting plenty of fisheye images using smart phones. Third, one satellite image should be extended to different images of periods. Despite these limitations, LAI-Mobile will be practical to provide valid data for modern precision forestry.
Additional information
Funding
References
- Chen, J. M., and T. A. Black. 1992. “Defining Leaf Area Index for Non-Flat Leaves.” Plant Cell and Environment 15: 421–429. doi:10.1111/j.1365-3040.1992.tb00992.x.
- Fang, H., W. Li, S. Wei, and C. Jiang. 2014. “Seasonal Variation of Leaf Area Index (LAI) over Paddy Rice Fields in NE China: Intercomparison of Destructive Sampling, LAI-2200, Digital Hemispherical Photography (DHP), and AccuPAR Methods.” Agricultural and Forest Meteorology 198-199: 126–141. doi:10.1016/j.agrformet.2014.08.005.
- Garrigues S., N. V. Shabanov, K. Swanson, J. T. Morisette, F. Baret, R. B. Myneni. 2008. “Intercomparison and Sensitivity Analysis of Leaf Area Index Retrievals from LAI2000, AccuPAR, and Digital Hemispherical Photography over Croplands.” Agriculture and Forest Meteorology 148 (8/9): 1193–1209. doi:10.1016/j.agrformet.2008.02.014..
- He, K. L., M. W. Du, X. L. Tian, D. Y. Xu, X. F. Yin, and Z. H. Li. 2015. “Effect of Cotton Planting Density on the Estimation of Leaf Area Index Using the LAI-2200 Plant Canopy Analyzer.” Crops, (5): 123–127. doi:10.16035/j.issn1001-7283.2015.05.023.
- Heiskanen, J., M. Rautiainen, P. Stenberg, M. Mõttus, and V.-H. Vesanto. 2013. “Sensitivity of Narrowband Vegetation Indices to Boreal Forest LAI, Reflectance Seasonality and Species Composition.” ISPRS Journal of Photogrammetry and Remote Sensing 78: 1–14. doi:10.1016/j.isprsjprs.2013.01.001.
- Hicks, S. K., and R. J. Lascano. 1995. “Estimation of Leaf Area Index for Cotton Canopies Using the LI-COR LAI-2000 Plant Canopy Analyzer.” Agronomy Journal 87: 458–464. doi:10.2134/agronj1995.00021962008700030011x.
- Liao Y. R., Y. Y. Gai, Y. J. Yao, W. J. Fan, X. R. Xu, and B. Y. Yan. 2015. “Validation Methods of LAI Products on the Basis of Scaling Effect [J].” Journal of Remote Sensing 19 (1): 134–152.
- Liu, L. Y. 2014. “Simulation and Correction of Spatial Scaling for Leaf Area Index.” Journal of Remote Sensing 18 (6): 1158–1168. doi:10.11834/jrs.20144103.
- Liu, Z. L., Y. J. Qi, and G. Z. Jin. 2013. “Seasonality and Spatial Pattern of Leaf Area Index of a Spruce-Fir Forest at the Valley in Xiaoxing’an Mountains.” Scientia Silvae Sinicae 49 (8): 58–64. doi:10.11707/j.1001-7488.20130809.
- Ma Z. Q., Q. J. Liu, H. Q. Zeng. X. R. Li, Y. R. Chen, Y. M. Lin, S. H. Zhang, F. T. Yang, and H. Q. Wang. 2008. “Estimation of Leaf Area Index of Planted Forests in Subtropical China by Photogrammetry.” ActaEcologicaSinica 28 (5): 1971–1980.
- Miller, J.B. 1967. “A Formula For Average Foliage Density”. Australian Journal Botany 15: 141–144.
- Myneni, R., S. Hoffman, Y. Knyazikhin, J. L. Privette, J. Glassy, Y. Tian, Y. Wang, et al. 2002. “Global Products of Vegetation Leaf Area and Fraction Absorbed PAR from Year One of MODIS Data.” Remote Sensing of Environment 83: 214–231. doi:10.1016/S0034-4257(02)00074-3.
- Olivas P. C., S. F.Oberbauer, D. B. Clark, D.A Clark, M.G Ryan, and H. Ordoñez. 2013. “Comparison of Direct and Indirect Methods for Assessing Leaf Area Index across a Tropicalrain Forest Landscape.” Agricultural and Forest Meteorology 177: 110–116. doi:10.1016/j.agrformet.2013.04.010.
- Pacheco A., A. Bannari, K. Staenz, and H. McNairn. 2001. “LAI Measurements in White Beans and Corn Canopies with Two Optical Measurements.” In Proceedings of the 8th International Symposium on Physical Measurements and Signatures in Remote Sensing, 374-379. Aussois, France: CNES.
- Pince, J. C. 1993. “Estimating Leaf Area Index from Satellite Data.” Geoscience and Remote Sensing IEEE (Institute Electrical Electronics Engineers) Transactions 31: 717–734. doi:10.1109/36.225538.
- Ren, H., and S. L. Peng. 1997. “Comparison of Methods of Estimation Leaf Area Index in Dinghushan Forests.” Acta Ecologica Sinica 17 (2): 220–223.
- Scurlock J. M., W. Cramer, R. J. Olson, and S. Prince. 1999. “Terrestrial NPP: Toward a Consistent Data Set for Global Model Evaluation.” Ecological Application 9 (3): 913–919.
- Shawn, P. S., E. A. Douglas, and T. G. Stith. 2013. “Spatial and Temporal Validation of the MODIS LAI and FPAR Products across a Boreal Forest Wildfire Chronosequence.” Remote Sensing of Enviroment 133: 71–84. doi:10.1016/j.rse.2013.01.022.
- Shi, Z. Y., X. F. Gao, and Y. Xie. 2005. “The Application of SUNSCAN Canopy Analysis System in the Measurement of Field Ecosystem.” Agriculture Research in the Arid Areas 23 (4): 78–82.
- Soonnentaga, O., J. Talbotb, J. M. Chen, and N. T. Roulet. 2007. “Using Direct and Indirect Measurements of Leaf Area Index to Characterize the Shrub Canopy in an Ombrotrophic Peatland.” Agricultural and Forest Meteorology 144 (3–4): 200–212. doi:10.1016/j.agrformet.2007.03.001.
- Wang L. X. L. Zhang, Y. Q. Luo, J. Shi, H. G. Huang. 2006. “A Study on the Changes of Pinus Massoniana Spatial Pattern by Pine Wood Nematode Invasion Based on Remote Sensing and GIS.” IEEE International Geoscience and Remote Sensing Symposium 2697–2700. doi:10.1109/IGARSS.2006.696.
- Wang, Y. J., C. E. Woodcock, W. Buermann, P. Stenberg, P. Voipio, H. Smolander, T. Häme, et al. 2004. “Evaluation of the MODIS LAI Algorithm at a Coniferous Forest Site in Finland.” Remote Sensing of Environment 91 (1): 114–127. doi:10.1016/j.rse.2004.02.007.
- Wilhelm, W. W., K. Ruwe, and M. R. Schlemmer. 2000. “Comparison of Three Leaf Area Index Meters in a Corn Canopy.” Crop Science 40: 1179–1183. doi:10.2135/cropsci2000.4041179x.
- Yang, L. L. 2011. Research on the Related Indicators of Green Quantity for 8 Kinds of Landscape Plants. Master diss., Southwest University.
- Yang, W. Z., B. Tan, D. Huang, M. Rautiainen, N. V. Shabanov, Y. Wang, J. L. Privette, et al. 2006. “MODIS Leaf Area Index Products: From Validation to Algorithm Improvement.” IEEE Transactions on Geoscience and Remote Sensing 44 (7): 1885–1898. doi:10.1109/TGRS.2006.871215.