
ABSTRACT
The identification of buildings has become a major research focus of settlement mapping with Earth Observation data. Building area or building footprint data is particularly required in research related to population, such as disaster risk management or urban health. This study examined the suitability of machine learning regression-based unmixing for quantifying the pixel-wise share of building area with decametre resolution Copernicus Sentinel-1 and Sentinel-2 imagery. Compared to using a single-step approach directly estimating building area, leading to an over-estimation of building area compared to non-building impervious surface area due to feature similarity, the introduction of a hierarchical approach considerably improved mapping results. While the original mapping resolution was 10 m, we found that building area was most accurately mapped starting at a spatial resolution of 100 m – a resolution well suitable for many urban applications. The proposed approach is widely transferable in space as it used spatially robust spectral-temporal metrics from time series imagery and as its requirements for training data are very limited.
1. Introduction
The global extent of human settlements increased constantly within the last decades and will further increase in the future (UNDESA Citation2019). To date, important advances have been made in mapping these settlements with Earth Observation data, among others resulting in freely available continental and global products (Zhu et al. Citation2019).
A specific research focus when mapping settlements lies on the identification of buildings, as their footprint and the potentially accommodated population are key information serving several research and application domains, such as disaster risk management or urban health research (Leyk et al. Citation2019). Earth Observation data bears great potential to map buildings, e.g., very high-resolution (VHR) imagery is increasingly analysed with convolutional neural networks (CNN) to delineate building footprints at sub-metre resolution (Yang et al. Citation2018; Microsoft Citation2018). Recently, CNN were also successfully used to map building area with decametre resolution Sentinel-2 imagery (Corbane et al. Citation2020). However, CNN-based approaches require high computing power as well as large and high-quality training datasets (Yu et al. Citation2020), and it is yet unclear if and how approaches based on VHR imagery are best transferable to coarser resolution or historic images, to regions not represented by the training data or with limited training data availability and quality (Yu et al. Citation2020).
In contrast to recently emerging CNN-based approaches, more traditional classification-based approaches, for example, using pixel-based spectral features, have been widely established to map building presence and were shown to be applicable to both coarse (Schneider, Friedl, and Potere Citation2009) and high-resolution imagery (Florczyk et al. Citation2016). Global products have been created using decametre Copernicus Sentinel-1/2 (S1/S2) and Landsat data that are freely provided with high temporal frequency, high spatial and temporal consistency. For example, the global presence of buildings at 20 m spatial resolution was mapped in the Global Human Settlement Layer using historic and recent optical Landsat and radar Sentinel-1 imagery with Symbolic Machine Learning (Corbane et al. Citation2019).
Still, discrete classification-based representations of buildings at decametre scale are challenged by the occurrence of mixed pixels in heterogeneous settlement environments. Classification-based datasets that disclose all pixels touched by (also small portions of) a building might show a real commission errors on a local level. Datasets that disclose pixels completely contained by a building can show areal omission errors, as buildings or infrastructure are usually not aligned to a pixel grid. Both errors are most prominent when buildings are smaller than or of similar size to the spatial resolution. Thus, a quantitative approach that represents the fine-grained character of settlement structures is desirable.
Sub-pixel mapping was found to be a promising way for adequately representing such settlement structures (Zhu et al. Citation2019). It was previously used to accurately quantify fractions of different land cover types in general (Walton Citation2008) and impervious surfaces in particular (Brown de Colstoun et al. Citation2017; Wang et al. Citation2019) in urban and other environments, contributing to a more encompassing understanding of land cover gradients across space. Machine learning regression-based unmixing was previously used for regional and national sub-pixel land cover mapping and yielded good results across different land cover types (Xu, Shi, and Pan Citation2018; Senf et al. Citation2020). The use of synthetically mixed spectral data for regression training eliminated the need for comprehensive sub-pixel reference data (Okujeni et al. Citation2017). Importantly, sub-pixel fraction mapping is applicable to coarse- to high-resolution sensors and, thus, also to historic data archives in principle, such as in Schug et al. (Citation2018). The majority of (also recent) studies, however, subsumed fractions of all non-natural surface types into one target class, i.e., impervious surfaces, neglecting the distinction of buildings compared to non-building impervious surfaces such as roads (e.g., Brown de Colstoun et al. Citation2017; Feng and Wang Citation2018; Xu and Somers Citation2021).
The goal of this study was to examine the potential of machine learning regression-based unmixing with synthetically mixed training data and S1/S2 time series imagery to predict sub-pixel building area. In addition to a single-step approach (denoted as ‘direct approach’), where building area is directly predicted from a machine learning regression model, we examined if a ‘hierarchical approach’, i.e., using a multi-level class catalogue with two-step processing, improves mapping results. We specifically addressed the following research questions:
How well does a machine learning regression-based direct unmixing approach with synthetically mixed training data from S1/S2 time series quantify sub-pixel area of buildings?
To what degree is a hierarchical (two-step) mapping approach useful to enhance accuracy?
How is accuracy related to spatial resolution?
2. Materials and methods
2.1. Sentinel-1 and Sentinel-2 time series imagery
We used an integrated S1/S2 highly analysis-ready dataset (hARD) for Germany (area of approximately 358,000 km2). This dataset is a data cube consisting of all available VH-polarized S1 backscatter data from 2017 from the Earth Observation Data Centre (Wagner et al. Citation2014), and all available bottom-of-atmosphere S2 reflectance data (with less than 70% cloud cover) generated with FORCE (Frantz Citation2019) from 2018. We temporally reduced S1/S2 data to a set of spectral-temporal metrics, which are pixel-wise statistical aggregations of all available high-quality observations within a time period (Frantz Citation2019). We here used the 25th, 50th and 75th quantile of annual S2 reflectance, 90th quantile and standard deviation of S2 Tasselled Cap Greenness (TCG) and average S1 VH-polarized backscatter – a combination that provided good results in regression-based unmixing before (Haberl et al. Citation2021). The original spatial resolution was 10 m, which was also our mapping resolution. Pre-processing and data reduction are described in detail in Frantz et al. (Citation2021).
2.2. Regression-Based unmixing with synthetic training data
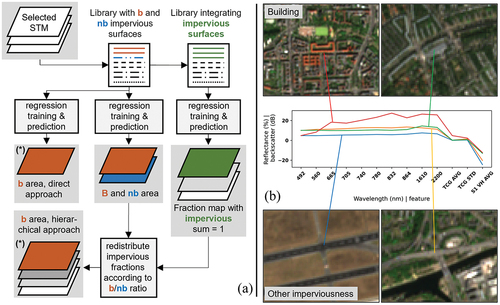
This study used a regression-based unmixing approach with synthetically mixed training data (Okujeni et al. Citation2013, Citation2017). In a first step, reference pixels with pure land surface cover, i.e., a single prevalent surface type per pixel, were selected for target and background classes, respectively. While building surfaces were the only target class in the direct approach, the hierarchical approach also used impervious surfaces, including both building and non-building surfaces as a target class ().
Table 1. Class hierarchy and number of pure reference samples. Bold: Target classes.
This step was followed by extracting S1/S2 spectral-temporal features at the respective reference pixel locations in order to build a spectral-temporal library. Sites with pure surface cover were adopted from Schug et al. (Citation2020), where they were identified based on a set of qualifying spectral criteria and expert knowledge. The number of reference sites for different surfaces can vary considerably according to the intra-class surface diversity, which is higher for non-woody vegetation than for water, as unmixing techniques require the references to represent the whole intra-class spectral range (Powell et al. Citation2007). Random synthetic mixtures of spectral-temporal library features were created at different mixing ratios of target and background classes in order to simulate continuous training data. One advantage of this approach is its limited requirement for training data, both in absolute numbers and in not requiring fractional training data per se. For example, a training feature set for a surface covered with 60% building surface can be artificially created by linearly mixing a pure building surface reference with a pure woody vegetation reference at a ratio of 60:40. A step-by-step description of random synthetic mixing was provided in Cooper et al. (Citation2020). These synthetically mixed features were, together with the respective mixing ratios, then used for training Support Vector Regression models in an ensemble approach. Support Vector Regression is a nonlinear kernel-based machine learning regression that fits a hyperplane to predict a target variable from multi-dimensional input vectors (Schölkopf and Smola Citation2002).
In a first step, the direct approach, building surfaces were used as a separate target class ( – Level 2) and synthetic training mixtures were created using all other classes, including non-building impervious surfaces, as background. Building area was directly modelled in this approach. In a second step, a hierarchical strategy was implemented, that is, a two-step unmixing approach using a hierarchical class catalogue. Here, land cover fractions were generated for all Level 1 classes (); then normalized to a sum of 100%. Concurrently, building and non-building area ( – Level 2), were mapped independently as two separate target classes with individual regression models. The impervious area was eventually redistributed based on the ratio of predicted building and non-building area ().
Figure 1. A: Direct and hierarchical regression-based unmixing approach with synthetically mixed training data from a pure surface feature library. STM = Spectral-temporal metrics, imp = impervious surfaces, b = building, nb = non-building impervious surfaces. Building area in (*) was validated. B: Example feature sets for two selected building and non-building impervious surfaces. TCG = Tasselled Cap Greenness, AVG = Average, STD = Standard Deviation, S1 VH AVG = Average Sentinel-1 VH Backscatter.
2.3. Validation
We validated sub-pixel building area from both the direct and the hierarchical approach with cadaster-based building footprint data. We acquired data for the German Federal States of North Rhine-Westphalia (10,274,058 buildings, area of ca. 34,000 km2, OpenGeodata.NRW 2019), Thuringia (2,243,987 buildings, area of ca. 16,200 km2, Thüringen Citation2019) and Berlin (677,343 buildings, area of ca. 890 km2, Berlin Senate Dpt. for Urb. Dev. and Housing 2009/2010). These states were chosen because of their good reference data availability, but also because they comprise a gradient of urban agglomerations, mid-sized towns and rural areas, roughly representing 14% of Germany’s area and 28% of its population (Office for Federal and State Stat Citation2021). We rasterized footprint data according to the pixel grid of our S1/S2 data cube, where each pixel value corresponded to the relative area covered by a footprint (see e.g., Heris et al. (Citation2020)). Predicted building area was validated with rasterized building footprint data using slope, intercept, root-mean-squared error (RMSE), Mean Error (ME) and the coefficient of determination (R2). We performed a validation at aggregated spatial resolutions of 20 m, 50 m and 100 m. Validation was not performed at 10 m mapping resolution because of potential S2 geolocation errors of 10–12 m (Gascon et al. Citation2017) affecting quality metrics. Berlin was also separately validated in order to potentially identify effects that only occur within dense agglomerations.
3. Results and discussion
We compared the performance of building area mapping in the direct, and the two-step hierarchical approach (). The direct approach yielded an uncertainty (RMSE) of 15.57% at 20 m spatial resolution across all study sites. This decreased to 12.91% at 100 m. In Berlin only, RMSE ranged from 25.03% at 20 m and 19.29% at 100 m. Model slope was 0.51 at 20 m resolution (0.56 in Berlin) and did not change considerably at 100 m. R2 was 0.32 across all sites (0.33 in Berlin) and reached 0.56 (0.62 in Berlin) at 100 m resolution, where the density plots showed notably less scatter. Quality metrics improve at coarser resolution, as mapping errors of adjacent pixels may level out when aggregating data. The relation of predicted and reference-building area became more linear at coarser resolutions, while building area was systematically over-estimated. This could be due to a relatively high feature similarity of building and non-building impervious surfaces, as aggregates, concrete, or asphalt are all used to cover both roofs and roads, which could result in an over-estimation of both surface types. Consequently, we concluded that a direct approach is not adequate and lacks physical meaning in building area mapping.
Figure 2. Density scatter plots of predicted and reference building area for the direct approach (blue) and the hierarchical approach (green) for 20 m (top), 50 m (centre) and 100 m (bottom) resolutions.
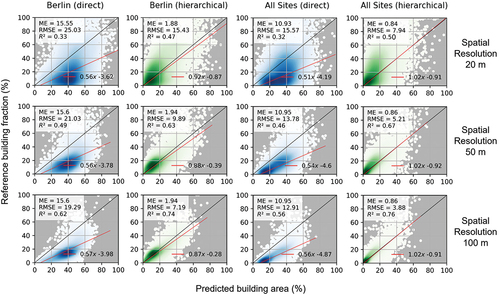
The over-estimation of building area was considerably reduced in the hierarchical approach. We achieved an RMSE between 7.94% at 20 m and 3.88% at 100 m and a considerably reduced ME compared to the direct approach. Model slope was 1.02 across all sites and resolutions. R2 was between 0.50 and 0.76 across all sites and slightly lower for the Berlin site. The hierarchical approach predicted building area much more accurately. The redistribution of building and non-building impervious surface area to the previously predicted total imperviousness prevented the over-estimation that resulted from training data similarity when using a direct approach. Results suggested that relative target class predictions (expressed by the ratio) were more robust to training feature similarity across target classes. One reason could be that in the hierarchical approach, the area of both target classes combined was eventually constrained to the value of previously predicted overall imperviousness that was better separable from its background classes (e.g., vegetation) in the first step. Normalizing all predicted surface-type fractions to a sum of 100% in the first step of the hierarchical approach, where classes were well separable, could further contribute to result quality. In the direct approach, such a normalization would be more difficult as it would also have considerably altered background class (e.g., vegetation) values when both target classes are over-estimated. A full dataset where the hierarchical approach was used to map the whole of Germany, including the three validation states, at 10 m and 100 m spatial resolution is openly available (dataset will be published should this manuscript be accepted), and can be explored in this interactive map viewer: https://ows.geo.hu-berlin.de/webviewer/building-area.
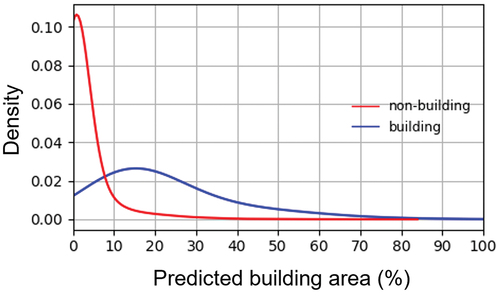
Considerable scatter indicated a limitation of our approach, where building area was particularly under-estimated for densely built-up pixels at the highest spatial resolution (). Here, portions of the area were often incorrectly allocated to the non-building target class, even if not present in the pixel. That might be due to specific effects in the used feature set, such as shadow effects, in radar backscatter that were particularly relevant in dense agglomerations with high building area, where patch heterogeneity is larger. An overall lower model quality in agglomerations, suggested by the Berlin results, supported this assumption. Those errors were reduced by spatial aggregation. At 100 m resolution, the R2 corresponds to the R2 found for imperviousness mapping subsuming building and non-building surfaces in Schug et al. (Citation2020). For two reasons, however, we suggest to not directly map building area at 100 m resolution, but apply a ‘predict-then-aggregate’ approach (Frantz et al. Citation2021) with an initial mapping resolution of 10 m. First, aggregation from high-resolution predictions preserves small, isolated buildings that might not be mapped at 100 m resolution, as they could remain undetected in mixed pixels of 100 m resolution. Second, a density distribution of all predicted building area for all pixels at 10 m spatial resolution with buildings and without buildings in the reference data showed that despite the challenges in validation, high-resolution mapping at 10 m does provide some result quality, as the overlap of both distributions is small (). We argue that an aggregated resolution of 100 m is sufficient for applications, such as population mapping (Leyk et al. Citation2019) or (sub-)city-scale urban climate research (Parsaee et al. Citation2019).
Figure 3. Density distribution of predicted building area at 10 m spatial resolution, split by pixels occupied by buildings (red) and non-building impervious surfaces (blue) in the three validated federal states.
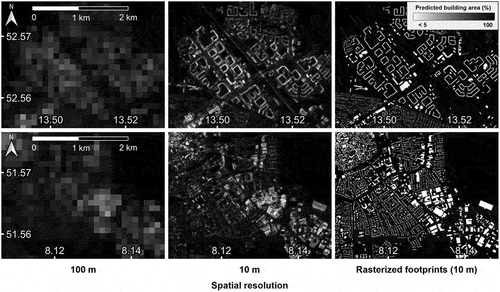
Spatially, the best results could be achieved in areas with low density detached building structures and low to high density attached buildings (). Rarely, low building area was mapped over road and rail infrastructure or large, bright concrete impervious surfaces. Building area in industrial sites with large buildings and bright roofs tended to be under-estimated. Generally, non-building impervious surfaces, such as roads, runways, parking lots or railways were very well separated from buildings. Challenges remained in areas with heterogeneous built-up structures. Here, neighbouring pixels with buildings and non-building impervious surfaces could not always be reliably separated. Potentially, an extended unmixing procedure including data derivatives such as texture could be useful to overcome those challenges.
Figure 4. Predicted building area from the hierarchical approach at 100 m (left) and 10 m (centre) resolution, rasterized reference building footprints (right) for two sites in Berlin (top) and North Rhine-Westphalia (bottom). Scale valid for all subfigures.
4. Conclusion
This study proposes a regression-based unmixing approach with synthetically mixed training data to map building area from integrated optical Sentinel-2 and radar Sentinel-1 time series imagery. We conclude that
a hierarchical unmixing architecture for separating building area from that of other impervious surfaces outmatches a direct unmixing approach.
the use of synthetically mixed training data as an input to machine learning regression can be well combined with hierarchical unmixing, allowing for a reduced effort to collect training data and a fairly easy application at national scale.
while the transferability of the approach to regions with different climatic conditions, building materials and, thus, spectral features should be researched, it is potentially applicable to other world regions and previous years due to the use of freely and globally available satellite and the possibility to use it with coarser resolution (e.g., Landsat) data, and devoid of the need of costly and possibly scarce reference data.
the approach provides a possibility for historic building area mapping as a basis for a detailed characterization of settlement development, as it shall be usable with coarser resolution historic imagery (e.g., Landsat).
Data availability
The data is freely available for download (https://doi.org/10.5281/zenodo.6632584) and for visual inspection (https://ows.geo.hu-berlin.de/webviewer/building-area/).
Acknowledgement
We thank the European Space Agency and the European Commission for freely and openly sharing Sentinel imagery and the Earth Observation Data Center for providing pre-processed S1 data. We acknowledge support by the Open Access Publication Fund of Humboldt-Universität zu Berlin.
Disclosure statement
No potential conflict of interest was reported by the author(s).
Additional information
Funding
References
- Berlin Senate Dpt. for Urb. Dev. and Housing. [2009] 2010. “Building Footprints.” Accessed September 20 [2009] 2010. https://fbinter.stadt-berlin.de/fb/index.jsp
- Brown de Colstoun, E. C., C. Huang, P. Wang, J. C. Tilton, B. Tan, J. Phillips, S. Niemczura, P.-Y. Ling, and R. E. Wolfe. 2017. “Global Man-Made Impervious Surface (GMIS) Dataset from Landsat.”
- Cooper, S., A. Okujeni, C. Jänicke, M. Clark, S. van der Linden, and P. Hostert. 2020. “Disentangling Fractional Vegetation Cover: Regression-Based Unmixing of Simulated Spaceborne Imaging Spectroscopy Data.” Remote Sensing of Environment 246: 111856. doi:https://doi.org/10.1016/j.rse.2020.111856.
- Corbane, C., M. Pesaresi, T. Kemper, P. Politis, A. J. Florczyk, V. Syrris, M. Melchiorri, F. Sabo, and P. Soille. 2019. “Automated Global Delineation of Human Settlements from 40 Years of Landsat Satellite Data Archives.” Big Earth Data 3 (2): 140–169. doi:https://doi.org/10.1080/20964471.2019.1625528.
- Corbane, C., V. Syrris, F. Sabo, P. Politis, M. Melchiorri, M. Pesaresi, P. Soille, and T. Kemper. 2020. “Convolutional Neural Networks for Global Human Settlements Mapping from Sentinel-2 Satellite Imagery.” Neural Comput & Applic. doi:https://doi.org/10.1007/s00521-020-05449-7.
- Feng, B., and J. Wang. 2018. “Evaluation of Unmixing Methods for Impervious Surface Area Extraction from Simulated EnMap Imagery.” IEEE Journal of Selected Topics in Applied Earth Observations and Remote Sensing 11 (6): 1777–1798. doi:https://doi.org/10.1109/JSTARS.2018.2838449.
- Florczyk, A. J., S. Ferri, V. Syrris, T. Kemper, M. Halkia, P. Soille, and M. Pesaresi. 2016. “A New European Settlement Map from Optical Remotely Sensed Data.” IEEE Journal of Selected Topics in Applied Earth Observations and Remote Sensing 9 (5): 1978–1992. doi:https://doi.org/10.1109/JSTARS.2015.2485662.
- Frantz, D. 2019. “Force—landsat + Sentinel-2 Analysis Ready Data and Beyond.” Remote Sensing 11 (9): 1124. doi:https://doi.org/10.3390/rs11091124.
- Frantz, D., F. Schug, A. Okujeni, C. Navacchi, W. Wagner, S. van der Linden, and P. Hostert. 2021. “National-Scale Mapping of Building Height Using Sentinel-1 and Sentinel-2 Time Series.” Remote Sensing of Environment 252: 112128. doi:https://doi.org/10.1016/j.rse.2020.112128.
- Gascon, F., C. Bouzinac, O. Thépaut, M. Jung, B. Francesconi, J. Louis, V. Lonjou, et al. 2017. ”Copernicus Sentinel-2A Calibration and Products Validation Status.” Remote Sensing 9 (6): 584. DOI:https://doi.org/10.3390/rs9060584.
- Haberl, H., D. Wiedenhofer, F. Schug, D. Frantz, D. Virág, C. Plutzar, K. Gruhler, et al. 2021. ”High-Resolution Maps of Material Stocks in Buildings and Infrastructures in Austria and Germany.” Environmental Science & Technology 55 (5): 3368–3379. DOI:https://doi.org/10.1021/acs.est.0c05642.
- Heris, M. P., N. L. Foks, K. J. Bagstad, A. Troy, and Z. H. Ancona. 2020. “A Rasterized Building Footprint Dataset for the United States.” Scientific Data 7 (1): 207. doi:https://doi.org/10.1038/s41597-020-0542-3.
- Leyk, S., A. E. Gaughan, S. B. Adamo, A. de Sherbinin, D. Balk, S. Freire, A. Rose, et al. 2019. ”The Spatial Allocation of Population: A Review of Large-Scale Gridded Population Data Products and Their Fitness for Use.” Earth System Science Data 11 (3): 1385–1409. DOI:https://doi.org/10.5194/essd-11-1385-2019.
- Microsoft. 2018. US Building Footprints. https://github.com/microsoft/USBuildingFootprints
- Office for Federal and State Stat. 2021. “Fläche Und Bevölkerung Nach Ländern.” Accessed October 28 2021. http://www.statistikportal.de/de/bevoelkerung/flaeche-und-bevoelkerung
- Okujeni, A., S. van der Linden, L. Tits, B. Somers, and P. Hostert. 2013. “Support Vector Regression and Synthetically Mixed Training Data for Quantifying Urban Land Cover.” Remote Sensing of Environment 137: 184–197. doi:https://doi.org/10.1016/j.rse.2013.06.007.
- Okujeni, A., S. van der Linden, S. Suess, and P. Hostert. 2017. “Ensemble Learning from Synthetically Mixed Training Data for Quantifying Urban Land Cover with Support Vector Regression.” IEEE Journal of Selected Topics in Applied Earth Observations and Remote Sensing 10 (4): 1640–1650. doi:https://doi.org/10.1109/JSTARS.2016.2634859.
- OpenGeodata, N.R.W. 2019. “Hausumringe.” Accessed September 20 2021. https://open.nrw/dataset/3f08a580-48ec-43c1-936d-d62f89c21cc9
- Parsaee, M., M. M. Joybari, P. A. Mirzaei, and F. Haghighat. 2019. “Urban Heat Island, Urban Climate Maps and Urban Development Policies and Action Plans.” Environmental Technology & Innovation 14: 100341. doi:https://doi.org/10.1016/j.eti.2019.100341.
- Powell, R. L., D. A. Roberts, P. E. Dennison, and L. Hess. 2007. “Sub-Pixel Mapping of Urban Land Cover Using Multiple Endmember Spectral Mixture Analysis: Manaus, Brazil.” Remote Sensing of Environment 106 (2): 253–267. doi:https://doi.org/10.1016/j.rse.2006.09.005.
- Schneider, A., M. A. Friedl, and D. Potere. 2009. “A New Map of Global Urban Extent from MODIS Satellite Data.” Environmental Research Letters 4 (4): 44003. doi:https://doi.org/10.1088/1748-9326/4/4/044003.
- Schölkopf, B., and A. J. Smola. 2002. “Learning with Kernels: Support Vector Machines, Regularization, Optimization, and Beyond.” edited by Bernhard Schölkopf, Alexander J. Smola, Adaptive computation and machine learning. Cambridge, MA: MIT Press.
- Schug, F., A. Okujeni, J. Hauer, P. Hostert, J. Ø. Nielsen, and S. van der Linden. 2018. “Mapping Patterns of Urban Development in Ouagadougou, Burkina Faso, Using Machine Learning Regression Modeling with Bi-Seasonal Landsat Time Series.” Remote Sensing of Environment 210: 217–228. doi:https://doi.org/10.1016/j.rse.2018.03.022.
- Schug, F., D. Frantz, A. Okujeni, S. van der Linden, and P. Hostert. 2020. “Mapping Urban-Rural Gradients of Settlements and Vegetation at National Scale Using Sentinel-2 Spectral-Temporal Metrics and Regression-Based Unmixing with Synthetic Training Data.” Remote Sensing of Environment 246: 111810. doi:https://doi.org/10.1016/j.rse.2020.111810.
- Senf, C., J. Laštovička, A. Okujeni, M. Heurich, and S. van der Linden. 2020. “A Generalized Regression-Based Unmixing Model for Mapping Forest Cover Fractions Throughout Three Decades of Landsat Data.” Remote Sensing of Environment 240: 111691. doi:https://doi.org/10.1016/j.rse.2020.111691.
- Thüringen, G. 2019. “Hausumringe.” Accessed September 20 2020. https://www.geoportal-th.de/de-de/Downloadbereiche/Download-Offene-Geodaten-Th%C3%BCringen
- UNDESA. 2019. “World Population Prospects: The 2019 Revision.” Accessed July 16 2019. https://population.un.org/wpp/
- Wagner, W., J. Fröhlich, G. Wotawa, R. Stowasser, M. Staudinger, C. Hoffmann, A. Walli, et al. 2014. ”Addressing Grand Challenges in Earth Observation Science: The Earth Observation Data Centre for Water Resources Monitoring.” ISPRS Annals of the Photogrammetry, Remote Sensing and Spatial Information Sciences II (7): 81–88. doi:https://doi.org/10.5194/isprsannals-II-7-81-2014.
- Walton, J. T. 2008. “Subpixel Urban Land Cover Estimation: Comparing Cubist, Random Forests, and Support Vector Regression.” Photogrammetric Engineering & Remote Sensing 74 (10): 1213–1222. doi:https://doi.org/10.14358/PERS.74.10.1213.
- Wang, P., G. Zhang, H. Zhang, Z. Pu, and Z. Xiao. 2019. “Subpixel Mapping of Urban Built-Up Areas Using Spatial-Spectral Information from Satellite Multispectral Remote Sensing Imagery.” Remote Sensing Letters 10 (11): 1028–1037. doi:https://doi.org/10.1080/2150704X.2019.1647367.
- Xu, X., Z. Shi, and B. Pan. 2018. “A Supervised Abundance Estimation Method for Hyperspectral Unmixing.” Remote Sensing Letters 9 (4): 383–392. doi:https://doi.org/10.1080/2150704X.2017.1415471.
- Xu, F., and B. Somers. 2021. “Unmixing-Based Sentinel-2 Downscaling for Urban Land Cover Mapping.” ISPRS Journal of Photogrammetry and Remote Sensing 171: 133–154. doi:https://doi.org/10.1016/j.isprsjprs.2020.11.009.
- Yang, H. L., J. Yuan, D. Lunga, M. Laverdiere, A. Rose, and B. Bhaduri. 2018. “Building Extraction at Scale Using Convolutional Neural Network: Mapping of the United States.” IEEE Journal of Selected Topics in Applied Earth Observations and Remote Sensing 11 (8): 2600–2614. doi:https://doi.org/10.1109/JSTARS.2018.2835377.
- Yu, D., Q. Xu, H. Guo, C. Zhao, Y. Lin, and D. Li. 2020. “An Efficient and Lightweight Convolutional Neural Network for Remote Sensing Image Scene Classification.” Sensors (Basel, Switzerland) 20 (7). doi:https://doi.org/10.3390/s20071999.
- Zhu, Z., Y. Zhou, K. C. Seto, E. C. Stokes, C. Deng, S. T. A. Pickett, and H. Taubenböck. 2019. “Understanding an Urbanizing Planet: Strategic Directions for Remote Sensing.” Remote Sensing of Environment 228: 164–182. doi:https://doi.org/10.1016/j.rse.2019.04.020.