Abstract
This study addressed the integrated effects of season, slope aspect and land use on faunal population density, diversity and Soil Biological Quality (QBS-ar index) in the mid-hills of the central Nepal Himalaya. It also examined the relationship among these soil quality indicators. Faunal density and QBS-ar were significantly higher during the post-monsoon season when compared with the pre-monsoon season. Faunal population density during both the seasons was higher on the northern rather than southern slope aspects. Faunal density was significantly higher in the forest when compared with agricultural land in both the seasons. Soil moisture was positively correlated with soil organic carbon (SOC) and population density, but negatively correlated with soil temperature during the pre-monsoon period. In the post-monsoon season, bulk density was negatively correlated with QBS-ar and population density. Season, slope aspect and land use all had significant effects on the soil quality indicators. This study suggests that high SOC, moisture content and low bulk density lead to increases in population density of soil mesofauna and the QBS-ar index. Therefore, management practices that enhance SOC contents through plant residue retention on farm land, such as farmyard manure application, crop residue mulching and reduced tillage, could increase the numbers and diversity of soil organisms while improving the fertility and productivity of the land.
1. Introduction
Soils are vital natural sources of a wide diversity of ecosystem services and goods that provide many benefits to humans (Daily et al. Citation1997). They support most agro-ecosystem production system through water retention, primary production and nutrient cycling. Soil ecosystem services are emergent properties resulting from a wide range of processes operating at much smaller scale in which invertebrates are involved (Lavelle et al. Citation2006). Soil comprises a diverse assemblage of organisms that is considered to be an important component of the soil ecosystem. These organisms in turn play a significant role in litter decomposition, nutrient and energy cycling and soil formation processes. These soil animals are widely distributed around the world, playing a biological role of great importance both in natural and in agricultural ecosystems (Vu & Nguyen Citation2000). Soil fauna affect the soil physical, chemical and biological properties as well as crop productivity and have a major impact on the detritus food chain in agro-ecosystems (Crossley et al. Citation1989).
Soil micro arthropods have been shown to be sensitive to management practices and their activity correlates with beneficial soil functions (Parisi et al. Citation2005). Modern agriculture has led to major changes in the agro-ecosystem and to severe impacts on the environment (Gardi et al. 2002). Among these impacts, reduction in biodiversity and degradation of soil quality are considered to be major threats for future productivity of cultivated lands (Solbrig Citation1991). Soil physical and chemical properties and habitat conditions of soil fauna become drastically altered when a natural ecosystem is converted to agricultural ecosystem; continuous tillage and use of agro-chemicals have adverse effects on soil biodiversity and faunal habitats (Paoletti et al. Citation1991). The web of life in the soil is a highly complex and integral component of agricultural biodiversity and it has important interrelationships with other components of the ecosystem. Farm management practices influence mesofauna functions and activity both directly and indirectly. Thus, the problem needs to be addressed through an ecosystem approach. The life cycles, abundance and distribution of soil mesofauna are influenced by soil moisture and temperature directly, e.g., through desiccation, and indirectly, through microhabitat modifications and changes in food resources (Berg & Staaf 1980; Stamou & Sgardelis Citation1989; Setala et al. Citation1995; Hasegawa & Takeda Citation1996; Pflung & Wolter Citation2001).
Soil mesofauna density, diversity and activities, however, vary with the season (Lasebiken Citation1974; Badejo & Straalen Citation1993), land use (Begum et al. Citation2009) and slope aspect effect (Stenburg & Shoshny Citation2001; Begum et al. Citation2010). Physical and chemical properties of the soil often vary depending upon slope aspect, position and topography. Topography influences local and regional microclimate by changing the temperature and pattern of precipitation (Tsui et al. Citation2004). The variation due to topographic aspect induced microclimatic differences was observed to cause differences in the soil faunal abundance, diversity, soil moisture, temperature and organic matter contents, influencing soil fertility and affecting soil quality (Begum et al. Citation2010).
Studies examining the seasonal patterns, influence of slope aspect and effects of land use changes on soil faunal population density and diversity in Nepal Himalaya are almost non-existent. Thus, the objective of this study was to determine the seasonal influence, land use and slope aspect effects on soil faunal population density, diversity and soil biological quality index QBS-ar. In addition, we examined the relationship between soil biological properties and abiotic environment (i.e., soil pH, moisture, bulk density, SOC and soil temperature).
2 Materials and methods
2.1 Study area
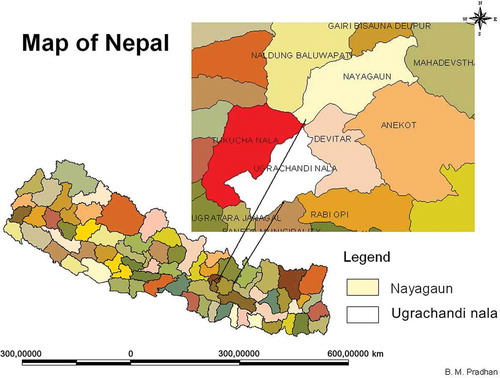
The study was conducted in April and October 2009 along two transects with different topographic aspects, namely north facing slope and south facing slope, in the mid-hills of the central Nepal Himalaya. The south facing slope was located in the village Tanchock in Ugarchandi Nala Village Development Committee (VDC) of Kavre district, about 6 km away from Banepa town, while the north facing slope was located in Khasre village of Nayagaun VDC, about 10 km away from Nagarkot of Bhaktapur district of Nepal. At both the locations, two different land uses, namely agriculture and forest, were chosen. For both the sites, the forests were of mixed type (Schima–Castanopsis interspersed with Pinus roxbourghii and other species).
On the south facing slope, the climate is warm subtropical monsoon with an annual average rainfall of 1672.9 mm (1995–2006 data taken from climatological record of Nepal). More than 80% of the rain fall occurs in between May and September. The average maximum air temperature was 21.85°C and minimum was 11.5°C during the period 1995–2006. The dominated plant species on the south facing slope forest were Gaultheria fragmentissma, Rhodendron arboreum, Kalikat (Nepali name), Jamoun and Prunus cerosoids and Alnus nepalensis. At this site location, the landscape is dominated by agricultural land and farmers typically grew three crops annually. The major crops were maize, wheat, rice and vegetables (potato, mustard, cauliflower, etc.). The agricultural sampling site was at an elevation of 1686 m with coordinates of 27° 39′15.2″ N and 085°32′15.2″ E.
On the north facing slope, the climate was cool subtropical monsoon with an annual average rainfall of 2105 mm (1995–2005) located at 27° 41.969′ N and 085° 32.444′ E with 80% or more of the rainfall occurring between May and September. The average maximum air temperature was 19.96°C and minimum 10.43°C during the period 1995–2006. The dominant forest species were Castanopsis indica, Gaultheria fragrantissma, Alnus nepalensis, Eupetorium odinophorium, Schima wallichi, Eucalyptus species, Prunus cerosoides and Listea monopotella. The major crops grown were rice, wheat, maize and vegetables (cauliflower, mustard, potato, cabbage, etc.) with two crops usually grown annually.
2.2 Sampling design
Sampling was carried out during the pre-monsoon month of April and post-monsoon month of October 2009 at both north and south aspects. On each aspect, two treatments were taken, namely agriculture and forest. Within each treatment or land use type, five replicates were taken to ensure adequate representation. Soil samples were collected by using a simple random sampling technique along a slope transect of each treatment. The topsoil layer was sampled to a depth of 10 cm for faunal extraction using a 10 cm × 10 cm quadrate. Spade and hand trowel were used to excavate the soil, which was transported in labeled polyethylene bags to the lab for faunal extraction. Extra sets of soil samples were taken for determination of physio-chemical properties from a depth of 0–10 cm.
2.3 Faunal extraction
Soil samples were taken to the lab where soil fauna were extracted using a modified Berlese–Tullgren funnel (Phillipson 1971; Coleman et al. Citation2004). Once the extraction (using light for 5–7 days) was completed, the organisms were observed under stereomicroscope at low magnification (20–40×) and identified to the order and family level as appropriate using different keys. The soil biological quality index QBS-ar developed by Parisi et al. (2003) was determined for each sample. The diversity of soil organism was determined using the Shannon Index (H), also known as the Shannon–Wiener Diversity Index (SWDI).
2.4 Physio-chemical soil properties analysis
Prior to soil physical and chemical analysis, all the samples except for soil moisture and bulk density were air dried at room temperature and passed through a 2-mm sieve. Soil moisture was determined by the gravimetric method and bulk density by the core method (Blake & Harte Citation1986). The soil temperature was measured in the field using a digital thermometer (MEXTECH brand). The soil pH was measured using pH probe with glass-calomel electrode and 1:1 soil:water ratio (McLean Citation1982). Particle size analysis was carried out by the hydrometer method using sodium hexametaphosphate as dispersant (Gee & Bauder Citation1986). Soil organic carbon was determined by dry combustion method (Nelson & Sommer Citation1982). Soil total nitrogen (TN) was determined by Kjeldahl method (Bremner & Mulvaney Citation1982), while soil available phosphorus (P) by modified Olsen method (Olsen & Sommer Citation1982). And exchangeable potassium (K) was extracted with ammonium acetate and analyzed by Atomic Absorption Spectrophotometer (AAS).
2.5 Statistical analysis
Data were analyzed using the software SPSS 15.0 (SPSS Inc. 1989–2006). Statistically significant differences in soil biological indicators and physio-chemical indicators with respect to seasons, land use and slope aspect were determined using three-way factorial ANOVA. Pearson’s correlation was calculated to determine the relationship among the soil physio-chemical and biological indicators.
3 Results and discussions
3.1 Seasonal dynamics, slope aspect and land use effects on soil physio-chemical indicators
The texture of the soil did not differ according to the slope aspect but reflected differences due to land use changes. On both the aspects of the agricultural land, the soil was of loam texture, while in the forest the texture was silt loam. Three-factor analyses of variance indicated that most of the physio-chemical properties differed significantly with respect to land use, slope aspect and seasons. Soil organic carbon (SOC) differed significantly with aspect (p <0.002) and land use (p <0.00), but was not according to seasons (). The average SOC content was significantly slightly higher on the north facing slope than the south facing slope in both the seasons (). This is in accordance with Schmidt (Citation1991) who reported north facing slopes to be usually cool and moist, with slower decomposition rates and so contains higher amount of SOC, whereas south aspect tends to be usually warm and dry, as well as contain less vegetation, hence are prone to erosion leading to depletion of SOC. The decomposition rate depends on environmental factors and quality of litter. Among the environmental factors, moisture and temperature significantly affect the rate of decomposition, with favorable moisture and temperature conditions resulting in an exponential increase in decomposition rate. Average SOC was found to be higher in forest when compared with agricultural land in the pre-monsoon season as expected, while in post-monsoon season the trend was reversed (). This was likely due to the residual effect of compost/farmyard manure application by farmers in the agricultural fields during the main cropping period. Interaction between seasons and land use (p <0.043) for soil organic carbon was significant suggesting that the trend in variation of SOC across land use was not consistent (i.e., different) for different seasons. The reason for this might be the addition of manure and compost on agricultural land only during the main growing season, which is during the early monsoon.
Table 1. Soil physico-chemical properties (mean) with respect to slope aspect, land use and seasons
Table 2. Three factorial ANOVA for physico-chemical properties
Soil pH was statistically highly significant according to seasons (p <0.00), aspect (p <0.00) and land use (p <0.00) (). Interaction between seasons and aspect for the soil pH was significant indicating non-uniform trends in pH with seasons for north and south facing slopes. During the pre-monsoon period, mean pH was strongly acidic, whereas in the post-monsoon period it was somewhat less acidic (). The slight increase in soil acidity in the dry season could be due to the ameliorating effect of soil organic manure applications during the main cropping period.
Soil moisture was expectantly significantly higher during the post-monsoon season (p <0.00). Comparing land uses, forest soil had significantly (p <0.00) higher moisture content ( and ) except in the post-monsoon period, but on the south aspect agricultural soil had higher moisture content than forest. This may be due to high slope gradient and shallow soils in the forest leading to lower moisture retention during the post-monsoon period when compared with agricultural land. Interactions between seasons and aspect (p <0.00), seasons and land use (p <0.00) and aspect and land use (p <0.001) for soil moisture were statistically significant, suggesting complex and variable relationships among these parameters.
Soil temperature was observed to be statistically highly significantly different with seasons (p <0.00), aspect (p <0.00) and land use (p <0.001) (). Soil temperature was higher during the pre-monsoon period due to dry weather conditions. Comparing both land-use types, soil temperature was higher in agricultural soil than forest soil except on the south aspect during the post-monsoon period. Forest had canopy cover and litter which retains moisture and makes the soil cooler than the agricultural soil. The aspect of a slope can also have a notable influence the local climate (microclimate). The soil temperature was expectantly higher on the south rather than the north aspect (). This was due to the southern aspect facing directly toward the sunlight, which makes the soil drier and warmer than north facing slope. Similar findings were reported by Begum et al. (Citation2010). The interaction between seasons and land use (P = 0.013) was significant for soil temperature as well, suggesting that apart from slope aspect, vegetative cover and time of the year have a complex influence on the heat retention or cooling of the soil surface.
Bulk density was seen to be highly statistically significantly different with seasons (p < 0.003), land use (p < 0.00) and slope aspect (p < 0.001) (). The average bulk density was higher during the post-monsoon season (1.135 g/cm3) than the pre-monsoon season (1.023 g/cm3) (). The interaction effect between the seasons and aspect (p < 0.00) for soil bulk density was also statistically significant. This is because bulk density is altered by crop and land management practices, especially soil tillage, which affects the soil cover, organic matter content, soil structure and porosity. The results showed that bulk density was higher in farm fields when compared with the forest soil. Cultivation often leads to the destruction of soil structure which results in rapid consolidation and compaction of topsoil with increased bulk density following a heavy pre-monsoon rain event. Moreover, the south aspect had higher bulk density than the north in both the seasons, likely due to lower SOC and poor soil structure on the southern slopes.
TN was not statistically significantly different with seasons, aspect and land use; however, mean values were slightly higher during the post-monsoon season than the pre-monsoon season. Comparing both the aspects, means values on the north (0.26%) was slightly higher than the southern aspect (0.2%). Similarly, comparing both the land use types, TN values were generally higher for forest (0.24%) than agricultural soil (0.21%). This could be attributed to higher SOC contents of forest soil and northern aspect. Zhang et al. (Citation2009) reported that SOC and TN were higher at shady rather than sunny locations at Qilian Mountain in China.
Soil available P was significantly higher (p < 0.002) during the pre-monsoon season compared with post-monsoon season. According to land use type, it was slightly higher in agricultural soil than forest; however, differences were not statistically significant. Slight differences in P could be due to inputs of organic manure and chemical fertilized in main cropping season (pre-monsoon) on agricultural land. Monkiedje et al. (Citation2006) found significantly higher available P and pH in cropland than in the forested soils. Available P was also somewhat higher on the north- rather than the south facing slope.
Exchangeable K was not statistically significantly different with seasons, aspect or land use. Comparing seasons, mean exchangeable. K was slightly higher during the post-monsoon season than the pre-monsoon season. Across land uses, it was higher in agricultural soil than forest soil; southern slopes had more exchangeable K than the north aspect. The status of K and P appears to be influenced by soil type and geology as well as by other factors (Bajracharya & Sherchan Citation2009).
3.2 Seasonal dynamics, slope aspect and land use effect on soil biological indicators
3.2.1 Seasonal dynamics, slope aspect and land use effects on soil faunal population density and diversity
Soil fauna extracted from the samples were grouped into the following categories: Collembola, Acarina, Nematoda, potworms (Enchytridae), small earthworms, Diplopoda, Symphyla, Chilopoda, Pauropoda, Protura, Diplura, microcoleoptera adults and larvae, Lepidoptera, Dipteral adult and larvae, Hymenoptera and Orthroptera. Of these categories, Collembola and Acarina were the dominant groups of soil fauna at the study locations. Among the soil microarthropod groups Collembola and Acari are the most often studied group, due to their high abundance and diversity, as well as important role in key biological processes. They are known to be important in catalyzing organic matter decomposition and central role in the soil food web, making them suitable organisms for use as bioindicators of changes in soil quality, especially due to land use practices and pollution (Rombke et al. Citation2006).
Analysis of variance indicated that soil faunal population density was highly significantly different according to seasons (p < 0.00) as well as land use (p < 0.009), but not significantly different with slope aspect (). The interaction between seasons and land use (p <0.018) was significant for population densities of the soil fauna. Across seasons, soil faunal population density was highest during the post-monsoon, which could be attributed to high soil moisture and SOC content in the soil which provided a favorable habitat for soil mesofauna. In the pre-monsoon period, the total population density of soil fauna was 3765 individuals per m2 compared to 11,245 per m2 during the post-monsoon period ().
Table 3. Soil biological properties (mean) with respect to aspect, land use and seasons
On the south facing slope, during the pre-monsoon season, the density of soil fauna in agricultural land was 3580 per m2 while in forest soil it was 2680 per m2. By contrast, the north facing slope had greater average density of 5320 per m2 in forest soil compared with agricultural soil which had 3480 individuals per m2. However, during the post-monsoon period, on the south facing slope, the density of soil fauna was higher in the forest soil at 13,340 per m2 than on agricultural land, i.e., 6329 per m2. A similar trend of higher faunal population density in the forest (18,260 per m2) and less in the agricultural soil (7060 per m2) was also observed for the northern slope aspect during the post-monsoon period. Moreover, when considering both forest and agriculture land uses, total faunal density was higher on the northern aspect, namely 12,660 per m2 when compared with the southern slope, i.e., 9830 per m2 during the post-monsoon period. According to land use types, in both the seasons, forest had higher faunal abundance than agricultural soil except during the pre-monsoon period on the south aspect. The greater density and cover of vegetation, leaf litter, and moist conditions in the forest produces a more humid and cool soil surface, which is most conducive for all organisms and avoids desiccation from intense sunshine and high evapotranspiration.
The SWDI was weakly statistically significantly different among the seasons (p = 0.052) (), while according to slope aspect and land use it was non-significant. Higher diversity of soil fauna was observed during the post-monsoon season (). This was presumably due to higher moisture and SOC contents in the soil at this time. Clearly, maintenance of organic matter or plant residues on the soil surface enhances soil moisture as well as food sources for soil organisms and provides favorable habitats supporting a high diversity of mesofauna. Such a practice also increases the SOC content and, thereby, the fertility status of agricultural soil, which would lead to greater productivity of the land.
Table 4. Three way ANOVA for biological indicators
3.2.2 Effects on soil biological quality index QBS-ar
The QBS-ar index was highly significantly different by seasons (p <0.001); however, with aspect and land use type, it was non-significant (). The QBS-ar was higher during the post-monsoon season, which was likely also due to higher soil moisture and SOC contents. The average QBS-ar value () was found to be higher for forest soil than agricultural land on both the slope aspects. In both the seasons, the average QBS-ar was observed to be higher on the north aspect when compared with the southern slope. Similar results were reported by Rokaya (Citation2008) and Begum et al. (Citation2010).
Figure 1. Map indicating study area.
3.3 Pearson’s correlation among soil parameters
Pearson’s correlation analyses were also done separately to the pre- and post-monsoon data to determine the relationship among soil properties in different seasons. In the pre-monsoon season, bulk density was strongly negatively correlated with SOC (p <0.01; r = –0.746) and soil moisture (p <0.01; r = –0.752) as shown in . Soil moisture, on the other hand, was negatively correlated with soil temperature (p <0.01; –0.619) and positively correlated with SOC (p <0.01; r = 0.661), and population density (p <0.01; r = 0.565). Similar findings of a negative correlation between SOC and soil pH were reported by McIntosh and Allen (Citation1993). Positive correlations between soil faunal population density and soil moisture have also been reported by others (Reddy Citation1984; Tsaifouli et al. Citation2005; Begum et al. Citation2010). This is because moisture is a crucial factor that enhances the biological activity in soils. SWDI was correlated with QBS-ar (p <0.01; r = 0.547), which clearly indicated that the higher diversity of soil arthropods led to higher values of the QBS-ar index ().
Table 5. Pearson’s correlation among various physico-chemical and biological properties in pre-monsoon season
During the post-monsoon season, bulk density was negatively correlated with SOC (p <0.01; r = –0.872) and likewise during the pre-monsoon as expected (). The higher the SOC content in the soil, lower will be the bulk density as organic matter has a low density and also enhances soil structure which leads to high porosity and loose soil conditions. Bulk density was also negatively correlated with QBS-ar (p <0.05; r = –0.488), and population density (p <0.05; r = –0.559) but positively correlated with soil pH (p <0.01 = r = 0.624) and the SWDI (p <0.01; r = 0.572). Soil pH was negatively correlated with SOC (p <0.01; r = –0.595) and population density (p <0.05; r = –0.511). Acidic conditions are generally not well tolerated by most soil organisms and hence their numbers decline with low pH. Organic matter in the soil tends to have an ameliorating effect on soil pH. Population density and diversity of mesofauna are greatest in soil with high porosity and organic matter, as well as, good soil structure (Anderen & Lagerlof Citation1983). SOC was positively correlated with population density (p <0.01; r = 0.673) and QBS-ar (p <0.01; r = 0.697). A strong positive correlation (p <0.01; r = 0.697) was noted between population density and the QBS-ar index. Higher SOC content in the soil was primarily responsible for the higher population density and QBS-ar. Soil organic carbon is important to soil fertility because of its role in maintaining soil structure, retaining water and as a nutrient reserve as well as chemical buffer (Howard & Howard Citation1990).
Table 6. Pearson’s correlation among various physio-chemical and biological properties in post-monsoon season
4 Conclusions
The physio-chemical and biological properties investigated in this study exhibited variations according to the season, slope aspect and land use type. Our results showed that season and land use had strong influences on faunal population density, diversity and QBS-ar index due to their effects on soil temperature, moisture, available P and SOC contents. The post-monsoon season had higher faunal density, diversity and QBS-ar than the pre-monsoon season. Slope aspect had less of an influence on these soil quality indicators, although it significantly influences soil temperature, moisture and SOC contents. As per the land use type, forest soils had higher density, diversity and QBS-ar. The QBS-ar index was observed to be correlated with the faunal density and with the SWDI. Furthermore, our results indicated that high SOC, moisture content and low bulk density are responsible for increases in population density of soil mesofauna, and the QBS-ar index. Therefore, management practices that enhance plant residue retention on farm land, such as compost/farmyard manure application, crop residue mulching and reduced tillage, could increase the numbers and diversity of soil organisms while concomitantly improving fertility, productivity of the land and other ecosystem services. However, further studies are required to better characterize the ecosystem services supplied by soil fauna and to understand the influence of slope aspect, impact of agricultural practices and intensification on soil faunal assemblages for the sustainable management of the soils.
Acknowledgments
This research was supported by the HIMUNET (NUFU) project Norway. Technical and financial support provided by this project was highly acknowledged. The authors also thank the Aquatic Ecology Centre, Kathmandu University for assistance and logistical support both in the field and lab.
References
- Anderen O, Langerlof J. 1983. Soil mesofauna (Microarthropods, Enchytraeds, Nematodes) in Swedish agricultural cropping system. Acta Agric Scand. 33:33–52.
- Badejo MA, Van-Straalen NM. 1993. Seasonal abundance of springtail (Collembola) in two contrasting environment. Biotropica. 25:222–228.
- Bairacharya RM, Sherchan DP. 2009. Fertility status and dynamics of soils in the Nepal Himalaya: A review and analysis. In: Soil fertility. Nova Science Publisher, Inc.; p. 111–135.
- Begum F, Bajracharya RM, Sharma S. 2009. Land use effects on soil quality Indicators in mid-hills of Central Nepal. In: International Conference Proceeding of “Emerging Technologies in Environmental Sciences and Engineering”. India: Aligarh Muslim University; p. 488–495.
- Begum F, Bajracharya RM, Sharma S, Situala BK. 2010. Influence of slope aspect on soil physic-chemical and biological properties in the mid hill of central Nepal. Int J Sust Dev World Ecol. 17:438–443.
- Blake GR, Harte KH. 1986. Methods of soil analysis. In: Klute A, editor. Part 1, Physical and mineralogical methods-agronomy monograph. 2nd ed. Madison: American Society of Agronomy-Soil Science Society of America; p. 363–375.
- Bremner JM, Mulvaney CS. 1982. Nitrogen total. In: Page AL, Miller RM, Keeney DR, editors. Methods of soil analysis part 2. Chemical and microbiological properties. 2nd ed. American Society of Agronomy Monograph No. 9. Madison (WI): ASA-SSSA, Inc; p. 595–610.
- Coleman DA, Crossley DA Jr, Hendrix PF. 2004. Fundamentals of soil ecology. 2nd ed. Burlington (MA): Elsevier Academic Press.
- Crossley DA Jr, Coleman DC, Hendrix PF. 1989. The importance of the fauna in agricultural soil, research approaches and perspectives. Agric Ecosyst Environ. 27:47–55.
- Daily GC, Alexander S, Ehrlich PR. 1997. Ecosystem services: Benefits supplied to human societies by natural ecosystems. Issue Ecol. 18–24.
- Gee GW, Bauder JW. 1986. Particle size analysis. In: Klute A, editor. Methods of soil analysis, part 1. Physical and mineralogical methods-agronomy monogram no. 9. 2nd ed. Madison (WI): American Society of Agronomy- Soil Science Society of America; p. 383–411.
- Hasegawa M, Takeda H. 1996. Carbon and nutrient dynamics in decomposing pine needle litter in relation to fungal and faunal abundances. Pedobiologia. 40:171–184.
- Howard PJA, Howard DM. 1990. Use of organic carbon and loss-on-ignition to estimate soil organic matter in different soil type and soil horizon. Biol Fertil Soils. 9:306–310.
- Lasebikan BA. 1974. A preliminary communication on micro arthropods from tropical in Nigeria. Pedobiologia. 14:402–411.
- Lavelle P, Decaen T, Aubert M, Barot S, Blouin M, Bureau F, Margerie P, Mora P, Rossi JP. 2006. Soil invertebrate and ecosystem services. Eur. J. Ecol. S3–S15.
- Mcintosh PO, Allen RB. 1993. Soil pH declines and organic carbon increases under hawkweed (Hieracium pilosella). New Zealand J Ecol. 17:59–60.
- McLean OE. 1982. Methods of soil analysis. In: Klute A, editor. Chemical and microbiological properties. 2nd ed., SSSA Book Series 5. Madison (WI): SSSA.
- Monkiedje A, Spiteller M, Fotio D, Sukul P. 2006. the effect of land use on soil health indicators in Peri-Urban agriculture in the humid forest zone of Southern Cameroon. J Environ Qual. 35:2402–2409.
- Nelson DW, Sommers LE. 1982. Total carbon, organic carbon and organic matter. In: Page AL, Miller RM, Keeney DR, editors. Methods of soil analysis part 2. Chemical and microbiological properties. 2nd ed., American Society of Agronomy Monograph No. 9. Madison (WI): ASA-SSSA, Inc; p. 539–580.
- Olsen SR, Sommers LE. 1982. Phosphurus. In: Page AL, Miller RM, Keeney DR, editors. Methods of soil analysis part 2. Chemical and microbiological properties. 2nd ed., American Society of Agronomy Monograph No. 9, Madison (WI): ASA-SSSA, Inc; p. 403–416.
- Paoletti MG, Favretto MR, Stinner BR, Purrington JE, Beter. 1991. Invertebrates as bioindicators of soil use. Agric Ecosyst Environ. 34:341–362.
- Parisi V, Menta C, Gardi C, JacominiC ME. 2005. Microarthropods communities as tool to assess soil quality and biodiversity: A new approach in Italy. Agric Ecosyst Environ. 105:323–333.
- Pflug A, Wolters V. 2001. Influence of drought and litter age on Collembola communities. Eur J Soil Biol. 37:305–308.
- Reddy MV. 1984. Seasonal fluctuations of different edaphic micro arthropods population densities in relation to soil moisture and temperature in pine, Pinus kesiya Royle plantation ecosystem. Int J Biometeorol. 28:55–59.
- Rokaya K. 2008. Soil physical and biological parameters as an indicator of soil quality in a mid hill Watershed of Nepal. . Kathmandu University, Nepal.
- Rombke J, Sousa JP, Schouten T, Riepert F. 2006. Monitoring of soil organisms: A set of standardized field methods proposed by ISO. Eur J Soil Biol. 42:S61–S64.
- Schmidt M. 1991. An evaluation of the resources and forest soil fertility of a mountain watershed in Nepal using GIS techniques. Soil fertility and erosion issues in the middle mountains of Nepal. Workshop Proceeding, Jhikhu Khola. ISS/UBC/IDRC, Kathmandu, Nepal.
- Setala H, Marshall VG, Trofymow JA. 1995. Influence of micro- and macro-habitat factors on Collembola communities in Douglas fir stump during forest succession. Appl Soil Ecol. 2:227–242.
- Solbrig OT. 1991. From genes to ecosystems: A research agenda for biodiversity. IUBS–SCOPE–UNESCO.
- Stamou GP, Sgardelis PS. 1989. Seasonal distribution patterns of oribatids mites (Acari: Criptostigmata) in a forest ecosystem. J Anim Ecol. 58:893–904.
- Stenburg M, Shoshny M. 2001. Influence of slope aspect on Mediterranean woody formations: Comparison of a semiarid and an arid site in Israel. Ecol Res. 16:335–345.
- Tsiafouli MA, Kallimanis AS, Katana E, Stamou GP, Sgardelis SP. 2005. Responses of soil micro arthropods to experimental short term manipulations of soil moisture. Appl Soil Ecol. 29:17–26.
- Tsui CC, Chen ZS, Hsieh CF. 2004. Relationships between soil properties and slope position in lowland rain forest of southern Taiwan. Geoderma. 123:131–142.
- Vu MQ, Nguyen TT. 2000. Microarthropod community structures (Oribatei and Collembola) in Tam Dao National Park, Vietnam. J Biosci. 25:379–386.
- Zhang P, Zhang T, Chen NL. 2009. Vertical distribution patterns of soil organic carbon and total nitrogen and related affecting factors along northern slope of Qilian Mountains. J Appl Ecol. 20:518–524.