Abstract
The contributions of a silvicultural practice (enrichment planting technique) to ecosystem restoration, management and biodiversity conservation were assessed. Data were collected from eight 25 × 25 m plots located in the three forest types (Degraded Forest, Strict Nature Reserve and Enrichment Planting Forest) in Akure Forest Reserve, Nigeria, using a systematic line transect. Soil samples were also collected in each plot at three depths. The results indicated that there were 51 tropical hardwood species distributed into 24 families in the forest ecosystem. The Shannon–Weiner indices varied from 3.25 to 2.74. Enrichment Planting Forest was discovered to have the highest number of species, genera and families when compared to the other forest types. Also, highest biodiversity indices were obtained for it. All the variables were significantly higher (p < 0.05) in the forest regenerated through enrichment planting. There was generally no significant difference in soil properties among the forest types except for total nitrogen at depths of 30–45 and 45–60 cm for SNR. The enrichment planting silvicultural practice therefore possesses the potential for soil fertility improvement, volume yield increment and restoration of degraded forests. Its use is therefore recommended for forest restoration in developing countries where anthropogenic activities have adversely affected the natural forest ecosystem.
Introduction
The tropical rainforest ecosystem is one of the principal natural formations of the world, the most complex in structure and richest in species composition (genetic diversity of plant and animal). Daily (1999) reported on the availability of several wood and non-wood products from this ecosystem and the contributions of the ecosystem to biodiversity conservation, environment sustainability and to rural and national development. This was also corroborated by the studies of Myers (Citation1990) who claimed that about 80% of Nigeria's food supply is derived from the forest. Animals and most people around the world depend on plant species for food, shelter and clothing. Nigerians depend on tropical forest ecosystem for both timber and non-timber forest products to meet their daily needs. Forest and biodiversity play important roles in ecosystem services as reported by De Groot et al. (Citation2002), Diaz et al. (Citation2006) and Van Wilgen et al. (2007). These services include water shed management, purification of air, habitat for wild animals, source of medicinal herbs, timber and fuel-wood for rural livelihood and national development. In an attempt to satisfy both local and international need for forest products and the continuous increase in rural population, forest resources exploitation in this ecosystem is carried out in uncontrolled and unsustainable manners (Onyekwelu et al. Citation2005). The long-term effect is usually destruction of their quality and quantity. Destruction in terms of quantity is termed deforestation while destruction in terms of quality is called forest degradation. Onyekwelu and Fuwape (Citation2008) reported that Nigeria's tropical rainforest has been heavily exploited, seriously degraded and fragmented, leaving less than 5% of the country's rainforest ecosystem as undisturbed. Exploitative logging, felling damage to residual forests, soil damage, intensive fuel-wood and non-timber forest products collection, overgrazing and encroachment by farmers are some of the main causes of degradation. Forest degradation is usually accompanied by reduction in species diversity, decrease in primary productivity, change in forest structure and depletion in soil nutrients (Abubaka Citation2010). FAO (Citation2005) listed Nigeria as one of the developing countries with very high rate of deforestation and this rate was estimated to be 3% by Oyebo (2006).
Degraded and secondary forests cover significant areas throughout the tropics. In most developing countries, they now exceed areas covered by primary forests (FAO Citation2005). Tropical deforestation begins with excessive logging that reduces the original forest to a marginal land. Due to the fertility of soil in forest lands, they are usually converted to agricultural uses by land hungers and landless farmers. Unproductive farmlands that could potentially regenerate to forest are usually abandoned as wastelands. The natural recovery of areas subjected to intensive anthropogenic activities is generally very slow because of soil degradation and recurring disturbances. The need to restore degraded forest areas to improve their productive capacity, environmental functions and biodiversity value has been widely recognized (Parrotta Citation2000). Restoring the study area will positively improve the surrounding ecosystem and the lives of people living in the area. Therefore, these degraded areas need human intervention and appropriate silvicultural method to initiate recovery.
Various ecological restoration methods involving planting of tree seedlings have been developed to reforest degraded lands (Lamb et al. Citation2005). Restoration can be achieved by some planting approaches that cover a range of species and density of planting. These approaches include the dense planting of a large number of primary forest species (Miyawaki Citation1999), staggered planting of primary forest species (Knowles & Parrotta Citation1995), the framework species method (Goosem & Tucker Citation1995; Forest Restoration Research Unit Citation2005; Shono et al. Citation2007) and the assisted natural regeneration (ANR). These methods have all been implemented with promising results. Enrichment planting, which was introduced during the first phase of forest resources management in Nigeria, is a silvicultural practice that involves deliberate introduction of tree seeds or seedlings into a degraded forest. This practice was abandoned because government, organization and individual were only interested in exploitation of forest resources for revenue generation not minding their future availability. The ANR is based on the ecological principles of community succession and is most applicable if there are patches of natural forest or trees mixed within the grassland. This method was proposed by Dalmacio (Citation1986), and its basic concept emphasizes protection and nurturing tree seedlings and saplings already existing on degraded sites, rather than establishment of entire new forest plantations. In seriously degraded landscapes, the ANR may not be a feasible means for rehabilitation as it is likely that isolated trees do not produce viable seeds or vigorous seedlings. The framework species method of forest restoration is designed to restore diverse forest ecosystems on degraded forestland for biodiversity conservation or environmental protection.
When an area is heavily degraded and normal planting could hardly restore the forest ecosystem, the use of the framework species method is recommended (Shono et al. Citation2007). This method involves the use of fast growing species with dense shading crowns that rapidly shade out competing weeds, and with seeds that are attractive to seed-dispersing wildlife, especially bats and birds. The method depends on the availability of forest patches, remnant forest trees or fairly closed planted plots. These provide the source of seeds or wildlings for regeneration. In addition, reasonably dense population of seed-dispersing animals must be available in the forest. Tree planting restores basic ecosystem structure and function, whilst seed-dispersing wildlife re-establishes biodiversity and the original tree species composition of the forest. If either of these two elements is missing from the surrounding landscape, natural regeneration within framework species plots may not be successful. When the initial planting of framework tree species failed to stimulate natural regeneration, subsequent planting of additional tree species are carried out.
Soil, which is an integral part of forest ecosystem, plays a vital role in the success of forest regeneration. Forest degradation is not only peculiar to reduction in the quality of forest; it also means the reduction and loss of soil nutrients. According to Gerold (Citation2001), decrease in biomass bound nutrients stocks, disturbance of internal nutrient cycle with loss of organic litter layer and therefore higher nutrient leaching, decrease in soil organic matter and decrease in cation exchange capacity and plant available nutrients are also the consequences of deforestation and forest degradation. According to FAO (Citation2000), healthy soil is a vital component of the forest ecosystem. It is a strong foundation for trees and plants to grow on and a laboratory where old organic matter is recycled back into the ecosystem. Litter, which is a source of organic matter in forest ecosystem, is composed of fallen plant debris in the upper layer of undecomposed organic debris and had vital functions in forest ecosystem. The decomposition rate of litter controls nutrient release in the soil. Kurz et al. (Citation2000) noted that the balance between litter production and its decomposition also controls the size of the carbon reservoir within the soil. Litter quality affects not only the rate of mass loss, but also the patterns and rates of mineralization and release (Santa Citation2001). Also, Zhou et al. (Citation2009) highlighted the importance of soil structure as an indicator of soil quality which could be influenced by natural environmental change and all kinds of human activities.
Forest trees can help to combat land degradation by stabilizing soils, reducing water and wind erosion and maintaining nutrient cycling in soils. Due to the long tap root of tree species, it can take leached nutrients from deeper soil layers and make them available for efficient growth of tree seedlings on the forest floor. Tree litter fall, decomposition and nutrient release are the mechanisms by which trees restore and maintain soil fertility of degraded forest. The high quantity of litter on the forest floors is the primary source of soil organic matter which acts as nutrients reserve. Hence, restoration of soil fertility for sustainable forest production is very important for environmental and biodiversity conservation. The aim of this study therefore is to examine the potentials of enrichment planting in biodiversity conservation and soil fertility restoration. An hypothesis that Enrichment Planting is very efficient for biodiversity conservation, restoration of degraded forest and soil fertility maintenance was tested in this study. This was achieved by comparing the present status of a degraded forest already regenerated using this silvicultural approach with an existing Strict Nature Reserve (SNR) and a degraded portion of the reserve. Comparison was limited to tree species diversity and abundance using some biodiversity indices, volume yield and some selected soil chemical properties.
Materials and methods
Study area
This study was carried out in Akure Forest Reserve, Akure South Local Government Area, Ondo State, Nigeria. It was selected for the study because of the presence of a SNR (SNR 2, 32 ha), a degraded portion of the forest already regenerated through enrichment planting (EPF, 5 ha) and another degraded portion (6956 ha) where there is no intervention yet. Akure Forest Reserve covers an area of 6993 ha. The reserve is under the management of the Department of Forestry, Ondo State, Nigeria. The reserve lies along Ondo – Akure road, beginning at about 20 km south of Akure, the capital city of Ondo State. It is located on Latitude 7° 18′ N and Longitude 5° 02′ E. The area is gently undulating and lies on a general altitude of 229 m above sea level (Jones Citation1948). The reserve is well drained due to the presence of Owena River, which flows North to South across the forest reserve into the Atlantic Ocean, about 160 km away. shows the map of Ondo State Nigeria and the locations of the various reserves including the study area.
Figure 1. Map of Ondo State showing forest locations with map of Nigeria in inset.
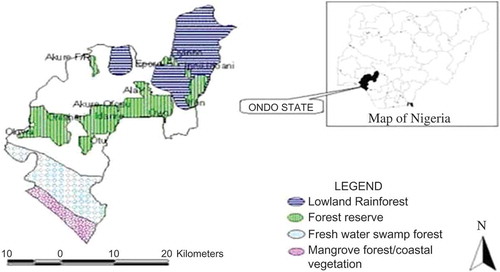
According to brief geological description of the forest reserve by Jones (Citation1948) and Ola-Adams and Hall (Citation1987), the underlying rock is crystalline, mainly gneissose and referable to the basement complex. As a result of continuous weathering, the ferric luvisol soils, which feature abundantly in the typical upland soils in many parts of South-Western Nigeria is also present in this forest reserve. The climate is humid tropical with seasonal variation. The mean annual rainfall is about 4000 mm with double maxima in the months of July and September and a short relatively dry period in August. December through to February constitutes the major dry season while January and February are the driest months with each having less than 30 mm rainfall (Ola-Adams & Hall Citation1987). The relative humidity is highest in the months of July and September and lowest in February at about 81% and 44%, respectively. The temperature ranges from about 20.6°C to 33.5°C. The monthly mean temperature is about 27°C, a condition that is conducive to the development of tropical rainforest. The forest cover of the vegetation has been un-modified for several decades (Ola-Adams & Hall Citation1987). Jones (Citation1948) description of the vegetation stresses four strata of woody plants; emergent (height of trees above 40 m), upper storey (20–40 m), lower storey (3–20 m) and shrubs. The dominant plant species are the indigenous tropical rainforest hardwood species such as Khaya species, Mansonia altisima, Cordia millenii and Milisia excelsa.
Sampling procedure
Systematic line transect was employed in the laying of the sampling plots. Two parallel transects of 1100 m in length with a distance of 500 m between them were used in each of the study sites. Sample plots of 25 × 25 m in size were laid in alternate direction along each transect at an interval of 250 m and thus summing up to 4 sample plots per 1100 m transect and a total of 8 sample plots in each of the selected forest types.
Data collection and analyses
Tree growth measurement and analyses
In each plot, diameters at breast height (DBH) and at the base were measured with girth/diameter tape while middle and top diameters and total height were measured with Speigel Relaskop. These were done for all the living trees with DBH equals or greater than 10 cm.
The basal area of individual tree was calculated using the formula:
The total basal area for each of the sample plots was obtained by the sum of the BA of all the trees in the plot. Basal area per hectare was obtained by multiplying mean basal area per plot with the number of 25 × 25 m plots in a hectare (16),
The volume of individual trees was also estimated using the Newton's formula of Husch et al. (2003):
Tree species identification
The botanical name of every living tree (DBH > 10 cm) encountered in each sample plot was recorded for each of the study sites. When a tree's botanical name was not known immediately, it was identified by its commercial or local name. Such commercial or local name was translated to correct botanical names using Keay (Citation1989). Possible effort was made not to omit any eligible stem in a sample plot. This is because any species omitted will indicate the absence of such species in the ecosystem.
Soil sample collection
A diagonal line was laid within the sample plot for soil sample collection. Soil samples were taken from four soil depths of 0–15 cm, 15–30 cm, 30–45 cm and 45–60 cm at three points (i.e., at the two edges and middle of the line) as also done by Onyekwelu et al. (Citation2010). Soil samples from the same depths and from the same plot were thoroughly mixed to form a composite soil sample, from which samples were collected for analysis in laboratory for organic carbon, organic matter and total nitrogen.
Methods of soil analyses
Core cylinder samples were dried for 2 days at 105°C to estimate the bulk density as a ratio of oven-dry weight of soil to cylinder volume. The determined bulk density was corrected for percent coarse fractions. The corrected bulk density (g m−3) was used for the estimation of soil organic carbon (SOC) stock. Soil samples collected from each layer separately were air dried and sieved through 2 mm sieve. SOC was determined by Walkley–Black wet oxidation method. While organic matter content was estimated by multiplying the carbon value by a factor of 1.724 (Walkley & Black 1934). These values were expressed in percentage. To determine total nitrogen, sample solutions were digested using the semi-micro-Kjedahl method with selenium catalyst (Bremner 1965). The digested samples were distilled after the addition of 40% of sodium hydroxide (NaOH) and the ammonia thus released was determined by simple acid–base titration. The values were expressed in percentage (%).
Tree species classification and biodiversity indices
All the stems were classified into species and distributed into families. The following indices were used for comparing the abundance and diversity of the tree species as done by Kent and Coker (Citation1992), Magurran (Citation2004), Lü et al. (Citation2010), Saiter et al. (Citation2011) and Adekunle et al. (Citation2013).
| 1. | Species diversity index was calculated using the Shannon–Weiner diversity index (Kent & Coker Citation1992):
| ||||
| 1. | Shannon's maximum diversity index was calculated using the relationship:
| ||||
| 1. | Species evenness in each community was determined using Shannon's equitability index (EH ):
| ||||
| 2. | Margalef's index was calculated using the equation:
| ||||
Simpson's index was calculated using the equation:
| 1. | Sorensen's species similarity index between two sites was calculated using equation:
| ||||
| 1. | Family importance value (FIV) | ||||
The family importance value (FIV) was used to understand a family's share in the tree community for each site. FIV is defined as the sum of its relative dominance (RDm), its relative density (RD) and its relative frequency (RF), which is calculated as follows:
Thus, family importance value = RDm + RD + RF
| 1. | Number 1 of Hill diversity index (N 1): This is the exponent of Shannon–Weiner diversity index and it is given as
| ||||
Where pi: is the proportional abundance of a particular species
ni: number of individuals of a particular species
N: total number of individuals
Number 2 of Hill diversity index
N 2: species evenness index as a reciprocal of Simpson's dominance index
Statistical analysis methods
One-way analysis of variance was used in this study to test for significant differences in tree density, species diversity and richness, and soil characteristics among the three forest types. Where significant differences (p < 0.05) occurred, mean separation was carried out with Duncan's new multiple range test (DMRT). Two data matrices representing growth and soil characteristics were constructed and the SPSS for windows software package was used for performing the principal component analysis (PCA). In order to determine main components, only principal components with eigen values greater than 1 were selected, components with an eigen value of less than 1 accounted for less variance than did the original variable (which had a variance of 1), and so they were of little use, as such were not extracted. From each extracted component, variables with coefficients ≥±0.70 were selected and considered significant. However, in order to determine the basic growth and soil variables sustaining these interrelationships, the component defining variables, i.e., those variables with the highest loadings (correlation coefficients) on each extracted principal components for growth and soil were selected to represent the extracted components because they provide the best relationship.
Results
Tree growth variables and volume yield in the three forest types
The results of tree growth variables for the three forest types are shown in . According to the table, highest tree growth variables of 40.20 cm for mean DBH, 165.50 cm for dominant DBH, and 16.53 m for mean height and 32.50 m for the dominant tree height were recorded for the SNR. This is followed by the results from the EPF with a mean DBH of 23.26 cm, a dominant DBH of 105 cm, a mean height of 14.02 m and a dominant height of 27.50 m. The least values were observed in the degraded forest (13.8 cm, 25.4 cm, and 12.26 m, 20.5 m as mean DBH, dominant DBH, mean height and dominant height, respectively). The highest basal area and volume per hectare of 61.12 m2 and 600.96 m3, respectively, were also recorded for the SNR, followed by the EPF with 35.20 m2 and 345.76 m3 as the basal area and volume per hectare, respectively. The least values were recorded for the degraded forest too (basal area/ha of 0.95 m2 and the volume/ha of 2.88 m3). The results of the one-way analysis of variance revealed the presence of significant differences (p < 0.05) in the phytosociological properties of these forest types.
Table 1. Summary of tree growth variables in the selected three forest types in the study area
The diameter distribution representing the vertical structure of the three forest types are presented in . The figure showed that the highest proportion of trees per hectare was in the lowest diameter class while the least occurred in the class of 91–100 cm. The curves of the enrichment and strict nature forests had the inverse J-shaped pattern. This was expected of any mature and undisturbed natural forest ecosystem. The curve for the degraded forest could not produce the expected shape due to the level of disturbance in the ecosystem. is on the physiognomy of the forests. This was in accordance with the distribution of tree height in the forests. The figure showed that the highest number of trees occurred in the height class of 11–15 m (middle stratum) while the least was in the class of 26–30 m (Upper stratum). There are 28.7% trees per hectare that could be referred to as emergent (>30 cm) in the three forests. The enrichment forest had the highest percentage of trees in the middle stratum than the other two forests.
Figure 2. DBH curves for the three forest ecosystems in the study area (EP – Enrichment Planting, DF – Degraded Forest and SNR – Strict Nature Reserve).
Figure 3. Height distribution of trees in the three selected forest types (EP – Enrichment Planting, DF – Degraded Forest and SNR – Strict Nature Reserve).
Tree species diversity and abundance in the studied forests
The list of all the tree species encountered in each of the three forest types is presented in . The table indicated that the highest number of trees were present in the EPF (446/ha), followed by the SNR (406/ha) and the least for the degraded forest with 60/ha. Mansonia altisima, in Sterculiaceae family, had the highest frequency per hectare in the three sites. This was followed by Celtis zenkeri of Ulmaceae family with a stand density of 50/ha in the SNR and Sterculia rhinopetala with 44 individual stem per hectare in the EPF. The proportion of species with n > 5 and n < 5 in SNR are 45.7% and 54.3%, respectively. While in the remaining two forest types, 12.5% species has n > 5 (DF) and in 50% species has n > 5 (EPF). In the EPF, the stems fell into 42 different species distributed among 36 genera and 21 families. For the degraded forest, 18 different species that fell into 16 general and 11 families were encountered, while in the SNR, we encounter 35 different species distributed among 28 genera and 19 families.
Table 2. List of tree species, abundance and families in the three forest types in the Akure Forest Reserve
showed that about 22.6% of the species occurred in all the three sites (habitat generalist), 32.1% in two of the sites and the highest proportion (45.3%) in only one site. The family distribution of the species and the family importance value (FIV) in the three forest types is presented in . The results revealed that there were a total of 24 families in the three locations. It was observed that Sterculiaceae family had the highest number of stems per hectare (210) and the highest FIV (402.32) in SNR. This family also had the highest number of stems per ha and the highest FIV (24 and 196.07, respectively) in the degraded and also in the EP forests (198 and 331.65, respectively). The least FIV was recorded for Anacardiaceae in the SNR, Sapotaceae in the degraded forest, Tilaceae and Sapindaceae in the EP forest.
Figure 4. Tree species distribution among different locations (Enrichment Planting, Degraded Forest and Strict Nature Reserve).
Table 3. Family distribution of species and family importance values in the three forest types in the study area
The results of tree species diversity for the three sites with alpha and beta diversity indices are presented in . The results of the one-way analysis of variance and that of mean separation indicated that there were significant differences (p < 0.05) in the indices as shown in the tables The Shannon–Weiner indices revealed that the EPF has the highest tree species diversity with a value of 3.25. This was followed by the SNR with 2.82 while the least was recorded for the degraded forest (2.74). The result of Pielou's evenness index showed that EPF had 0.87, DF had 0.95 and 0.79 for SNR. Moreover, the results of the Margalef's index of species, Simpson's index, number 1 of Hill diversity indices and the number 2 of Hill diversity indices for EPF were 7.58, 0.95, 25.79 and 1.05, respectively. The indices for DF were 5.0, 0.07, 15.48 and 14.29 for Margalef's index of species, Simpson's index, number 1 of Hill diversity indices and the number 2 of Hill diversity indices, respectively. For the SNR, its indices were 0.17 for Margalef's index, 0.89 for Simpson concentration index, 16.78 for number 1 of Hill diversity indices and 1.12 for number 2 of Hill diversity indices. The results of species similarity index were 0.77, 1.00 and 2.35 for the DF and EP, DF and SNR, and EP and SNR, respectively. The results revealed a high diversity and the distribution pattern of the tree species in these forests.
Table 4. Summary of phytosociological results in the SNR, DF and EPF
Table 5. Mean chemical properties of the forests' soil samples according to depths
Table 6. Correlation matrix for both tree growth variables and soil properties in Enrichment Planting Forest (EPF)
Variations in soil properties in the three forest types
The result of the one-way analysis of variance for comparing soil properties among the forest types is presented in . Generally, in the three forest types there was no significant difference in soil carbon and organic matter except for total nitrogen at depths of 30–45 and 45–60 cm for SNR.
The correlations in tree growth variables, forest yield and soil properties in the three forest types
The correlation matrix for both tree growth variables and soil properties for each forest type is presented in Tables 6–8. In , the highest strength of relationship was recorded between organic matter and organic carbon (100%). It was also reviewed that the basal area was positively correlated with volume (94%); mean DBH with dominant height (71%) and mean height (76%); dominant height with basal area (69%) and volume (62%). However, very weak strength of relationship was recorded between tree growth variables and soil properties in EPF. In SNR, mean height was found to be highly and positively correlated with total nitrogen (77%). A reasonably high strength of relationship was also recorded between dominant height, organic carbon and organic matter as presented in . Also in DF, high strength of relationship was recorded between mean DBH and other growth variables but the strength of relationship between growth variables and soil properties were weak. This is presented in .
Table 7. Correlation matrix for both tree growth variables and soil properties in Strict Nature Reserve (SNR)
Table 8. Correlation matrix for both tree growth variables and soil properties in Degraded Forest (DF)
The relationship between three growth variables and soil parameters using the PCA
PCA was performed on tree growth variables and the soil parameters of the three forests in order to identify critical growth factors contributing to the protection and enrichment of the soils that supported the growth of the vegetation. Component loadings (correlation coefficients) and the variances (eigen values) for the various growth and soil variables were computed and the results were presented in . The results of the ordinary component matrix of the growth and soil parameters have eigen values that were less than one (≤1). Specifically, three (3) of the growth parameters (basal area – 0.898, volume – 0.867 and dominant DBH – 0.742) loaded heavily on component 1. This component accounted for 39% of the total variance in the growth and soil parameters. For component 2, three of the variables namely the dominant DBH (0.75), organic carbon (0.906) and organic matter (0.905) loaded heavily; this component accounted for 69.5% of the variation in the data set. While on component 3, none of the variables were significant as their eigen vectors were less than ±0.70. Moreover, the results of the ordinary component matrix of growth and soil parameters that had their eigen values ≤1 for SNR and DF are also presented in .
Table 9. Ordinary component matrix of growth and soil parameters of the studied forests
Discussion
The restoration of biodiversity in degraded forests of developing countries has been reported as a challenge to forest managers and conservationists (Adekunle Citation2006). Natural regeneration of native tree species, following forest degradation, are constrained by a number of factors including low seed availability, predation of seeds and seedlings, competition with grasses and other non-woody vegetation, soil degradation and unfavourable climatic conditions. Onyekwelu et al. (Citation2008) reported that where these factors are prevailing, restoration may be very difficult to achieve. They revealed further that a highly degraded rainforest ecosystems possess the potentials of recovering from degradation, even after significant degradation. In Nigeria and other developing countries, some of the reasons for forest degradation are population growth which has led to the increase in the demand for forest products and forestlands, indiscriminate exploitation of forest resources to meet daily needs, encroachment, conversion of forest to other land uses such as farm land and large-scale afforestation projects and poor forest policy (Adekunle et al. Citation2010).
According to the results of this study, there was success in the use of enrichment planting to regenerate degraded forests in the tropics. It also showed the potential of this silvicultural approach in the restoration of soil nutrients and as a means of sustainable forest management. Restoration of degraded rainforest ecosystem can therefore be enhanced through enrichment planting. This was indicated by the highest diversity of tree species, as shown by the number of species (42 species) and families (21 families), in the location regenerated through enrichment planting when compared with the SNR that had 35 species and 19 families and the degraded forest with 18 and 11 species and family, respectively. To appropriately compare tree species diversity in these forest communities, several biodiversity indices were used. Motz et al. (Citation2010) reported on the roles of nine different biodiversity indices for comparing forest communities. The highest diversity of plant species recorded in the EPF could be attributed to the high level of protection from anthropogenic activities, application of silvicultural operations during seedling propagation and the re-introduction of some indigenous tree species believed to have existed in the forest before degradation. Moderately or slightly disturbed tropical forest ecosystem tends to support more number of plant species when left to regenerate, either naturally or through some interventions, in comparison with a forest which is dense and undisturbed (Mishra et al. Citation2004). Its highest biodiversity indices also confirmed the applicability of this approach for biodiversity conservation and its continuous ability to provide the several indispensable goods and services (ecosystem functioning). According to Hengeveld (Citation1996), species diversity is an important attribute of a natural community that influences the functioning of an ecosystem. Ecosystem functioning, according to De Groot et al. (Citation2000), is the capacity of natural process and components to provide goods and services that satisfy human needs, directly or indirectly. This simply implies that the higher the biodiversity, the more efficient the functioning of the ecosystem.
The status of the area regenerated through enrichment planting and the SNR was found to be similar to what was reported by several researchers for other tropical forests (Fox et al. Citation1997; Kadavul & Parthasarathy Citation1999; Chowdhury et al. Citation2000; Khera et al. Citation2001). Their biodiversity indices also corroborated the findings of Adekunle (Citation2006) who obtained the Shannon–Weiner (H′) values that ranged between 3.34 and 3.66 for some selected rainforest sites in Nigeria. The value obtained for the EPF in this study was within this range but higher than the value for the SNR and DF. The poor phytosociological status of the degraded forest could be attributed to the fact that the whole of Akure Forest Reserve was a productive forest where logging and other anthropogenic activities were allowed but under the control and administration of the State Department of Forestry. This has led to the degradation of the forest, impoverishment of the soil and reduction in volume yield. Regardless of how long trees were clear-cut or selectively removed, logging decreased species diversity (Brown et al. Citation2003) and reduced the number of economic trees. The severe impacts of uncontrolled logging and several other human activities in tropical rainforest ecosystems on biodiversity conservation, soil properties, residual trees and seedlings and the environment were reported by Makana and Thomas (Citation2006), Adekunle and Olagoke (Citation2010) and Adekunle et al. (Citation2010). In degraded forest however, canopy openings were created when big trees were cut. These openings are supposed to give room to left over small diameter trees and wildlings to develop. But due to the poor harvesting and haulage techniques in Nigeria, the carelessness of loggers, lack of training and road construction for timber trucks, untargeted trees are damaged and the wildlings of important species are destroyed. The consequence is the invasion of the forest by early colonizers, secondary succession with undesirable plants and weeds. Except there is the conscious effort to regenerate the area with the use of fast growing exotic species or the use of enrichment planting to conserve the native plants, the forest will remain degraded. Also, some of the important hardwood timber species and families that were encountered in the SNR only might be present in the area regenerated through enrichment planting and the degraded forest before human interference and the commencement of logging in the reserve. They might have been removed from these areas during logging because of their economic importance. This further confirmed the impacts of reckless exploitation on tree species diversity conservation. However, some of these important species were re-introduced during enrichment planting. In Brazil, it was also reported that the Atlantic rainforest has been severely damaged during the last 50 years and the few remaining areas are covered by mature forest and are mostly confined to protected areas (Ribeiro et al. Citation2009).
The main idea behind PCA is to form, from a set of existing variables, a new variable (or new variables, but as few as possible) that contain as much variability of the original data as possible so as to determine the basic growth and soil variables sustaining the forest ecosystem. The PCA results for this study showed the magnitude of the relationship between some of the soil parameters and the tree growth variables. Organic carbon and total nitrogen were found to be highly correlated with volume, basal area and DBH. This showed the contribution of the soil elements like soil carbon and total nitrogen in tree growth. Also, tree growth variables such as volume, basal area and DBH stood out as critical growth parameters protecting the soil from varying climatic conditions like heavy rainstorm, soil erosion and the loss of soil moisture. Also, the weak relationship recorded from the results of correlation matrix between the growth variables and soil properties could be as a result of the previous lost of soil fertility due to anthropogenic activities in both EPF and DF leaving little nutrients for the survival of only genetically strong tree species.
The chemical characteristics of the soils under the various forest types and across the soil depths varied considerably. Litter fall are broken down to form humus by soil microorganisms. The humus is incorporated into the soils to improve their chemical properties. The results of this research work agreed with the findings of Singh (2010) who noted some changes in soil pH, organic carbon and available nitrogen in forest ecosystem over time. Also, Bijayalaxmi and Yadava (Citation2010) studied leaf litter-fall, litter decomposition and nutrient return through litter-fall of three dominant tree species (Quercus serrate, Schima wallichi and Lithocarpus dealbata) in soil of a sub-tropical mixed oak forest of Manipur, northeastern India. They pointed out that the nutrient release to the soil as a result of litter-fall also increased with time. From the results of this work, the percentage organic matter, organic carbon and total nitrogen do not differ significantly in all the forest types under this study. Zak et al. (Citation2003) and Nannipieri et al. (Citation2003) reported that plant diversity usually affects microbial process, which controls the rate of ecosystem nitrogen cycling. So, restoration of degraded soils could be achieved by increasing the richness of the forest as done through enrichment planting. Kobayashi (Citation2007) noted that undergrowth and litter play a significant role as cation stores in forests and therefore must be conserved in the ecosystem. The current forest practice in Nigeria, whereby degraded forests are clear-felled and converted to monoculture plantation of fast growing exotic species is detrimental to biodiversity conservation (Onyekwelu & Fuwape Citation2008). Reclamation of degraded forests with enrichment planting to preserve the indigenous tropical hardwood species therefore becomes imperative.
Conclusion
The comparison of tree species diversity, tree growth variables and yield, forest structure and soil properties in three different forest types in a tropical rainforest ecosystem were carried out in this study. The comparison was done to test the efficacy of enrichment planting for the regeneration of degraded natural forest due to human activities. Forest soil management potential of the silvicultural treatment was also verified. The EPF and the SNR are good in situ methods of biodiversity conservation as a result of their high tree species diversity, abundance and family distribution. However, the forest established through enrichment planting has the highest diversity when compared with the other two forest types. The soil conditions were also improved with enrichment planting. It therefore shows the potential of this silvicultural method in the restoration of degraded natural forest which has been claimed to be very difficult to rehabilitate once destroyed. The level of forest degradation due to over dependence on the natural forest and anthropogenic activities have led to the poor species diversity and abundance and poor soil conditions of the degraded forest. It is recommended therefore that enrichment planting should be used to support the restoration of degraded forest and soil.
Notes
Related Research Data
References
- Abubaka , HT. Jun 15–17 2010 . “ Many Species One Planet One Future. A ” . In Proceeding of the 3rd Annual Conference of the Institute of Ecology and Environmental Studies , Edited by: Address , Keynote , Ofoezie , I , Awotoye , O and Adewole , M. B . Jun 15–17 , Ile Ife , , Nigeria; 2010 : OAU .
- Adekunle , VAJ. 2006 . Conservation of tree species diversity in tropical rainforest ecosystem of south-west Nigeria . J Trop For Sci. , 18 : 91 – 101. .
- Adekunle , VAJ and Olagoke , AO. 2010 . The impacts of timber harvesting on residual trees and seedlings in a tropical rain forest ecosystem, south western Nigeria . Int J Biodivers Sci Ecosyst Serv Manage. , 6 : 131 – 138 .
- Adekunle , VAJ , Olagoke , AO and Akindele , SO. 2013 . Tree species diversity and structure of a Nigerian strict nature reserve . Trop Ecol. , 54 : 275 – 288. .
- Adekunle , VAJ , Olagoke , AO and Ogundare , LF. 2010 . Rate of timber production in a tropical rainforest ecosystem of Southwest Nigeria and its implications on sustainable forest management . J Forest Res. , 21 : 225 – 230 .
- Bijayalaxmi , ND and Yadava , PS. 2010 . Influence of climate and litter quality on litter decomposition and nutrient release in sub-tropical forest of Northeaster India . J Forest Res. , 21 : 143 – 150. .
- Bremner , JM . 1965 . “ Total nitrogen. In: Black CA, editor ” . In Methods for soil analysis, Part 2: chemical and microbiological properties , 1149 – 1178 . Madison , WI : American Society of Agronomy, Inc. .
- Brown , N , Jennings , S and Clements , T. 2003 . The ecology, silviculture and biogeography of mahogany (Swietenia macrophylla): a critical review of the evidence . Perspect Plant Ecol Evol Syst. , 6 : 37 – 49 .
- Chowdhury , MAM , Auda , MK and Isea , ASMT. 2000 . Phytodiversity of Dipterocarpus turbinatus Gaertn. F. (Garjan) undergrowths at Dulahazara garjan forest, Cos'B Bazar, Bangladesh . Indian For. , 126 : 674 – 684 .
- Dalmacio , MV. 1986 . Assisted natural regeneration: a strategy for cheap, fast, and effective regeneration of denuded forest lands , Tacloban City : Manuscript, Philippines Department of Environment and Natural Resources Regional Office .
- De Groot , RS , van der Perk , J , Chiesura , A and Marguliew , S. 2000 . “ Ecological functions and socio-economic values of critical natural capital as a measure for ecological integrity and environmental health ” . In Implementing ecological integrity: restoring regional and global environmental and human health. NATO-Science Series, IV. Earth and Environmental Sciences , Edited by: Crabbe , P , Holland , A , Ryszkowski , L and Westra , L . Vol. 1 , 191 – 214 . Dordrecht : Kluwer Academic Publishers .
- De Groot , R , Wilson , MA and Boumans , RM. 2002 . A typology for the classification, description and valuation of ecosystem functions, goods and services . Ecol Econ. , 41 : 393 – 408 .
- Diaz , S , Fargione , J , Chapin , FS and Tilman , D. 2006 . Biodiversity loss threatens human well-being . PLoS Biol. , 4 : 277
- [FAO] Food and Agricultural Organization . 2000 . Global forest resources assessment main report . FAO Forestry Paper , 140 : 479
- [FAO] Food and Agriculture Organization of the United States . 2005 . State of the world's forests , Rome : FAO .
- Forest Restoration Research Unit . 2005 . How to plant a forest: the principles and practice of restoring tropical forests , Chiang Mai : Biology Department, Science Faculty, Chiang Mai University .
- Fox , BJ , Jennifer , ET , Marelyn , DF and Williams , C. 1997 . Vegetation changes across edges of rainforest remnants . Biol Conserv. , 82 : 1 – 13 .
- Gerold , G. 2001 . “ The pedo-ecological consequences of different land use systems in the lowlands of Bolivia (Dep. of Santa Cruz) ” . In Conservation agriculture, a worldwide challenge , Edited by: Garica-Torres , L , Benites , J and Martinez-Vilela , A . 275 – 279 . Cordoba : ECAF AND FAO .
- Goosem , SP and Tucker , NIJ. 1995 . Repairing the rainforest – theory and practice of rainforest re-establishment in North Queensland's wet tropics , Cairns : Wet Tropics Management Authority .
- Hengeveld , R. 1996 . Measuring ecological biodiversity . Biodivers Lett. , 3 : 58 – 65 .
- Husch , B , Beers , TW and Kershaw , JA Jr . 2003 . Forest mensuration , 4th , 443 Hoboken , NJ : John Wiley and Sons, Inc .
- Jones , APD. 1948 . The natural forest inviolate plot, Akure Forest Reserve, Ondo Province, Nigeria , 33 Ibadan : Nigerian Forest Department .
- Kadavul , K and Parthasarathy , N. 1999 . Structure and composition of woody species in tropical semi-evergreen forest of Kalayan hills, Eastern Ghats, India . Trop Ecol. , 40 : 247 – 260 .
- Keay , RWJ. 1989 . Trees of Nigeria. A revised version of vols. 1–2 of Nigerian trees , 476 Oxford : Clarendon Press .
- Kent , M and Coker , P. 1992 . Vegetation description and analysis: a practical approach , London : Belhaven press .
- Khera , N , Kumar , A , Ram , J and Tewari , A. 2001 . Plant biodiversity assessment in relation to disturbance in mid elevation forest of central Himalaya, India . Trop Ecol. , 42 : 83 – 95 .
- Knowles , OH and Parrotta , J. 1995 . Amazonian forest restoration: An innovative system for native species selection based on phenological data and performance indices . Commonw Forest Rev. , 74 : 230 – 243 .
- Kobayashi , S. 2007 . An overview of techniques for the rehabilitation of degraded tropical forests and biodiversity conservation . Curr Sci. , 93 : 1596 – 1603. .
- Kurz , C , Couteaux , MM and Thiery , JM. 2000 . Residence time and decomposition rate of Pinus pinaster needles in a forest floor from direct field measurement under a Mediterranean climate . Soil Biol Biochem. , 3 : 1197 – 1206 .
- Lamb , D , Erskine , PD and Parrotta , JA. 2005 . Restoration of degraded tropical forest landscapes . Science. , 310 : 1628 – 1632 .
- Lü , XT , Yin , JX and Tang , JW. 2010 . Structure, tree species diversity and composition of tropical seasonal rainforests in Xishuangbanna, south-west China . J Trop For Sci. , 22 : 260 – 270 .
- Magurran , AE. 2004 . Measuring biological diversity , Oxford : Blackwell .
- Makana , J and Thomas , SC. 2006 . Impacts of selective logging and agricultural clearing on forest structure, floristic composition and diversity, and timber tree regeneration in the Ituri forest, Democratic Republic of Congo . Biodivers Conserv. , 15 : 1375 – 1397 .
- Mishra , B , Tripathi , OP , Tripathi , RS and Pandey , HN. 2004 . Effects of anthropogenic disturbance on plant diversity and community structure of a sacred grove in Meghalaya, northeast India . Biodivers Conserv. , 13 : 421 – 436 .
- Miyawaki , A. 1999 . Creative ecology: restoration of native forests by native trees . Plant Biotechnol. , 16 : 15 – 25 .
- Motz , K , Sterba , H and Pommerening , A. 2010 . Sampling measures of tree diversity . Forest Ecol Manage. , 260 : 1985 – 1996 .
- Myers , N. 1990 . The biodiversity challenge: expanded hot-spots analysis . Environmentalist. , 10 : 243 – 256 .
- Nannipieri , P , Ascher , J , Ceccherini , MT , Landi , L , Pietramellara , G and Renella , G. 2003 . Ecological significance of the biological activity in soil biochemistry . Eur J Soil Sci. , 54 : 655 – 670 .
- Ola-Adams , BA and Hall , JB. 1987 . Soil-Plant relations in a natural forest inviolate plot at Akure, Nigeria . J Trop Ecol. , 3 : 57 – 74 .
- Onyekwelu , JC , Adekunle , VAJ and Adeduntan , SA. 2005 Nov 7–11; p. 2005 . “ Does tropical rainforest ecosystem posses the ability to recover from severe degradation? ” . In Popoola L, Mfon P, Oni PI, editors. Sustainable forest management in Nigeria: lessons and prospects , 2005 Nov 7–11; p. , 145 – 163 . Kaduna, Nigeria : Proceeding of the 30th Annual Conference of Forestry Association of Nigeria .
- Onyekwelu , JC and Fuwape , JA. 2008 . Conservation and restoration of degraded forest landscapes in rainforest zones of Nigeria through reforestation projects . For For Prod J. , 1 : 29 – 39 .
- Onyekwelu , JC , Mosandl , R and Stimm , B. 2008 . Tree species diversity and soil status of primary and degraded tropical rainforest ecosystems in south-western Nigeria . J Trop For Sci. , 20 : 193 – 204. .
- Onyekwelu , JC , Mosandl , R and Stimm , B. 2010 . Effect of land-use systems and seasonal variation on microbial biomass and population in tropical rainforest soils . Nigerian J For. , 40 : 60 – 68 .
- Oyebo , MA . 2006 . “ History of forest management in Nigeria from 19th century to date ” . In Imperatives of space Technology for sustainable forest management. Proceedings of an International Stakeholders' Workshop; 2006 Mar 27 and 28; , Edited by: Ayobami , TS . 1 – 14 . Abuja : National Space Research and Development Agency .
- Parrotta , JA. 2000 . “ Catalysing natural forest restoration on degraded tropical landscapes ” . In Forest restoration for wildlife conservation , Edited by: Elliot , S , Kerby , J , Blakesley , D , Hardwick , K , Woods , K and Anusarnsunthorn , V . Chiang Mai : International Tropical Timber Organization and the Forest Restoration Research Unit, Chiang Mai University .
- Ribeiro , MC , Metzger , JP and Martensen , AC. 2009 . The Brazilian Atlantic Forest: how much is left, and how is the remaining forest distributed? Implications for conservation . Biol Conserv. , 142 : 1141 – 1153 .
- Saiter , FZ , Guilherme , FAG , Thomaz , LD and Wendt , T. 2011 . Tree changes in a mature rainforest with high diversity and endemism on the Brazilian coast . Biodivers Conserv. , 20 : 1929 – 1949. .
- Santa , R. 2001 . Litter fall, decomposition and nutrient release in three semi-arid forests of the Duero basin, Spain . Forestry. , 74 : 347 – 358 .
- Shono , K , Davies , SJ and Chua , YK. 2007 . Performance of 45 native tree species on degraded lands in Singapore . J Trop For Sci. , 19 : 25 – 34 .
- Singh SP. 2010. Impact of forest degradation on carbon density in soil and vegetation of Shorea robusta (Sal) forests in part of Siwalik hills of Dehradun, India using geospatial techniques [M.Sc. Thesis]. Dehradun: Indian Institute of Remote Sensing, National Remote Sensing Center, Indian Space Research Organization; p. 97.
- Van Wilgen , BW , Nel , JL and Rouget , M. 2007 . Invasive alien plants and South African Rivers: a proposed approach to the prioritization of control operations . Fresh Water Bio , 52 : 711 – 723 .
- Walkley , A and Black , IA . 1934 . An examination of the Degtjareff method for determining soil organic matter and a proposed modification of the chromic acid titration method . Soil Sci , 37 : 29 – 38 .
- Zak , DR , Holmes , WE , White , DC , Peacock , AD and Tilman , D. 2003 . Plant diversity, soil microbial communities, and ecosystem function . are there any links? Ecology. , 84 : 2042 – 2050. .
- Zhou , HU , Yizhong , LV and Baoguo , LI. 2009 . Advancement in the study on quantification of soil structure . Acta Pedologica Sinica. , 46 : 502 – 505. .