
Abstract
Biodiversity conservation approaches are increasingly being implemented at the landscape-scale to support the maintenance of metapopulations and metacommunities. However, the impact of such interventions on the provision of ecosystem services is less well defined. Here we examine the potential impacts of landscape-scale conservation initiatives on ecosystem services, through analysis of five case study areas in England and Wales. The provision of multiple ecosystem services was projected according to current management plans and compared with a baseline scenario. Multicriteria analysis indicated that in most cases landscape-scale approaches lead to an overall increase in service provision. Consistent increases were projected in carbon storage, recreation and aesthetic value, as well as biodiversity value. However, most study areas provided evidence of trade-offs, particularly between provisioning services and other types of service. Results differed markedly between study areas, highlighting the importance of local context. These results suggest that landscape-scale conservation approaches are likely to be effective in increasing ecosystem service provision, but also indicate that associated costs can be significant, particularly in lowland areas.
1. Introduction
In recent years there has been a shift in emphasis in conservation management, from a focus on managing populations of threatened species at single sites towards landscape-scale management approaches (Lindenmayer et al. Citation2008; Levi et al. Citation2009; Jones Citation2011). This trend has been supported by developments in ecological theory relating to the dynamics of metapopulations (Hanski Citation1999, Citation2001) and metacommunities (Leibold et al. Citation2004), and the development of landscape ecology as a scientific discipline (Turner Citation2005). Such research has highlighted the importance of maintaining ecological processes at the landscape scale, such as dispersal, colonisation and migration, to ensure the persistence of ecological communities and their component species. Landscape-scale approaches to conservation are also required to address the many causes of biodiversity loss that operate at large spatial scales, such as habitat conversion and fragmentation, overexploitation and climate change (Jones Citation2011).
A number of different landscape-scale conservation approaches have been developed, such as metapopulation management (Rouquette & Thompson Citation2007), trans-frontier conservation landscapes (Smith et al. Citation2008), ecological networks and ‘rewilding’. The development of ecological networks is perhaps the most widespread of these in terms of its practical application, with many countries now incorporating the concept into policy (Jongman & Pungetti Citation2004; Jones-Walters Citation2007). More than 42 ecological network initiatives have been established in different parts of Europe, at a variety of scales (Boitani et al. Citation2007). Ecological networks may be broadly defined as networks of areas that are connected to enhance biodiversity conservation, typically through the establishment of corridors and buffer zones to facilitate the dispersal and migration of species (Boitani et al. Citation2007).
In contrast, ‘re-wilding’ involves the large-scale (re)introduction of populations of large herbivores that are allowed to roam freely to provide ‘naturalistic grazing’ (Hodder & Bullock Citation2009). Such re-wilding approaches are intended to mimic the ‘natural’ situation that is believed to have prevailed over much of northwest Europe prior to the introduction of agriculture in the Neolithic period (ca. 8000–5000 BP) (Vera Citation2000). Examples of large-scale naturalistic grazing initiatives include the Oostvaardersplassen and Veluwezoom National Park in the Netherlands (Hodder et al. Citation2005), and Knepp Estate, Wicken Fen and Ennerdale in the United Kingdom (Taylor Citation2009). These have parallels in the concept of ‘Pleistocene rewilding’ currently being explored in both North and South America (Galetti Citation2004; Rubenstein et al. Citation2006).
While the potential benefits of implementing biodiversity conservation at a landscape-scale are widely appreciated, impacts on the provision of ecosystem services are much less well understood. Ecosystem services, or the benefits provided by ecosystems to people, have recently become a major focus of environmental policy and practice (Fisher et al. Citation2008; Balmford et al. Citation2011; Kareiva et al. Citation2011). Although a number of recent reviews have highlighted the need for landscape-scale analyses of ecosystem services, to understand spatial variability in their production and flow (Anton et al. Citation2010; de Groot et al. Citation2010; Balmford et al. Citation2011), the spatial analysis of ecosystem services is still at a relatively early stage (Martinez-Harms & Balvanera Citation2012; Schägner et al. Citation2013) with a need for increased rigour in methodologies (Crossman, Bryan, et al. Citation2013). Examples of recent studies include analyses of the impacts of land-use change on ecosystem services at national (Eigenbrod et al. Citation2009), regional (Grêt-Regamey et al. Citation2008; Li et al. Citation2010; Liu et al. Citation2010; Swetnam et al. Citation2010) and catchment (Martinez et al. Citation2009) scales, as well as investigations designed to support spatial planning and management decisions both in terrestrial (Egoh et al. Citation2008; Petz & van Oudenhoven Citation2012) and marine environments (White et al. Citation2012). However, few previous studies have explicitly considered the potential impact of landscape-scale approaches to biodiversity conservation on the provision of ecosystem services. Such information is urgently required, given the increasing policy emphasis on landscape-scale approaches to conservation in countries such as the United Kingdom (Lawton et al. Citation2010).
The objective of this investigation was to determine whether landscape-scale management interventions might increase the provision of ecosystem services. This was achieved through spatial analysis of ecosystem services within five case study areas from the United Kingdom. The research builds on a previous detailed investigation conducted in a single study area, the catchment of the River Frome in Dorset, UK, which examined the cost-effectiveness of establishing ecological networks (Newton et al. Citation2012). The current analysis extends this approach to consider other forms of landscape-scale intervention, including ‘rewilding’ and large-scale habitat restoration. The analytical framework adopted here is based on that described by Balmford et al. (Citation2011), which focuses on quantifying the marginal benefits and costs associated with changes in ecosystem services resulting from a policy action, through comparison of counterfactual scenarios. This recognises the need to compare alternative policy actions to provide robust estimates of both benefits and costs (Fisher et al. Citation2008; Nelson et al. Citation2009).
2. Methods
Five case study areas were selected that have either implemented or have planned a landscape-scale conservation management approach. A range of landscape types were selected to explore the implications of different environmental contexts. These included upland and lowland farmed landscapes () and were situated across several regions of England and Wales (). Three (Knepp Castle, Great Fen Project, Wild Ennerdale) were characterised by single ownership or close collaboration between a small number of landowners extending over the entire landscape, whereas the other two (Frome catchment, Pumlumon) involved implementation of management actions in localised patches of the wider landscape, with the aim of increasing inter-patch connectivity and habitat quality.
Figure 1. Location of the five case study areas.
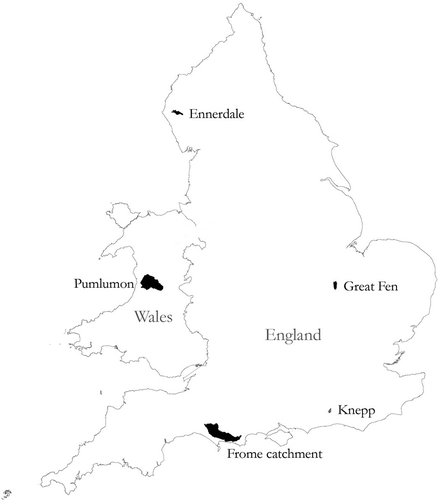
Table 1. Characteristics of the case study landscapes.
2.1. Stakeholder consultation
In order to evaluate the baseline provision of ecosystem services for each of the study areas and to explore stakeholder perceptions of how this might change as a result of the landscape-scale management interventions, information was elicited from local experts associated with each case study. This was achieved using a questionnaire survey, which asked respondents to assess the relative importance of selected ecosystem services within their respective study areas. In each case, importance was scored on a six-point Likert scale, from 0 (zero) to 5 (very high). Values were requested both for before the implementation of landscape-scale management, and for the year 2060 as the projected result of implementation. The respondents were representatives of each case study area, who were each closely involved with the landscape-scale initiatives, and were either the landowners or managers associated with conservation NGOs (e.g. Wildlife Trusts, National Trust) or representatives of government agencies (e.g. Forestry Commission). The number of respondents depended on the tenure in each case, with 17 stakeholders included overall. The ecosystem services were selected on the basis of an initial scoping study conducted with the same respondents to ensure that all services considered to be of significant importance at either date were included. This resulted in eight services being selected for analysis, namely food (including cultivated crops, livestock, fish, game and other wild foods), fibre/raw materials (including timber, plant fibre, animal skins, wool), energy/fuel (including fuelwood, biofuel crops, hydroelectric energy), freshwater provision (incorporating both water quality and quantity), flood protection (including regulation of surface water run-off), nature-based recreation (including walking, horse-riding, cycling, climbing, swimming, nature-watching, etc.), aesthetic benefits (including spiritual, cultural and heritage values) and carbon storage.
2.2. Scenarios of land-cover change
To evaluate the potential impacts of landscape-scale management on ecosystem service provision, counterfactual scenarios of land cover were developed for each study area, for the services identified by the stakeholder survey. In each case, scenarios were developed for (i) a pre-project baseline (PP), representing the situation prior to the management intervention, and (ii) a projected future (LS) showing the expected land cover in 2060, assuming that a timeline of 50 years allows successful implementation of the landscape-scale project (). Land-cover maps for the future scenarios were developed in collaboration with case study representatives based on the strategies and assumptions of the management vision and associated plans, and guided where possible by local knowledge. The PP scenarios were supported by land-cover maps produced using existing vegetation survey or remotely sensed land cover data, as detailed below.
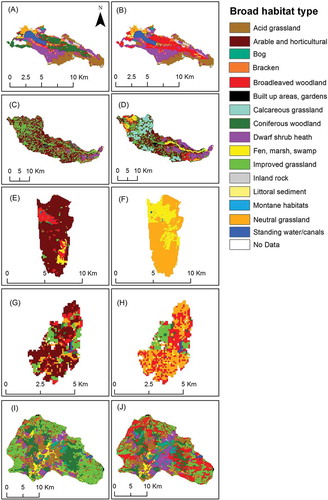
In Wild Ennerdale, the PP scenario was developed from a vegetation survey undertaken in 2002–2004 at the outset of the project (Jerram Citation2003a, Citation2003b, Citation2004), together with local knowledge and planning documents. This map was modified by incorporation of forest inventory data (Forestry Commission, UK) to provide greater detail for evaluation of timber production. For the LS scenario, the Wild Ennerdale Stewardship Plan (Wild Ennerdale Citation2006) was applied with extensive tree felling and minimum intervention regeneration, leading to an increase in broadleaved and mixed woodland in place of conifer woodland, along with associated habitat changes ()). In the Great Fen, the PP scenario was based on a national land-cover map (CEH Land Cover Map 2000) (Fuller et al. Citation2002), which was modified to correct misclassifications (following Mountford et al. Citation2002). A future habitat scenario developed for the Great Fen project based on LIDAR data, topography and analysis of water levels was used and modified to include the entire project area (scenario 2 in CEH 2006; )). In Knepp Castle, the PP scenario represented the Estate just prior to the start of the project in 2000. A habitat survey from 2005 (Greenaway Citation2006) was modified in the light of local knowledge to represent PP conditions. The Estate management plan provided a vision map of the potential land cover in 2060, for the LS scenario ()). In Pumlumon, a recent habitat survey produced by the project was used for the PP scenario ()). For the LS scenario, this map was amended using the CCW Upland Strategy mapping methodology (Jones Citation2007), supported by maps of potential grassland and woodland development produced by the project ()). For the Frome catchment case study, a PP scenario was generated using the CEH Land Cover Map 2000 (Fuller et al. Citation2002), whereas the LS scenario was based on the South West Nature Map (Brenman Citation2005), which identifies areas for habitat restoration with the aim of creating ecological networks. Biodiversity restoration targets of the Strategic Nature Areas (SNAs) incorporated in the South West Nature Map were used to guide simulation of land-cover conversions by extending existing habitat patches in a GIS buffering process (following Newton et al. Citation2012; )).
Figure 2. Land-cover maps for the pre-project baseline (left column) and projected scenarios following landscape scale intervention (right column): Ennerdale (A, B); Frome catchment (C,D); Great Fen (E, F); Knepp (G,H); Pumlumon (I,J).
2.3. Impact of scenarios on provision of ecosystem services
Ecosystem services were selected for analysis based on scoping of available empirical data, in consultation with representatives of the case study areas. This resulted in exclusion of two of the eight services identified in the stakeholder survey, namely energy/fuel and freshwater provision, owing to a lack of appropriate data. The change in potential ecosystem service provision associated with implementation of landscape-scale management was then estimated for the remaining six services for each of the case study areas.
Provisioning services (food and fibre) were each assessed using market prices, reflecting the fact that they are tangible goods. This approach has been widely adopted in previous research (Chan et al. Citation2006; Kettunen et al. Citation2009; Nelson et al. Citation2009; Pascual et al. Citation2010). Valuation methods were developed using a combination of site-based, UK standard or generalised data sources. In the case of food, recorded or predicted crop and dairy yields, together with livestock numbers, were sourced. For crops, livestock and dairy products, gross margin values obtained from Nix (Citation2010) were used to convert the production estimates to monetary value. For timber, estimates of cumulative timber yield (m3 ha−1) for generalised broadleaved and conifer forest were derived using the Forestry Commission ‘Forest Yield’ software, which is based on yield models for forest management (Edwards & Christie Citation1981). Oak and birch were used to model the broadleaf yields and Sitka spruce was used for conifer timber. This approach takes account of overall extraction throughout the rotation, including the value of timber removed through thinning. The average standing sale price for broadleaved and conifer timber, provided by the UK Forestry Commission, was then used to calculate a monetary value per hectare. This can be interpreted as a net value; although the planting costs were not included, this is generally offset by sale as a standing crop. The value of reed production was also included in the wetland site (Great Fen), based on estimated productivity of 623 bundles ha–1 yr–1 (following Sanderson & Prendergast Citation2002) and the market price given in PACEC (Citation2004).
Carbon storage values for each land-cover type were derived from those presented by Cantarello et al. (Citation2011). In cases where data for land-cover types were not available from this source, mean values from ecologically similar land-cover types were used, following Kettunen et al. (Citation2009). The market value of the carbon was calculated using official values of the UK Government (DECC Citation2009). Recreation was assessed as market price represented by willingness to pay (WTP). Local WTP studies were not available, so the benefits transfer method was used, following a number of recent studies (e.g. Tinch & Provins Citation2007; O’Gorman & Bann Citation2008; Natural England Citation2009). Where possible, values from sites of comparable character in terms of quality of provision and population size were sought, following EFTEC (Citation2010). For each scenario, the WTP values of different recreational activities were weighted using local knowledge of the popularity of the activity within each case study area, then combined to give an overall value.
Aesthetic value was assessed using scores based on GIS indicators of aesthetic attributes of land-cover types identified from the CPRE Tranquillity Mapping study (Jackson et al. Citation2008). For compatibility with the habitat data available, the CPRE ‘naturalness’ values were aligned to CEH Land Cover Map 2000 habitat types. Habitat classifications for each of the case study sites were then aligned to the CEH Land Cover Map 2000 habitat classifications using JNCC (Citation2008). Flood risk mitigation was assessed using the method developed by the Environment Agency (Citation2008), which provides an index of relative change in flood risk depending on land-cover type. This index is based on several factors: the ‘sensitivity’ of land-cover types and soil types to land-use change and the rainfall and slope characteristics that indicate the likelihood of rapid runoff. It was assumed that soil type, topography and rainfall would remain the same under the scenarios explored here, and therefore any change in flood risk would entirely be the consequence of land-cover change. Each land-cover type was associated with a ‘sensitivity index value’ derived from Environment Agency (Citation2008), where flood risk is ranked from 1 (lowest) to 4 (highest). These values reflect variation in capacity for run-off generation of different land-cover types. Scores were normalised then inverted (by subtracting each transformed value from 1) so that the maximum value of 1 equates to maximum flood risk mitigation. The scenarios were then compared by analysing the proportion of land cover associated with different flood risk sensitivity scores.
To assess the marginal difference in potential ecosystem service provision, maps were produced for each ecosystem service for both PP and LS, based on the land-cover maps. Values were normalised on a 0–1 scale and reclassified into 10 equal classes, and a mean value per unit area of each land-cover type was then calculated. Total values for each scenario were calculated by multiplying these values by the area of each respective land-cover type, and summing them across the study area.
Multicriteria analysis (MCA) was used to explore the relative effectiveness of the PP and LS scenarios in providing ecosystem services, enabling both economic and non-economic values to be incorporated in the same analysis. The MCA was performed using DEFINITE 3.1.1.7® (Institute for Environmental Studies, Amsterdam, The Netherlands), using a maximum standardisation method. The analysis was performed weighting each of the ecosystem services equally and was then repeated by weighting each criterion according to its current economic value. In the latter case, the three non-market ecosystem services (flood protection, recreation, aesthetic benefits) were each accorded a zero weight. Economic weights for the remaining three services were derived from Newton et al. (Citation2012), namely 51.67, 6.27 and 36.75 for carbon storage, food and fibre, respectively.
2.4. Biodiversity value
Two measures were used to assess the impact of landscape-scale interventions on value for biodiversity. First, the PP and LS land-cover maps were used to estimate the current and projected areas of habitats of conservation importance in each of the study areas, focusing on those habitats identified in the UK Biodiversity Action Plan (BAP) (Maddock Citation2008). This was achieved by aligning the habitat records for each site with BAP and EU habitat types using JNCC (Citation2008), supported by expert consultation with case study representatives. The distinction between ‘upland’ and ‘lowland’ BAP habitats, for example, heathland in Pumlumon and Ennerdale, was determined by calculating the area above or below 300 m using a digital terrain model (Maddock Citation2008). Second, an Ecological Impact Assessment (EcIA) was conducted following Rouquette et al. (Citation2009). This involved scoring habitats present within each study area on a scale of 1–6, reflecting their conservation importance (ranging from being a local to an international priority) and significance (ranging from <1% regional resource of the habitat to >5% national resource, within a case study area). The mean score for all habitats across each site was then calculated, following Rouquette et al. (Citation2009).
2.5. Estimation of costs
Estimates of implementation and running costs for the landscape-scale interventions were obtained from each of the case studies by consultation of project representatives, and by reference to available documents, such as business plans. Such data were lacking for Frome, and therefore published data on agri-environment scheme costs were used here instead (Newton et al. Citation2012).
3. Results
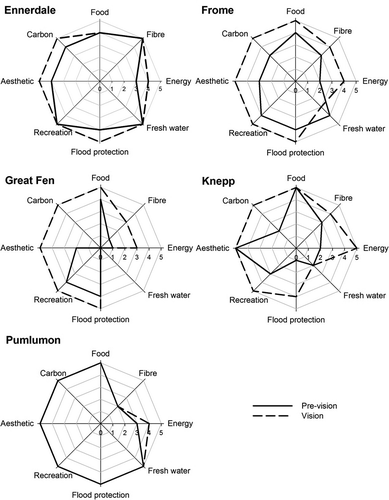
The results of the stakeholder consultation illustrate the impacts of the landscape-scale interventions on ecosystem service provision that are anticipated by the leading actors involved. Results indicate a high degree of variation between the different case studies. Whereas some study areas (e.g. Frome, Great Fen, Knepp) anticipated a major increase in the provision of multiple ecosystem services, others expected much less change (). Results also differed between services; while energy provision was expected to increase in all study areas, freshwater provision was expected to increase in none. Very few services were projected to decline in any case study area; the only exception was freshwater in Frome ().
Figure 3. Importance of ecosystem services. The relative importance of ecosystem services within case study areas as estimated by site representatives both for before the implementation of landscape-scale management (pre-vision) and for the year 2060 as the projected result of implementation (vision). Importance is on a six-point scale from 0 (zero) to 5 (very high).
Each of the case study areas projected significant changes in land cover as a result of the implementation of the initiatives ()–()). In Ennerdale, the principal projected change was an increase in broadleaved woodland area and an associated reduction in area of conifer plantations, together with an increase in area of dwarf shrub heath. In Frome, substantial declines in agricultural land and conifer woodland were associated with an increase in areas of calcareous grassland, dwarf shrub heath and fen. In Great Fen, the principal changes were a projected increase in the area of neutral grassland and fen, with reductions in arable land and broadleaved woodland. Conversely in Knepp, an increase in woodland and acid grassland was anticipated, with significant reductions in cropland and neutral grassland. In Pumlumon, principal increases were expected in area of bogs, broadleaved woodland, acid grassland and dwarf shrub heath, whereas conifer woodland, improved grassland and fen were projected to decline.
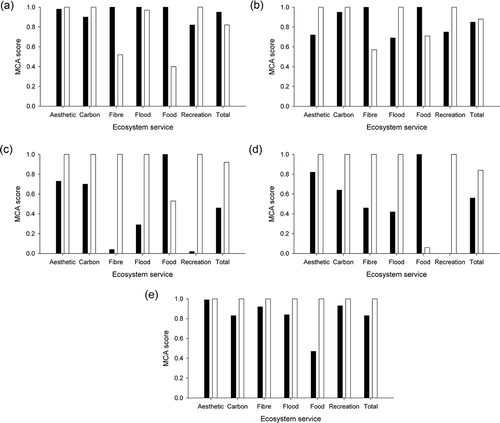
MCA analysis of changes in ecosystem service provision as a result of the projected land-cover changes indicated that landscape-scale interventions are generally projected to have a positive impact on overall provision of the ecosystem services considered here. This is indicated by the fact that the total combined MCA scores were higher for the LS than the PP scenario in four of the five case studies considered, the exception being Ennerdale, where the converse outcome was obtained (). MCA scores for the individual ecosystem services showed contrasting responses in the different case studies. For example, while LS scores were higher than PP values for all ecosystem services in Pumlumon, all other case studies indicated lower values for food in LS than PP, and two cases (Ennerdale and Frome) also demonstrated lower values for fibre in LS (). Aesthetic value, recreation and carbon storage all consistently showed higher values in LS than PP scenarios, as did flood protection in all cases other than Ennerdale. Similar results were obtained when the ecosystem services were weighted according to their monetary value (data not illustrated). In every case the overall pattern of responses of total MCA scores was identical with or without such weighting, although the magnitude of the difference between LS and PP scenarios differed if weighting was applied.
Figure 4. Evaluation of scenarios based on results of MCA, incorporating equal weighting of all services, including those with market and non-market values. Scores presented are the weighted sum of the criteria scores, provided as an output of the MCA. Filled bars indicate the pre-project scenario; empty bars the landscape-scale scenarios. (a) Ennerdale, (b) Frome, (c) Great Fen, (d) Knepp and (e) Pumlumon.
As expected, implementation of landscape-scale interventions was also projected to have a positive impact on biodiversity value. In every case, LS scenarios were projected to result in an increase in BAP habitat area, by up to 622% in the case of Knepp, although values differed markedly between study areas (). EcIA scores were also projected to increase in all areas except Pumlumon. The latter result is explicable in terms of trade-offs between habitat types; for example, the planned expansion of woodland in Pumlumon would be associated with a decline in area of other BAP habitats, including upland heathland and acid grassland.
Table 2. Summary of changes in Ecological Impact Assessment (EcIA) score and total area of Biodiversity Action Plan (BAP) habitat between the landscape-scale (LS) and pre-project (PP) scenarios.
When the monetary value of three ecosystem services was considered (i.e. for carbon storage, fibre and food), a decline in the total value of food production was projected to occur in all study areas, with the exception of Pumlumon. The magnitude of these declines varied strongly between case studies, ranging from £36,380 yr–1 in Knepp to £5,193,636 yr–1 in Frome. Similarly the marginal value of fibre was projected to decline in two case studies (Ennerdale and Pumlumon), but to increase in a third (Great Fen) as a result of an increase in reed production. Carbon storage was projected to increase in all study areas, with an increase in marginal value of at least £11 million across the entire landscape, based on the carbon value presented by DECC (Citation2009).
Project costs differed markedly between study areas (). For example, set-up costs differed by more than three orders of magnitude, with lower values being recorded in upland than in lowland study areas. Annual running costs varied by a factor of 10 when calculated per unit area, varying from approximately £15 ha–1 in Pumlumon to almost £150 ha–1 in Knepp. Again, running costs were higher in lowland than in upland areas.
Table 3. Estimated marginal costs associated with the landscape-scale projects, derived from representatives of the case study areas and supporting project documentation.
4. Discussion
These results provide evidence that landscape-scale conservation management interventions can potentially increase provision of a range of ecosystem services. Although such an outcome has been hypothesised previously (e.g. Lawton et al. Citation2010), relatively little evidence is available to support this suggestion. This investigation also highlights the value of analysing multiple case studies using comparable approaches to enable the identification of generally applicable results. However, the identification of such generalisation is hindered by the contrasting results obtained in different locations. Previous investigations that have performed comparative spatial analyses of multiple ecosystem services in a range of different landscapes, such as Birch et al. (Citation2010), have similarly identified substantial variation between different case study areas. This emphasises the importance of local context in assessing the provision of ecosystem services, particularly when locally important values are factored into the assessment (Newton et al. Citation2012). Despite such variation, the current results identified an increase in the overall provision of ecosystem services in four of the five case studies considered.
Clearly, the results obtained will have been influenced by the selection of ecosystem services for analysis; other results might have been achieved had different services been included here. However, some services, such as aesthetic value, recreation and carbon storage, responded consistently across all case studies despite the contrasting environmental contexts and management approaches adopted. While flood risk mitigation was also projected to increase in four of the five case studies in the LS scenario, its projected decline in Ennerdale accounts for the lack of an overall increase in service provision in this case study. This can be attributed to the projected increase in dwarf shrub heath and the associated decline in area of conifer plantations, which would lead to a decline in evaporative water loss (Gilman Citation2002). A further consistent finding was the decline in food production, projected in four of the five case studies. Trade-offs between production of agricultural crops and biodiversity value have been widely recognised in the literature (e.g. Chan et al. Citation2006; Nelson et al. Citation2009; Raudsepp-Hearne et al. Citation2010), although converse relationships have also been reported (Naidoo et al. Citation2008). The case of Pumlumon presented here provides an interesting example of such a converse relationship, as a planned increase in livestock production in this case is considered to be consistent with achieving conservation goals.
Interestingly, the decline in food production projected in four case studies did not correspond to the values elicited in the stakeholder consultation. This highlights the value of spatial analysis and the development of scenarios, as recommended by Balmford et al. (Citation2011), to analyse the potential impact of interventions on ecosystem service provision. Overall, these results suggest that conservation practitioners may have somewhat optimistic beliefs in terms of anticipating positive outcomes of planned interventions on provision of all ecosystem services. One of the principal values of analyses presented here might therefore lie in increasing the recognition among practitioners of potential trade-offs, supporting suggestions made by previous authors (Nelson et al. Citation2009; Raudsepp-Hearne et al. Citation2010). However, one of the limitations of the current approach is that it focuses exclusively on changes in land cover and not condition or function (Verburg et al. Citation2009; Crossman, Bryan, et al. Citation2013). Conceivably, the management interventions being planned by the initiatives examined here could lead to improvements in the condition of existing habitats, which could be associated with increased provision of services.
Further limitations of this analytical approach arise from the uncertainties associated with scenario development. It is assumed here, for example, that implementation of proposed interventions will lead to the changes in land cover that are projected, and this will in turn lead to increased provision of associated services. The uncertainties associated with using proxies such as benefits transfer methods together with land-cover data for mapping ecosystem services are considered in depth by Eigenbrod et al. (Citation2010). Uncertainties include the assumption that values are constant for a particular land-cover type across the area being mapped, and the error associated with failing to account for the spatial variability in biophysical measurements of ecosystem services. In their analysis undertaken at the scale of an entire country (the United Kingdom), Eigenbrod et al. (Citation2010) found that proxies based on coarse or categorical input data (e.g. broad vegetation types) are likely to provide poor estimates of the distributions of ecosystem services. Comparable analyses of such uncertainties have not been undertaken to date for landscape-scale analyses employing higher resolution data, such as those presented here. In consequence, the results presented here should clearly be interpreted with caution. However, one of the advantages of approach applied here, involving comparison of counterfactual scenarios, is that the overall results are relatively insensitive to uncertainty in the values associated with individual services. This is illustrated by the fact that ranking of the scenarios by MCA scores was unaffected if services were weighted by their monetary values. Ideally, information would be available on the dynamics of processes underpinning service provision, such as nutrient, carbon and water cycling, and their relationship with biodiversity, for each landscape under consideration. Identification of such relationships in real-world landscapes remains a major research challenge (Balvanera et al. Citation2006; Cardinale et al. Citation2006; Tylianakis et al. Citation2008).
In the analytical approach adopted here, land cover was used as a proxy for production of different ecosystem services. While proxy approaches such as this are currently the most widely used method of mapping ecosystem services (Egoh et al. Citation2012), the approach is subject to a number of limitations (Crossman, Burkhard, et al. Citation2013). Most importantly, all areas of a given land-cover type are treated as equivalent. In reality, the provision of ecosystem services could potentially vary with ecosystem condition, an area that requires further research. A further limitation is the fact that the ecological processes underlying provision of ecosystem services are stochastic, scale-dependent and often nonlinear; they may also exhibit threshold effects. Such aspects are poorly captured by current approaches to ecosystem service mapping (Nelson & Daily Citation2010).
Although the current results suggest that landscape-scale conservation approaches are likely to increase provision of ecosystem services, such an outcome is clearly dependent on financial investment. As noted by Balmford et al. (Citation2011), the costs associated with different management interventions are difficult to estimate with precision, and the values presented here should therefore be viewed with caution. The cost estimates used here varied from £8 to £13,513 ha–1 for project set-up costs and £4 to £149 ha–1 yr-–1 for recurrent management costs, depending on the case study. These values fall within the range reported for restoration projects in a recent global review (TEEB Citation2009), but show pronounced variation among case studies.
Few analyses have been undertaken of the cost-effectiveness of landscape-scale conservation actions (Bullock et al. Citation2011). Analyses undertaken by Birch et al. (Citation2010) of the cost-effectiveness of forest restoration indicated that results are strongly dependent on the restoration methods used. In the case of the Frome case study, a detailed cost–benefit analysis was presented by Newton et al. (Citation2012), who showed that restoration costs consistently exceeded the market value of ecosystem services. However, results were found to be highly dependent on the market value of carbon. Detailed cost–benefit analyses were not performed here because of the high degree of uncertainty around such market values; currently the market price of carbon is highly volatile (Newton et al. Citation2012). There is also great uncertainty regarding the potential income that landowners might receive in return for carbon storage or for provision of other ecosystem services. However, the decline in food production projected in most of the case studies examined here would undoubtedly represent a significant opportunity cost, in addition to the costs of project inception and implementation.
Despite potential economic constraints, landscape-scale approaches appear to offer potential benefits both to biodiversity conservation and to people. Results suggest that the potential impacts on services such as recreation and aesthetic value could be substantive even if such services are not associated with a significant market value. The wider deployment of such landscape-scale initiatives, and the implementation of associated policies, will likely depend on support from a wide variety of different actors, working in partnership. Success of such projects is likely to depend strongly on public support, and in this context, the increased provision of non-market benefits could be significant. All of the case studies presented here are projected to increase recreational value for the general public, which could potentially be an important contributor to strengthening such public support in future.
Acknowledgements
This project was funded through the Department for Environment, Food and Rural Affairs Defra Competition Code: WC0758/CR0444. We are indebted to the site representatives. For Ennerdale, Gareth Browning (Forestry Commission), Rachel Oakley (National Trust), Jenny Butler and Simon Webb (Natural England); for Great Fen, Chris Gerrard (The Wildlife Trust for Bedfordshire, Cambridgeshire, Northamptonshire and Peterborough) and Alan Bowley (Natural England); for Knepp, Charlie Burrell (Knepp Castle Estate), Theresa Greenaway (Ecological Consultant) and Henri Brocklebank (Sussex Records Centre); and for Pumlumon, Clive Faulkner, Liz Lewis-Reddy, Estelle Bailey and Stephen Hughes (Montgomeryshire Wildlife Trust); Jerry Pritchard (Forestry Commission), James Harvey (Statkraft Energy Ltd), Carol Fielding (Countryside Council for Wales) and David Webb (West Wales Water). Gwion Aeron (Welsh Assembly Government) provided agri-environment scheme data and Ewan Mackie and Charene Winbow (Forestry Commission) provided standard timber values. For Frome, Andy Pollard (Dorset Wildlife Trust) Johnny O'Brien (Deer Management), Ian Danby, (BASC), Michael Ndeze (Forestry Commission). At Bournemouth University, special thanks go to Sarah Douglas, Chris Moody and Mark Dover. Finally, we would like to thank the Defra project steering group for their guidance. The CEH Land Cover Map 2000 data were used under licence agreement LCM 2010-061.
References
- Anton C, Young J, Harrison PA, Musche M, Bela G, Feld CK, Harrington R, Haslett JR, Pataki G, Rounsevell MDA, et al. 2010. Research needs for incorporating the ecosystem service approach into EU biodiversity conservation policy. Biodivers Conserv. 19(10):2979–2994.
- Balmford A, Fisher B, Green RE, Naidoo R, Strassburg B, Turner RK, Rodrigues ASL. 2011. Bringing ecosystem services into the real world: an operational framework for assessing the economic consequences of losing wild nature. Environ Res Econ. 48(2):161–175.
- Balvanera P, Pfisterer A, Buchmann N, He J-S, Nakashizuka T, Raffaelli D, Schmid B. 2006. Quantifying the evidence for biodiversity effects on ecosystem functioning and services. Ecol Lett. 9(10):1–11.
- Birch J, Newton AC, Alvarez Aquino C, Cantarello E, Echeverría C, Kitzberger T, Schiappacasse I, Tejedor Garavito N. 2010. Cost-effectiveness of dryland forest restoration evaluated by spatial analysis of ecosystem services. Proc Natl Acad Sci USA. 107(50):21925–21930.
- Boitani L, Falcucci A, Maiorano L, Rondinini C. 2007. Ecological networks as conceptual frameworks or operational tools in conservation. Conserv Biol. 21(6):1414–1422.
- Brenman S. 2005. Rebuilding biodiversity in the South West. Bristol: The South West Wildlife Trusts.
- Bullock JM, Aronson J, Newton AC, Pywell RF, Rey-Benayas JM. 2011. Restoration of ecosystem services and biodiversity: conflicts and opportunities. Trends Ecol Evol. 26(10):541–549.
- Cantarello E, Newton AC, Hill RA. 2011. Potential effects of future land-use change on carbon stocks of the south west of England. Environ Sci Pol. 14(1):40–52.
- Cardinale BJ, Srivastava DS, Duffy JE, Wright JP, Downing AL, Sankaran M, Jousseau C. 2006. Effects of biodiversity on the functioning of trophic groups and ecosystems. Nature. 443:989–992.
- Chan KMA, Shaw MR, Cameron DR, Underwood EC, Daily GC. 2006. Conservation planning for ecosystem services. PLoS Biol. 4(11):2138–2152.
- Crossman ND, Bryan BA, de Groot RS, Lin Y-P, Minang PA. 2013. Land science contributions to ecosystem services. Curr Opin Environ Sustain. 5:509–514.
- Crossman ND, Burkhard B, Nedkov S, Willemen L, Petz K, Palomo I, Drakou EG, Martín-Lopez B, McPhearson T, Boyanova K, et al. 2013. A blueprint for mapping and modelling ecosystem services. Ecosyst Serv. 4:4–14.
- DECC. 2009. Carbon appraisal in UK policy appraisal: a revised approach. A brief guide to the new carbon values and their use in economic appraisal. London: Department of Energy and Climate Change.
- de Groot R, Alkemade R, Braat L, Hein L, Willemen L. 2010. Challenges in integrating the concept of ecosystem services and values in landscape planning, management and decision making. Ecol Complexity. 7(3):260–272.
- Edwards PN, Christie JM. 1981. Yield models for forest management. Forestry Commission Booklet 48. Edinburgh: Forestry Commission.
- EFTEC. 2010. Valuing environmental impacts: practical guidelines for the use of value transfer in policy and project appraisal. Technical report. Submitted to Department for Environment, Food and Rural Affairs. London: Economics for the Environment Consultancy.
- Egoh B, Drakou EG, Dunbar MB, Maes J, Willemen L. 2012. Indicators for mapping ecosystem services: a review. Report EUR 25456 EN. Luxembourg: Publications Office of the European Union.
- Egoh B, Reyers B, Rouget M, Richardson D, Le Maitre D, Jaarsveld A. 2008. Mapping ecosystem services for planning and management. Agric Ecosyst Environ. 127(1–2):135–140.
- Eigenbrod F, Anderson BJ, Armsworth PR, Heinemeyer A, Jackson SF, Parnell M, Thomas CD, Gaston KJ. 2009. Ecosystem service benefits of contrasting conservation strategies in a human-dominated region. Proc Roy Soc B-Biol Sci. 276:2903–2911.
- Eigenbrod F, Armsworth PR, Anderson BJ, Heinemeyer A, Gillings S, Roy DB, Thomas CD, Gaston KJ. 2010. The impact of proxy-based methods on mapping the distribution of ecosystem services. J Appl Ecol. 47(2):377–385.
- Environment Agency. 2008. Delivery of making space for water. Identification of catchments sensitive to land use change. Final report. NA788. Bristol: Environment Agency.
- Fisher B, Turner K, Zylstra M, Brouwer R, de Groot R, Farber S, Ferraro P, Green R, Hadley D, Harlow J, et al. 2008. Ecosystem services and economic theory: integration for policy-relevant research. Ecol Appl. 18(8):2050–2067.
- Fuller RM, Smith GM, Sanderson JM, Hill RA, Thomson AG, Cox R, Brown NJ, Clarke RT, Rothery P, Gerard FF. 2002. Countryside Survey 2000 Module 7. Land Cover Map 2000. Final Report. Abbots Ripton (Cambridgeshire): Centre for Ecology and Hydrology.
- Galetti M. 2004. Parks of the Pleistocene: recreating the Cerrado and the Pantanal with megafauna. Natureza e Conservação. 2:93–100.
- Gilman K. 2002. Modelling the effect of land use change in the upper Severn catchment on flood levels downstream. English Nature Research Reports Number 471. Peterborough: English Nature.
- Greenaway TE. 2006. English Nature Research Reports Number 693: Knepp Castle Estate baseline ecological survey. Peterborough: English Nature.
- Grêt-Regamey A, Bebi P, Bishop ID, Schmid WA. 2008. Linking GIS-based models to value ecosystem services in an Alpine region. J Environ Manage. 89(3):197–208.
- Hanski I. 1999. Metapopulation ecology. Oxford: Oxford University Press.
- Hanski I. 2001. Spatially realistic theory of metapopulation ecology. Naturwissenschaften. 88(9):372–381.
- Hodder KH, Bullock JM. 2009. Really wild? Naturalistic grazing in modern landscapes. British Wildlife. June 2009:37–43.
- Hodder KH, Bullock JM, Buckland PC, Kirby KJ, editors. 2005. Large herbivores in the wildwood and modern naturalistic grazing systems. English Nature Research Reports No. 648. Peterborough: English Nature.
- Jackson S, Fuller D, Dunsford H, Mowbray R, Hext S, MacFarlane R, Haggett C. 2008. Tranquillity mapping: developing a robust methodology for planning support. Report to the Campaign to Protect Rural England. Northumbria University, Bluespace Environments, Newcastle University. London: CPRE.
- Janes M, Mant J, Fellick A. 2006. Knepp castle estate river Adur floodplain restoration. Pre-feasibility study of river restoration. Bedford: The River Restoration Centre.
- JNCC. 2008. NBN dictionary of habitat correspondences [Internet]. [cited 2013 Apr 3]. Available from: http://www.jncc.gov.uk/page-4266
- Jerram R. 2003a. Ennerdale Survey of National Vegetation Classification Communities. A report for the National Trust. Kendal: Rigby Jerram Ecological Consultants.
- Jerram R. 2003b. Pillar and Ennerdale SSSI Survey of National Vegetation Classification Communities. A report for English Nature. Kendal: Rigby Jerram Ecological Consultants.
- Jerram R. 2004. Wild Ennerdale Survey of National Vegetation Classification Communities. A report for the Forestry Commission. Kendal: Rigby Jerram Ecological Consultants.
- Jones B. 2007. A framework to set conservation objectives and achieve favourable condition in Welsh upland SSSIs. Bangor: Countryside Council for Wales.
- Jones JPG. 2011. Monitoring species abundance and distribution at the landscape scale. J Appl Ecol. 48(1):9–13.
- Jones-Walters L. 2007. Pan-European Ecological Networks. J Nat Conserv. 15:262–264.
- Jongman R, Pungetti G, editors. 2004. Ecological networks and greenways. Concept, design, implementation. Cambridge: Cambridge University Press.
- Kareiva P, Tallis H, Ricketts TH, Daily GC, Polasky S. 2011. Natural capital. Theory and practice of mapping ecosystem services. Oxford: Oxford University Press.
- Kettunen M, Bassi S, Gantioler S, ten Brink P. 2009. Assessing socio-economic benefits of Natura 2000 – a toolkit for practitioners. September 2009 ed. Brussels (Belgium): Institute for European Environmental Policy (IEEP).
- Lawton JH, Brotherton PNM, Brown VK, Elphick C, Fitter AH, Forshaw J, Haddow RW, Hilborne S, Leafe RN, Mace GM, et al. 2010. Making space for nature: a review of England’s wildlife sites and ecological network. London: Department for Food, Agriculture and Rural Affairs.
- Leibold MA, Holyoak M, Mouquet N, Amarasekare P, Chase JM, Hoopes MF, Holt RD, Shurin JB, Law R, Tilman D, et al. 2004. The metacommunity concept: a framework for multi-scale community ecology. Ecol Lett. 7(7):601–613.
- Levi T, Shepard GH, Ohl-Schacherer J, Peres CA, Yu DW. 2009. Modelling the long-term sustainability of indigenous hunting in Manu National Park, Peru: landscape-scale management implications for Amazonia. J Appl Ecol. 46(4):804–814.
- Li TH, Li WK, Qian ZH. 2010. Variations in ecosystem service value in response to land use changes in Shenzhen. Ecol Econ. 69(7):1427–1435.
- Lindenmayer D, Hobbs RJ, Montague-Drake R, Alexandra J, Bennett A, Burgman M, Cale P, Calhoun A, Cramer V, Cullen P, et al. 2008. A checklist for ecological management of landscapes for conservation. Ecol Lett. 11(1):78–91.
- Liu SA, Costanza R, Troy A, D’Aagostino J, Mates W. 2010. Valuing New Jersey’s ecosystem services and natural capital: a spatially explicit benefit transfer approach. Environ Manage. 45(6):1271–1285.
- Maddock A. 2008. UK Biodiversity Action Plan; Priority Habitat Descriptions [Internet]. Biodiversity Reporting and Information Group, editors. [cited 2013 Apr 3]. Available from: http://jncc.defra.gov.uk/PDF/UKBAP_PriorityHabitatDesc-Rev2011.pdf
- Martinez ML, Perez-Maqueo O, Vazquez G, Castillo-Campos G, Garcia-Franco J, Mehltreter K, Equihua M, Landgrave R. 2009. Effects of land use change on biodiversity and ecosystem services in tropical montane cloud forests of Mexico. Forest Ecol Manage. 258(9):1856–1863.
- Martinez-Harms MJ, Balvanera P. 2012. Methods for mapping ecosystem service supply: a review. Int J Biodivers Sci Ecosyst Serv Manage. 8(1–2):17–25.
- Mountford JO, McCartney MP, Manchester SJ, Wadsworth RA. 2002. Wildlife habitats and their requirements within the Great Fen project. Final report to the Great Fen Project steering group. Huntingdon (Wallingford): Centre for Ecology and Hydrology.
- Naidoo R, Balmford A, Costanza R, Fisher B, Green RE, Lehner B, Malcolm TR, Ricketts TH. 2008. Global mapping of ecosystem services and conservation priorities. Proc Natl Acad Sci USA. 105(28):9495–9500.
- Natural England. 2009. Economic valuation of upland ecosystem services. Natural England Commissioned Report NECR029. Sheffield: Natural England.
- Nelson E, Mendoza G, Regetz J, Polasky S, Tallis H, Cameron D, Chan KMA, Daily GC, Goldstein J, Kareiva PM, et al. 2009. Modeling multiple ecosystem services, biodiversity conservation, commodity production, and tradeoffs at landscape scales. Front Ecol Env. 7(1):4–11.
- Nelson EJ, Daily GC. 2010. Modelling ecosystem services in terrestrial systems. F1000 Biology Reports 2:53. doi:10.3410/B2-53.
- Newton AC, Hodder KH, Cantarello E, Perrella L, Birch JC, Robins J, Douglas S, Moody C, Cordingley J. 2012. Cost-benefit analysis of ecological networks assessed through spatial analysis of ecosystem services. J Appl Ecol. 49(3):571–580.
- Nix J. 2010. Farm Management Pocketbook [Internet]. 40th ed. [cited 2013 Apr 3]. Available from: http://www.thepocketbook.biz/
- O’Gorman S, Bann C. 2008. Valuing England’s terrestrial ecosystem services. Final report to Defra. NR0108. London: Department for Food, Agriculture and Rural Affairs.
- PACEC. 2004. The Great Fen socio economic study final report. A report prepared by PACEC on behalf of The Wildlife Trust. Cambridge: Public and Corporate Economic Consultants.
- Pascual U, Muradian R, Brander L, Gómez-Baggethun E, Martín-López B, Verma M, Armsworth P, Christie M, Cornelissen H, Eppink F, et al. 2010. The economics of ecosystems and biodiversity: the ecological and economic foundations (TEEB D0). The economics of valuing ecosystem services and biodiversity. Bonn: TEEB.
- Petz K, van Oudenhoven APE. 2012. Modelling land management effect on ecosystem functions and services: a study in the Netherlands. Int J Biodivers Sci Ecosyst Serv Manage. 8(1–2):135–155.
- Raudsepp-Hearne C, Peterson GD, Bennett EM. 2010. Ecosystem service bundles for analyzing tradeoffs in diverse landscapes. Proc Natl Acad Sci USA. 107(11):5242–5247.
- Rouquette JR, Posthumus H, Gowing DJG, Tucker G, Dawson QL, Hess TM, Morris J. 2009. Valuing nature-conservation interests on agricultural floodplains. J Appl Ecol. 46(2):289–296.
- Rouquette JR, Thompson DJ. 2007. Patterns of movement and dispersal in an endangered damselfly and the consequences for its management. J Appl Ecol. 44(30):692–701.
- Rubenstein DR, Rubenstein DI, Sherman PW, Gavin TA. 2006. Pleistocene park: does re-wilding North America represent sound conservation in the 21st century? Biol Conserv. 132(2):232–238.
- Sanderson H, Prendergast HDV. 2002. Commercial uses of wild and traditionally managed plants in England and Scotland. Kew (London): Royal Botanic Gardens.
- Schägner JP, Brander L, Maes J, Hatje V. 2013. Mapping ecosystem services’ values: current practice and future prospects. Ecosyst Serv. 4:33–46.
- Smith RJ, Easton J, Nhancale BA, Armstrong AJ, Culverwell J, Dlamini SD, Goodman PS, Loffler L, Matthews WS, Monadjem A, et al. 2008. Designing a transfrontier conservation landscape for the Maputaland centre of endemism using biodiversity, economic and threat data. Biol Conserv. 141(8):2127–2138.
- Swetnam RD, Fisher B, Mbilinyi BP, Munishi PKT, Willcock S, Ricketts T, Mwakalila S, Balmford A, Burgess ND, Marshall AR, Lewis SL. 2010. Mapping socio-economic scenarios of land cover change: a GIS method to enable ecosystem service modelling. J Environ Manage. 92(3):563–574.
- Taylor P. 2009. Re-wilding the grazers: obstacles to the ‘wild’ in wildlife management. British Wildlife. June 2009:50–55.
- TEEB. 2009. TEEB Climate Issues Update. September 2009. Geneva: UNEP.
- Tinch R, Provins A. 2007. Policy appraisal and the environment: an introduction to the valuation of ecosystem services. Wareham Managed Realignment case study. Economics for the Environment Consultancy Ltd. London: Eftec.
- Turner MG. 2005. Landscape ecology: what is the state of the science? Ann Rev Ecol Evol Syst. 36:319–344.
- Tylianakis JM, Rand TA, Kahmen A, Klein A-M, Buchmann N, Perner J, Tscharntke T. 2008. Resource heterogeneity moderates the biodiversity-function relationship in real world ecosystems. PLoS Biol. 6(5):e122. doi:10.1371/journal.pbio.0060122.
- Vera FWM. 2000. Grazing ecology and forest history. Wallingford (UK): CABI Publishing.
- Verburg PH, van de Steeg J, Veldkamp A, Willemen L. 2009. From land cover change to land function dynamics: a major challenge to improve land characterization. J Environ Manage. 90:1327–1335.
- White C, Halpern BS, Kappel CV. 2012. Ecosystem service tradeoff analysis reveals the value of marine spatial planning for multiple ocean uses. Proc Natl Acad Sci USA. 109(12):4696–4701.
- Wild Ennerdale. 2006. Wild Ennerdale Stewardship Plan [Internet]. National Trust, Forestry Commission and United Utilities. [cited 2013 Mar 15]. Available from: http://www.wildennerdale.co.uk/stewardshipplan2006.html