
Abstract
Nowadays, pesticides are used pervasively in Asian rice production areas. Nonetheless, information is scarce regarding chemicals’ application and synergistic toxicity and longer-term impacts on paddy ecosystems. In Phranakhon Si Ayutthaya and Ang Tong (AT) provinces, 40 conventionally and 31 organically managed farms were visited. The farmers provided information on types and levels of pesticides used, and indices describing pesticide ‘toxic exposures’ were calculated. In the dry and wet seasons, the fields were surveyed for soil organic carbon (OC) and nitrogen (N) and rice densities and sizes. Using multivariate statistics, interrelationships among variables were investigated. Overall, 12 types of herbicides (all synthetic), 27 insecticides (13 natural), and 6 molluscicides (1 natural) were recorded. Pesticide exposures differed between provinces; organic farms used more natural products. OC was positively correlated with ‘toxic exposure’ levels, probably resulting from effects of pesticides on carbon-reducing processes. Additionally, molluscicides and herbicides explained OC levels. N varied spatially, probably resulting from flooding regimes; management influences were unnoticeable. In the dry season, rice growth was decreased on fields exposed to plentiful synthetic insecticides, whereas in the wet season, use of herbicides and molluscicides enhanced the growth. Further research is advisable to better establish long-term costs and benefits of different pesticide regimes in rice fields.
Introduction
In Thailand, rice-growing areas have expanded from 5.6 million hectares in the 1950s to over 9.2 million hectares today, and rice production has intensified twofold from around 1.5 to 3 tons per hectare (Phongpaichit & Baker Citation1995). Today, Thailand is among the top three exporters of rice worldwide (Bangkok Post Citation2012). Despite this expansion in productivity, the share of the agricultural sector in the Thai economy has been shrinking from around 40% in 1960 to less than 9% today, albeit 39% of Thais still work as farmers (Yamada Citation1998; Bank of Thailand Citation2013; World Bank Citation2013). These developments were largely possible through the introduction of new rice breeds and more intensified agricultural practices, including the increasingly widespread application of agrochemicals.
To combat pests of rice and other crops, almost 9000 tons of insecticides and 70,000 tons of herbicides have been imported annually in the past decade (Sapbamrer et al. Citation2011). Pesticides are generally considered highly effective and convenient – at least in regard to their immediate short-term effects on targeted pest species. In recent decades, the use of herbicides has been boosted in Central Thailand as a consequence of an increasing labor shortage on rice farms (incurring high costs for manual weeding) as well as new rice planting methods (i.e. rice broadcasting) (Moody 1993). In addition, several chemicals have been used increasingly as molluscicides to contain populations of the invading golden apple snail (Pomacea canaliculata (P. canaliculata), introduced to Thailand during the 1980s) (Tran & Perry Citation2003; Ranamukhaarachchi & Wickramasinghe Citation2006).
The limits and long-term risks of pesticide uses, however, become ever more evident. Manifold side effects of pesticides on and beyond the farmers’ fields are increasingly recognized by farmers as well as by society at large, and several policies and incentives have been suggested to reduce the use of synthetic chemicals (Thapinta & Hudak Citation2000; Panuwet et al. Citation2012; Praneetvatakul et al. Citation2013). Some of the most commonly used synthetic chemicals in rice fields (in particular, organophosphate and carbamate insecticides) are denoted as ‘highly’ to ‘extremely hazardous’ to farmers and the environment (WHO Citation2010). Farmers often use such pesticides carelessly and apply excessively high levels, resulting in significant health risks (Pingali et al. Citation1995; Buranatrevedh & Sweatsriskul Citation2005; Dwivedi et al. Citation2012; Raksanam et al. Citation2012; Tri Phung et al. Citation2012). Residues of pesticides are also increasingly found in agricultural products and freshwater sources (Thapinta & Hudak Citation2000; Panuwet et al. Citation2012). Furthermore, several chemicals pollute the waterways and affect inland and coastal wetland ecosystems (Poolpak et al. Citation2008; Varca Citation2012).
Most pesticides are nonspecific, affecting pests as well as potentially beneficial ‘nontarget’ species. Their application, particularly early in the growing season (as a ‘prophylactic’ measure), may result in killing off important predator species while selecting for pesticide-resistant strains of the pest species. Early or prolonged use of pesticides can thus lead to pest resistance and resurgence (Way & Heong Citation1994; Settle et al. Citation1996; Ruay-aree Citation2003). For example, renewed outbreaks of the brown planthopper (BPH, Nilaparvata lugens) during 2009–2010 are believed to have resulted from the overuse of insecticides (International Rice Research Institute Citation2010). Pesticides may also kill species that fulfill other ecosystem functions that are vital for agricultural production, such as the breakdown and decomposition of organic materials, the cycling of nutrients, and other processes in paddy soils and in the water column (Simpson & Roger Citation1995; Lawler Citation2001; Wilson et al. Citation2008).
The various important functions of aquatic rice field organisms are increasingly recognized by scientists and concerned farmers (Way & Heong Citation1994; Schoenly et al. Citation1998). It has been suggested that beneficial insects can largely control pests, especially if predator populations can build up early in the season (Settle et al. Citation1996; Wilson et al. Citation2008). Some farmers in Thailand have thus engaged in experimenting with alternative methods of pest management, including organic farming, ecologically based integrated pest management (IPM), and – in particular – the application of pesticides based on natural products (mostly insecticides and molluscicides, including repellents) (Greene Citation2008; Sematong et al. Citation2008; Kaufman Citation2012; Savary et al. Citation2012). Farmers themselves can produce many natural pesticides, and thus expenditures can be saved – provided the chemicals are sufficiently efficient (Ranamukhaarachchi & Wickramasinghe Citation2006; Kaufman Citation2012).
Many farmers in Thailand now organize themselves in ‘organic farmers’ groups to experiment with alternative methods, including the uses of naturally derived types of pesticides. Nonetheless, data are still inadequate regarding the types and levels of synthetic/natural pesticide chemicals used on different types of farms, the overall toxicity of the chemical ‘cocktail’ applied in the fields, and any resulting effects on the soils and rice productivity in the major rice production regions. In the present study, the patterns of pesticide uses and associated parameters of soil quality and rice growth were investigated on 71 farms in Central Thailand (Ang Tong (AT) and Phranakhon Si Ayutthaya (PNA) provinces). The selected farms ranged from (as designated) ‘ecologically’ managed farms (EF) with no or lesser uses of synthetic pesticides to conventional ‘intensively’ managed farms (IF) where high levels of synthetic chemicals were applied. The following questions were addressed:
What types and levels of synthetic and natural pesticides are applied on EF and IF farms? What is the cumulative toxicity (expressed in terms of toxicity to rats as a proxy for toxicity to humans) applied in the fields? What factors (farm type, site, farmer attributes) determine the pesticide application and regime?
To what degree and in what ways do rice growth and density vary according to pesticide applications and overall toxicity via direct or indirect effects (e.g. through pesticide effects on soil carbon)?
Methods
Description of the study sites and farm (F) variables
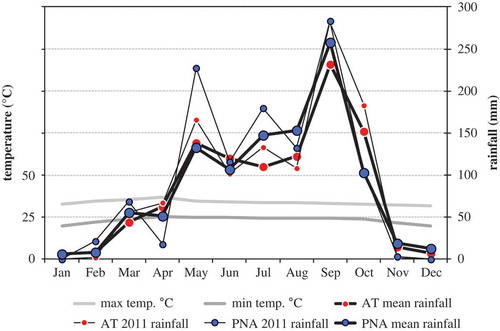
The study was conducted in the central plains north of Bangkok, i.e. in Mueang and Visechaichan districts in AT province (e.g. 14° 31′–34′ N, etc. 100° 23′–28′ E) and in Bang Sai district in PNA province (e.g. 14° 13′–16′ N, etc. 100° 23′–28′ E) (). This is an old rice production region of mostly sandy clay soils (OPNA Citation2011). Rice is grown during the wet (June to August) and dry seasons (January to March) (temperature and rainfall data shown in ; TMD Citation2012). Intensive cultivation practices nowadays – in a majority of cases – heavily rely on the uses of agrochemicals, especially synthetic pesticides for pest control (referred to as IF, i.e. ‘intensively managed’ farms) (OAE Citation2008). Typically, high-yield rice varieties (with resistances to herbicides) are grown. Inputs of mostly inorganic fertilizers (especially nitrogen) also tend to be high. Some farmers, however, are now experimenting with ecologically based methods (referred to as EF, i.e. ‘ecologically managed’ farms). Those farmers may not use synthetic pesticides or may use them only in cases of severe pest outbreaks. Many of these farmers have organized themselves in ‘local expert learning centers’ whereby concepts of organic farming and the application of natural pesticides are taught in ‘farmer field schools.’
Figure 1. Map of Central Thailand showing the location of the two study sites in Bang Sai district, Phranakhon Si Ayutthaya (PNA) province, and in Muang Ang Tong district, Ang Tong (AT) province.
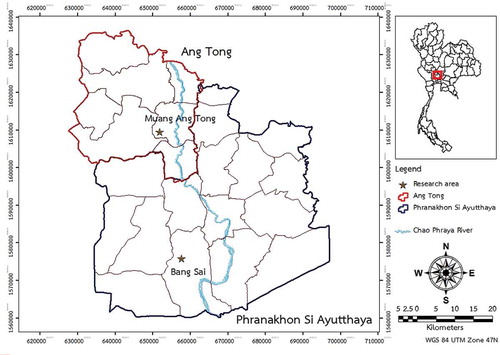
Figure 2. Average monthly temperature (daily maximum and minimum) for Phranakhon Si Ayutthaya (PNA), and average monthly rainfall for the years 2001–2011 (mean) and for 2011 for Ang Tong (AT) and Ayutthaya provinces.
During 2010 and 2011, 20 IF and 20 EF were visited in AT and 20 IF and 11 EF in PNA, and the farms were selected randomly from addresses available from regional workshops of learning centers (EF denoted whether the farmers were engaged at learning centers and stated that they applied ecological/organic principles in their farms). The farms were located at a distance of 1–12 km west from Chao Phraya River (). PNA is more industrialized, and farmers are on average richer (37,000 baht monthly income per household in 2008) than in AT (25,500 baht; US$1 was 35 baht) (OPNA Citation2011). Farmers in PNA also have generally better access to water resources throughout the year (13 irrigation projects covering 2184 km2, Noi River crossing through site) than the farmers in AT (5 irrigation projects covering 882 km2) (ATACO Citation2001; Ayutthaya Irrigation Citation2012).
Geographic farm (F) variables which were used as predictors in statistical models (cf. later sections) included the study sites (AT or PNA; variable F1) as well as the farms’ geographic location that was recorded during visits as UTM latitude (F2a) and longitude (F2b) coordinates using a GPS receiver (Garmin 12XL, Garmin International Inc., Kansas City, MO, USA). Temporal variables included the two seasons during which the rice fields of different farms were surveyed (wet or dry season, F3a; cf. later section) and the number of days (recorded by farmers or estimated from regional comparisons) since rice planting (F3b). In addition, the farm types (EF or IF) served as predictors (F4).
Collection of data describing farmers’ profiles and land possessions (R and L variables)
The owners of each of the 71 farms were interviewed in December 2010 and January 2011 using structured questionnaires. Data were gathered about the farmers’ profiles (R variables; i.e. age of respondents R1, marital status R2, education R3, family size R4, and number of people working on the farm R5) and land possessions (L variables; i.e. owned and rented land area under cropping L1, land area owned as a percentage of all lands under cropping L2, and land area per crop L3).
Determination of variables (C) describing pesticide uses and ‘pesticide toxic exposures’
The farmers had to list which types of synthetic and/or natural pesticides they were applying and for what purposes (i.e. as insecticides, molluscicides, or herbicides; variable C1a). For each pesticide, they indicated the concentration (in cc/ha or kg/ha, depending on the type), which they usually use per pesticide application (C1b), the frequency of application per crop (C1c), and the number of years for which the chemical had been used (C1d). In addition, the farmers provided information on whether the chemical was used before pest detection (prophylactic/proactive treatment), upon pest species detection, or after pest outbreak (symptomatic/reactive treatment) (C1e-g).
Using these data, two indices were calculated for each pesticide:
‘seasonal input’ index (cc/ha) = mean concentration (cc/ha) × seasonal application frequency
‘cumulative input’ index (cc/ha) = ‘seasonal input’ index (cc/ha) × number of years in use
Data on chemicals used on at least 20 farms (i.e. chlorpyrifos + cypermethrin mixture, abamectin, butachlor, and tea seed powder) were used as potential predictor variables in statistical analyses in four different forms, i.e. pesticide type applied or not on farms (binary variable, C1a), mean application concentration per use (cc/ha, C1b), ‘seasonal input’ index (cc/ha, C1VA), and ‘cumulative input’ index (cc/ha, C1VC).
In addition, indices were calculated to describe the overall ‘toxic inputs’ of all synthetic and/or natural pesticides used on a farm. The overall toxicity of pesticides was approximated by using information on LD50 rat toxicity, i.e. for each type of pesticide the lethal dose in milligrams (concentrated) needed to kill 1 kg weight unit of rat at a likelihood of 0.5 (dose fed to rats orally) (see Table A1 of Appendix A; sources: Extoxnet Citation2012; Farm Chemicals International Citation2012; INCHEM Citation2012; PANNA Citation2012). In the case of natural pesticides for which no figures were available, LD50 rat toxicity was set at 10,000 mg/kg (i.e. slightly higher than the highest figures for ‘mild’ synthetic pesticides). For each pesticide type used on a farm, a ‘seasonal’ (stv) and a ‘cumulative toxicity volume’ (ctv) was calculated by weighing the ‘seasonal’ and ‘cumulative’ input indices (cc/ha), respectively, by the corresponding LD50 rat toxicity. The two combined indices were then:
index of ‘seasonal toxic input’ (C3) = sum of stv of all types of a pesticide group used per farm
index of ‘cumulative toxic input’ (C4) = sum of ctv of all types of pesticide group used per farm
Such indices were calculated for all pesticides (C3tot, C4tot), and for the subcategories natural (C3In, C4In) and synthetic (C3Is, C4Is) insecticides; natural (i.e. tea seed powder; C3Mn, C4Mn), synthetic (C3Ms, C4Ms), and overall (C3M, C4M) molluscicides; and herbicides (C3Hs, C4Hs).
Since rats weigh on average about 0.5 kg, the indices may be interpreted to designate the maximum number of thousands of rats, which – in theory – could have been fatally poisoned if the respective volumes of all pesticides would have been fed orally to rats. The indices may represent a realistic proxy for the toxicity to animal species, including human beings (Janardan et al. Citation1984), but may be less useful to describe toxicity to other organisms, e.g. micro-organisms and plants. For this reason, the most commonly used chemicals (C1) and indices for all subcategories (C3 and C4) were all included as potential predictors in statistical testing in this and the accompanying study (Cochard et al. Forthcoming Citation2014). In addition to the indices (interval variables), the ordinal variables – ‘number of pesticide types used’ (C2) – were also included in the analyses for all pesticides (C2tot) and the respective subcategories (C2In, C2Is, C2Mn, C2Ms, C2M, C2Hs; cf. above). Detailed listings of chemicals used on the farms are provided in Tables A1 and A2 in Appendix A, and descriptions of all the variables used for statistical analyses are provided in Tables B1 and B2 in Appendix B.
Collection of data describing biophysical parameters in the rice fields (P variables)
A first field survey was conducted in the ‘dry’ winter growing season during 20–29 January 2011 (35–45 days after the start of growing season; rice is harvested after ~110 days), and 10 IF and 10 EF were surveyed at each of the two study sites (i.e. 40 farms in total). A second survey was conducted in the ‘wet’ summer growing season during 24–30 June 2011 (40–50 days into the growing season), and all 71 farms were surveyed.
The fields were described according to biophysical aspects (P variables). Using a 50-m tape, the distance from the field boundary (earthen dam) to the nearest irrigation canal (with permanent water) was measured (variable P1). The water depth was measured (during both surveys) at five random spots in the field, and a mean depth calculated (P2). During the second survey, five randomly placed samples of soils were extracted to a depth of 30 cm, and the samples were combined for each farm. Soil pH (P3) was measured in the field using a test kit (mixed indicator). The 71 soil samples were dried for 24 h in an oven (temperature 100°C) at the Asian Institute of Technology (AIT). The samples were then analyzed for organic carbon (P4) (Walkley–Black method; Schulte and Hoskins Citation2009) and for total nitrogen content (P5) (Kjeldahl method; Ryan et al. Citation2001). Rice height was measured (during both surveys) to the tip of the longest panicle at 20 random locations in the field, and the mean was calculated (P6). Rice plant stems were counted within a 1-m2 frame, five times replicated, and the mean density was calculated (P7).
Statistical data analysis
A framework for analysis of overall variable interactions for this and the accompanying study (Cochard et al. Forthcoming Citation2014) is shown in Figure C1 in Appendix C. Corresponding results based on multivariate analyses are shown in , , and . Minitab 15 statistical software (Minitab Inc., State College, PA, USA) was used to summarize the data variables (i.e. frequencies, mean, standard deviation, etc.), and perform statistical analyses. Before analyses, the data distributions were checked, and if needed appropriate transformations (e.g. logarithm, square root, or normal score functions) were applied. Multivariate linear regression (MLR), general linear models (GLM), and binary logistic regression (BLR) or ordinal logistic regression (OLR) models were used as appropriate, with respect to the various sets of (interval/categorical) data tested. To determine the main factors (predictor variables) influencing or correlating with a tested dependent variable of interval data type (i.e. MLR and GLM models), step-wise variable selection using best subsets regression (BSR) analyses were performed (as model selection criterion Mallow’s Cp measure was used; for descriptions of statistics and methodology see Chatterjee & Hadi Citation1988; Chatterjee et al. Citation2000, Minitab Inc.). In the case where the dependent variable was of categorical data type, we applied systematic testing of models (BLR or OLR). Tools for detecting outlier and leverage points (DFFITS and Cook’s distance) were used, and in some cases, points were deleted to improve the models. Once the optimal models were determined, statistically significant associations of predictors with dependent variables were illustrated, as given by the arrows in , , and , with the arrow thickness denoting the p-value (closely commensurate with other model statistics indicating ‘effect size’, cf. Note C1 in Appendix C). All variables are described in Appendix B (Tables B1–B3), and summaries of descriptive statistics as well as model statistics from multivariate analyses (including listing of significant predictors) are provided in Appendix D (Tables D1–D4).
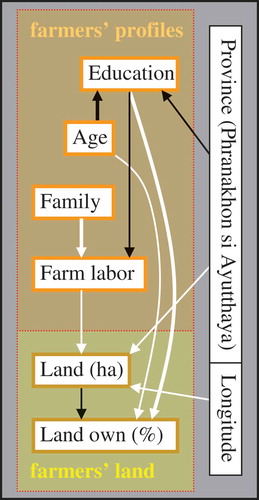
Figure 3. Data variation of respondent and land possession variables as explained by independent predictors (farm variables). The arrows indicate the predictor variables (at the start of the arrows) that were significant in the models to explain the dependent variables (at the end of the arrows). The arrows may or may not imply causality. White arrows represent positive and black arrows represent negative correlations (in multivariate models). The thickness of the arrows indicates the significance level of the correlation from the thickest (p < .0005), medium (p < .005), to the thinnest (p < .05). ‘Farm type’ and ‘province’ refer to ‘organic, extensively managed farms’ (EF) and ‘Ayutthaya province’ (PNA), respectively.
Results
Respondents’ profiles and ownership of cultivated lands
The ages of the interviewed farmers ranged from 30 to 79 years (average 55 years). Most (82%) only had a primary school education, whereas a few – mostly the younger farmer () – had a higher education, i.e. secondary school (8%), high school (4%), or higher levels (6%). Nearly all farmers were married (96%). Their families ranged from 1 to 10 members (average 4.5, including respondents), but on average only 40% of family members (1.7 persons) were working full-time on the farms, whereas the others had different occupations. The ratio of family members working as farmers was slightly lower on farms led by respondents with a higher education ().
The interviewed farmers cultivated about 6 ha of land on average (range 1.5–26 ha), whereby typically 1.6 ha belonged to them (0–7 ha) and 4.3 ha was rented land (0–23 ha). Most of the land was used for irrigated rice crops, and smaller plots were used for housing, orchards, and fish ponds. Older and better educated farmers tended to possess more land. Furthermore, land ownership was higher in AT (1.9 ± 0.3 ha) as compared to PNA (1.1 ± 0.3 ha) ().
Pesticide types used by the farmers
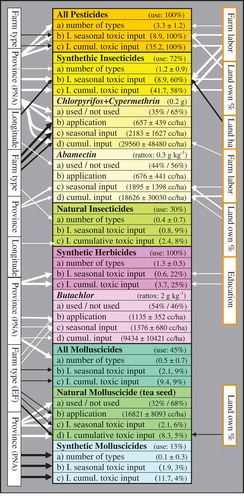
In total 15 different types of synthetic insecticides were recorded for the 40 IF (Tables A1 and A2, Appendix A). These included three chemicals classified by WHO (Citation2010) as ‘highly hazardous’ (i.e. omethoate with 5% users, dichlorvos with 8% users, and carbofuran with 5% users) and eight classified as ‘moderately hazardous’ (i.e. chlorpyrifos 43%, abamectin 43%, cypermethrin 38%, cartap hydrochloride 11%, isoprocarb 8%, fenobucarb 5%, profenofos 3%, and carbosulfan 3%). Only six types were recorded on the 31 EF. These did not include ‘highly hazardous’ chemicals, but similar levels were used for chlorpyrifos + cypermethrin (only used as a mixture, 39%), abamectin (45%), and cartap hydrochloride (6%). The natural insecticide Beauveria bassiana (fungal spores infective to insects) was only used on EF (23%), mostly in AT. In addition, 10 naturally produced types of noncommercial insecticides or repellents (often applied in combination) were recorded from EF and 5 from IF. These included components of plant saps (e.g. neem, chili, and turmeric) and fermenting organic residues (e.g. coconut milk and squashed apple snails). In PNA, tea seed powder (a saponin-based biopesticide) was the only molluscicide used on both IF (65%) and EF (91%). None of the farms in AT used tea seed powder, but 40% of IF used synthetic chemicals (five types in total) as molluscicides, including the ‘highly toxic’ and now prohibited organochlorine endosulfan (25%) and the mildly toxic niclosamide (5%). No natural herbicides were in use, but synthetic herbicides were applied on IF and EF. The ‘slightly hazardous’ butachlor was the most commonly used herbicide, applied in pure form on IF (53%) and EF (55%). Several IF used butachlor also in combination with propanil (13%) or safener (18%), whereas few EF used these additive products (0% and 3%, respectively). The mixture clomazone + propanil was used only by farmers in PNA (52%). In addition, another eight different types of herbicides were recorded (seven in AT and one in PNA) on IF and EF (1–8% users overall).
Application of pesticides
As stated by the farmers, the synthetic insecticides were mostly applied upon detection of insect pest species (79%) or when the farmers perceived that pest populations were starting to pose a threat to the crops (pest outbreaks, 20%). Only rarely (1%) were synthetic insecticides used in a prophylactic way. Prophylactic usage was slightly more common (11%) in the case of natural insecticides, whereas – equally – most farmers used it upon pest detection (81%) or outbreak (8%). In the case of molluscicides (synthetic and natural), the levels were 3%, 67%, and 30% for usage as a prophylactic, upon detection, and outbreak, respectively. Herbicides, in contrast, were mostly applied before the rice crops were transplanted (69%) and less frequently as a means to suppress weed growth after transplanting (17%) or upon the emergence of a weed invasion problem (14%).
Most synthetic insecticides were, on average, used three times per cropping season, whereas application rates of natural insecticides tended to be higher (approximately two to six times per crop). Molluscicides were only applied once per season. Equally, herbicides were typically applied once per season, but in a few cases twice. The most common synthetic pesticides were in use for several years, i.e. on average 9.7 years in the case of chlorpyrifos + cypermethrin, 7.4 years for abamectin, and 6.8 years for butachlor. Natural insecticides were typically in use for a shorter time period (2–6 years), and tea seed cake was applied on average since 5.4 years. There were no apparent differences between IF and EF with regard to application timing/strategy.
Patterns of pesticide uses and estimated toxic impact on the farmers’ rice fields
In AT, in general, fewer types of synthetic insecticides, herbicides and molluscicides, but more natural insecticides, were used on EF as compared to IF. In contrast, in PNA, a similar number of synthetic and natural types were used on EF and IF. Some farmers did not use insecticides (4%) or molluscicides (55%), but all the farmers used at least one type of herbicide ().
Table 1. The average number (± standard deviation) of different synthetic and natural pesticides used in the two provinces on intensive (IF) and ecologically oriented (EF) farms.
Statistical examination of the overall ‘indices of toxic input’ (as described from toxicity to rats) revealed that field exposures to toxic chemicals differed greatly among individual farms and also between the two study sites and farm types. The data followed approximately lognormal distributions ( and ), where the levels of ‘toxic input’ were – overall – around four to six times higher in PNA (medians: 12.4 and 58.9 for ‘seasonal’ and ‘cumulative’ input levels, respectively) as compared to AT (3.0 and 9.2). Many EF in PNA used more toxic substances than most of the IF in AT ( and ). Synthetic insecticides were generally the most hazardous substances used, contributing on average about 58–60% of the ‘total toxic input’ on all the 71 fields (). Hence, indices of ‘toxic input’ of synthetic insecticides were closely correlated to indices of total toxicity (). In contrast, herbicides contributed about 22–25% of the ‘total toxic input’ in the fields, while molluscicides and natural insecticides each contributed 9% ().
Figure 4. Cumulative density function (CDF, including a lognormal fit) of the ‘index of seasonal toxic input’ on the farmers’ fields of the two provinces (Ayutthaya and Ang Tong) and farm types (organic and intensive). The index may be interpreted as a maximum number of rats (in thousands) that could in theory be killed if the total volume of all pesticides spread seasonally on a hectare of rice field were instead to be fed to rats orally. The three parameters for each of the four lognormal distribution models are shown in the inset table.
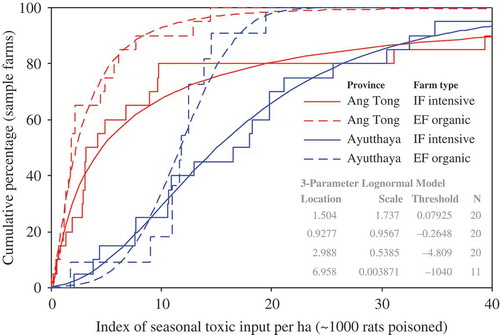
Figure 5. Cumulative density function (CDF, including a lognormal fit) of the ‘index of cumulative toxic input’ on the farmers’ fields of the two provinces (Ayutthaya and Ang Tong) and farm types (organic and intensive). The index may be interpreted as an approximate maximum number of rats (in thousands) that could in theory be killed if the total volume of all pesticides spread in cumulative total (i.e. since the introduction of the respective pesticides) on a hectare of rice field were instead to be fed to rats orally. The three parameters for each of the four lognormal distribution models are shown in the inset table.
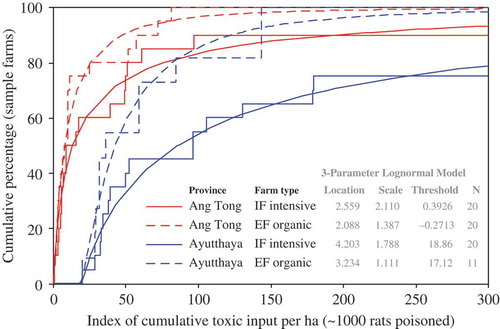
Figure 6. Data variation of various pesticide variables (uses, application levels, and indices of toxic input) as explained by independent predictors (farm, respondent, and land possession variables). Refer to legend of for an explanation of the arrows. For the major pesticide groups (overall, and synthetic/natural insecticides, herbicides, and molluscicides), the percentage of users is indicated (in brackets) as well as the summary statistics on the ‘number of pesticide types’ (average ± standard deviation) and indices of toxic input (the median index (excluding ‘0’) and the percentage contribution of the overall toxic input of the respective group in relation to the total toxic input of all pesticides in the fields) is indicated. For the four most commonly used synthetic pesticide types (i.e. chlorpyrifos + cypermethrin, abamectin, butachlor, clomazone + propanil), the toxicity is indicated (the 50% lethal dose (LD50) in grams needed to kill 1 kg of rats), as well as the averages (± standard deviations; excluding ‘0’) of the doses (in cc/ha) used per application, per season, and for the entire period since the chemical was introduced (cumulative input) are indicated. The average (± standard deviation) of the dose used per application is also indicated for tea seed powder (I. = index; cumul. = cumulative).
The levels of ‘toxic input’ (especially from synthetic pesticides, e.g. chlorpyrifos + cypermethrin, but not herbicides, e.g. butachlor) tended to be higher on IF, whereas generally higher levels of natural insecticides (but not natural molluscicides) were used on EF ( and ). The main differences were, however, between the study sites, with overall pesticide uses being considerably higher in more industrialized PNA as compared to rural AT. In addition, more highly toxic pesticides (in particular synthetic insecticides) were applied if farms disposed of more labor forces to work in the fields and if the fields were privately owned (and mostly smaller) (). Higher amounts of herbicides were also used by better-educated farmers who generally disposed of fewer farm labors and lesser time to weed the fields mechanically ( and ).
Rice field soil parameters as influenced by pesticides
The results indicated that pesticide uses had various nontrivial effects on the soils as well as rice growth on the farmers’ fields (–). A strong positive correlation was found between soil organic carbon (OC) and the overall ‘index of seasonal toxic input’ (). Additionally, soil OC was (to a lesser degree) positively correlated with uses of chlorpyrifos + cypermethrin and natural molluscicides (tea seed powder), but negatively correlated with the ‘seasonal toxic input’ levels of herbicides ( and ). Soil OC and N levels generally tended to be higher at farms in PNA as compared to AT (). Soil nitrogen (N) content was directly positively correlated with soil OC, but (controlled for this correlation) it only tended to decrease along a longitudinal gradient; there were no apparent influences of field management (as could be indicated by farm types and/or pesticide uses). Soil pH (mainly correlating negatively with OC) was increased on fields where many synthetic insecticide products were used but lowered on fields where molluscicides were in use ( and ).
Figure 7. Principal component analysis loading plot illustrating the multivariate correlations of different selected pesticide, soil and rice growth variables, also including the factors ‘province’ and ‘farm type’ and the field variables ‘water depth’ and ‘distance to irrigation canals’. The pesticide variables refer to ‘seasonal toxic input’ (crop) or ‘cumulative toxic input’ (cumul.). Rice density and growth are shown during the wet (WS) and dry (DS) seasons (DS is based on 40 true data points and 31 ‘dummy’ data points, i.e. averages). The interval data were all transformed to a normal distribution. The PCA eigenvalues of the first and second components were 7.45 and 3.01, respectively. (syn. = synthetic; nat. = natural; cumul. = cumulative; cyperm. = cypermethrin; DS = dry season; WS = wet season; OC = organic carbon content; N = nitrogen content).
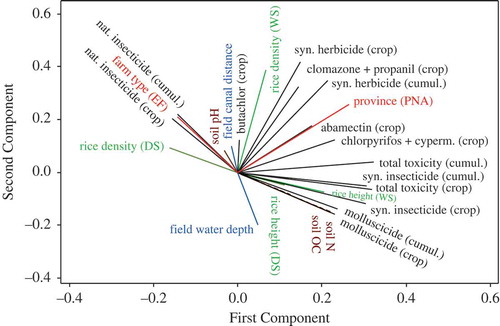
Figure 8. Scatterplot showing the increase in soil organic matter content as a function of the ‘index of seasonal toxic input’ of all the pesticides. The equation and statistics of the simple regression model are also provided.
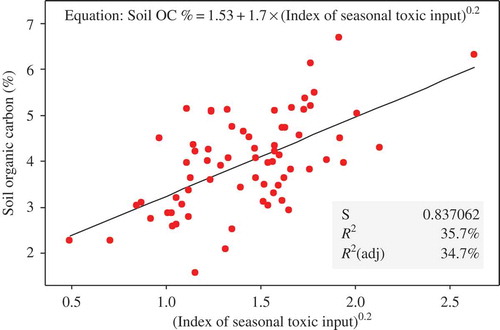
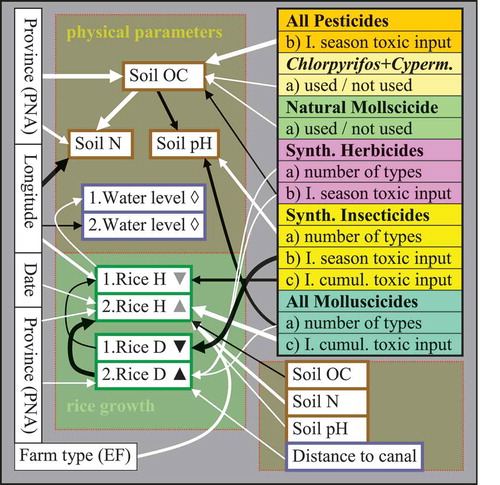
Figure 9. Data variation of biophysical field variables – water levels, soil organic matter and nitrogen contents, soil pH levels, and rice plant sizes H (height in cm) and densities D (plant counts per m2) – as explained by independent predictors (farm and pesticide variables). Refer to legend of for an explanation of the arrows. The numbers indicate whether the tested variables are from the first (1) or from the second (2) survey. Inserted triangles indicate a significant change of the variables from the first to the second survey (as determined from paired t-tests or Mann–Whitney tests), where ▲ indicates significantly higher and ▼ indicates lower levels at the respective sampling time; ◊ indicates no significant change. The significance levels of the changes are indicated by the darkness of the triangles, from ▲ (p < .0005), ▲ (p < .005), to ▲ (p < .05). (I. = index; cumul. = cumulative; H = height; D = density; OC = organic carbon content; N = nitrogen content; Cyperm. = cypermethrin).
Dry and wet season rice growth on paddy fields exposed to different levels of pesticides
Rice plant sizes and densities were generally higher during the wet season as compared to the dry season; in addition, there were major differences in growth patterns between the two surveys. During the dry season, there was a significant negative correlation between rice density and (seasonal) synthetic insecticide exposure in the fields. Equally, the sizes of rice plants were markedly decreased on fields with high (long-term, cumulative) uses of synthetic insecticides, while also being lower on fields situated toward the west and on densely planted fields (). In contrast, during the wet season, rice densities tended to be higher on fields where high amounts (and more than one type) of herbicides were used, where molluscicides were used, which were located more distant from irrigation canals (). Rice growth was most prolific on fields that were not densely growing and where the soils were rich in N but contained comparatively lesser OC concentrations and a higher pH (considering the correlations between N, OC, and pH). Furthermore, the rice plants tended to grow higher on fields treated with molluscicides and on organically managed fields (notably, controlling for the other predictors) ( and ).
Discussion
Patterns and causes of synthetic and natural pesticide uses by rice farmers in Central Thailand
The respondents’ profiles reflect the recent economic transitions in Thailand where the (hitherto highly developed) agricultural sector has now become less important relative to the industrial and service sectors. Many of the interviewed farmers were relatively old, which reflects the trend that farmers’ children are increasingly finding work in other, better-paid industries in the central regions. For those who remain – mostly the older and those with a lower education – farming is often the only option to make a living. In PNA, where many industrial plants have sprung up during recent years, high land prices also partly explain the lower levels of land ownership (Raksanam et al. Citation2012). The high costs of labor and land entice many farmers to use high amounts of agrochemicals to achieve maximum short-term profits.
Pesticide uses were influenced by the farmers’ perceptions about what was effective. According to the farmers’ information, abamectin was mainly used on farms with regular problems from rice leaf folders and thrips, whereas the chlorpyrifos + cypermethrin mixture was mainly used against other pests such as rice stem borers. Many EF farmers were, however, reluctant to use chemicals that they believed to have negative side effects (e.g. on beneficial insects). The perceptions and preferences were often influenced by product promotion of companies or recommendations by government agencies, extension workers, and local leaders. This partly explains the different use of molluscicide products between the two study sites. Farmers in PNA followed the recommendations of a local farmer leader to use tea seed powder, whereas farmers in AT either relied upon natural controls (e.g. open-billed storks were said to contain golden apple snail populations) or used synthetic chemicals as recommended by extension workers. The excessive use of chlorpyrifos + cypermethrin was held responsible for the resurgence of pesticide-resistant populations of BPH, and therefore its use was discouraged by the Department of Rice. Partly for this reason, many EF farmers in AT now used B. bassiana and other natural products. Most of the pesticides were applied only upon the presence of potential pest species and normally at rates recommended by the producer; nonetheless, as noted by Heong et al. (Citation1995), synthetic pesticide uses may still be excessive, ill-timed in their application, and unsustainable in the longer term.
In Central Thailand, farmers experimenting with ecological and organic rice production methods are still an exception (Sribarikij Citation2011), and as is indicated by the data, the category ‘EF’ did not necessarily imply lower pesticide uses as compared to ‘conventional’ IF. This may actually explain why the factor ‘farm type’ hardly ever turned out to be a main predictor explaining patterns of aquatic biodiversity in the rice fields; in contrast, significant regional differences existed in both biodiversity and pesticide uses (cf. Cochard et al. Forthcoming Citation2014). Overall, pesticide uses were considerably higher in PNA as compared to AT, and EF farmers in PNA (of which there were only a few) still used a considerable amount of synthetic chemicals to remain sufficiently competitive within this more industrialized and fast developing region. Many farmers (especially IF farmers) apparently saw the application of highly toxic pesticides (mostly synthetic insecticides) as a ‘healthful’ treatment for their fields and rice crops. This seems supported by the observation that more highly toxic pesticides were applied if farms disposed of more labor forces and if the fields were privately owned (and mostly smaller). It is in line with observations by Panuwet et al. (Citation2012) who noted that many farmers in Thailand were little concerned about pesticides’ health hazards and potentially detrimental effects on rice field ecosystems.
Effects of pesticide uses on soil parameters
The conspicuous positive correlation between OC and the ‘index of seasonal toxic input’ suggests that copious uses of highly toxic pesticides negatively affect organisms that are important for the reduction of organic carbon. Several studies (Reddy et al. Citation1984; Katayama & Kuwatsuka Citation1991; Katayama et al. Citation1992; Kumuraswamy et al. 1998; Bharati et al. Citation1999; Chu et al. Citation2008; Kreuzweiser et al. 2011; Schellenberger et al. Citation2012) have reported decreased rates of organic decomposition and reduction following the application of various pesticides (in particular strong insecticides such as chlorpyrifos), especially under flooded wetland conditions. Soil bioactivity was also diminished as pesticides have affected rice field worms (oligochaetes) (Simpson et al. 1993; Roger Citation1995). Hence, organic carbon could accumulate more strongly in the soils of fields under high toxic exposures. A lowered soil bioactivity is also indicated by increased pH levels on fields where many synthetic insecticide products were used, since increased levels of humic acids and carbon dioxide (as products of organic decomposition) lower the soil pH (Calver et al. Citation2009).
Herbicides kill off native weeds, and therefore, overall biomass production may be diminished in fields treated with high herbicide levels, explaining the negative effect on soil OC concentrations. Furthermore, various studies (Baruah & Mishra Citation1986; Raut et al. Citation1997; Min et al. Citation2001; Usui and Kasubuchi Citation2011) have reported heightened soil microbial activity under the application of herbicides, including butachlor. In contrast, molluscicides target the most potent herbivores in rice fields – snails, especially P. canaliculata – and hence, this could explain their additive effect. Furthermore, tea seed cake is an organic product, possibly adding to OC in the soils. Oils from tea seed also contain organic acids, and hence its application tends to lower the pH on flooded fields (Botao & Shirong Citation1992), as was observed in our study. Unlike molluscicides, uses of (highly toxic) synthetic insecticides did not appear to increase soil OC via improved plant growth, since rice densities and heights were generally decreased on fields exposed to high levels of such synthetics (cf. the following section).
Incorporation of high levels of organic fertilizers could likewise explain increased levels of soil OC in the fields. However, organic forms of fertilizers are more commonly used on EF, which also use lower levels of pesticides (Od-ompanich et al. Citation2007). Moreover, if soil OC were derived from organic fertilizers (e.g. manure), elevated levels of nitrogen (N) should be expected in the soils (Srisai et al. Citation2003). No such effects were, however, indicated by the data. Soil N content was directly positively correlated with soil OC, but farm management type had no directly observable effects on soil N. Furthermore, soil N levels tended to increase with distance away from the Chao Phraya River (as indicated by the longitudinal gradient and higher levels at the more distant PNA site). Hence, flooding regimes on the floodplains rather than fertilizer inputs appear to explain N levels in the soils (Baldwin & Mitchell Citation2000; Chowdary et al. Citation2004). Furthermore, blue-green algae (major N fixers) were also found in higher concentrations toward the west, possibly partly explaining higher soil N (cf. Cochard et al. Forthcoming Citation2014). Nitrogen fertilizers applied on rice fields in nonorganic soluble forms are typically lost to high degrees in the floodwaters, and their application is not necessarily traceable in soil samples (Ghosh & Bhat Citation1998; Spencer et al. Citation2006).
Dry and wet season rice growth on paddy fields exposed to different levels of pesticides
The differences in rice plant sizes between the two surveys were perhaps partly due to a difference in the timing of the surveys relative to the start of the growing season (~4–7 days later during the wet season survey). However, the results also provided strong indications that rice establishment and growth was affected in different ways by pesticide uses in the dry season as compared to the wet season. The different patterns relating to effects (indirect and direct) of pesticide uses may ultimately largely be explained by seasonal climatic differences. During the wet season survey, much higher amounts of rainfall were measured (116 mm in PNA and 102 mm in AT in June 2011; ) than during the dry season (1.4 mm in PNA in January 2011; TMD, Citation2012). Hence, during the dry season, the water mostly came from irrigation canals (sinks of chemical waste residues). Moreover, even if the average water levels in the fields did not differ between surveys (), overall water evaporation was likely to be higher in the dry season. Hence, the waters were probably highly concentrated with pollutants (pesticide residues, nutrients, etc.), whereas during the wet season, waters (mostly from rainfalls) were comparatively clean (Tejada et al. Citation1993; Watanabe & Takagi Citation2000; Zheng et al. 2003; Iwai et al. Citation2007). Increased concentrations of synthetic insecticides possibly reduced soil bioprocesses essential for plant nutrition and growth, explaining diminished rice establishment and growth (). In contrast, rice growth was apparently unaffected on fields where natural insecticides were used (showing positive correlations if the variables for synthetic insecticides were deleted from statistical models; Table D4, Appendix D). During the wet season, the effects of pesticides were, however, different. The results indicate that herbicides diminished competition from native weeds, and (long-term) application of molluscicides presumably protected the crops from snails (while possibly also stimulating rice growth; cf. Andresen & Cedergreen Citation2010). Golden apple snails were much more abundant in the fields during the wet season (often canals were overflooding), and this may also partly explain the increasing rice densities with greater distance to irrigation canals. While N increased the growth of rice, the results indicate that the accumulation of soil OC (probably as a result of high pesticide applications, cf. previous section) may also have negative impacts on rice productivity in the longer term, especially since it may lower the pH (Chandresekaran & Yoshida 1972).
Conclusions
Developments in Central Thailand reflect the trends in many rice-producing countries. Rice is a staple crop produced to nourish the growing world population. A market for ecologically grown rice is as yet very limited. Nonetheless, at some stage, intensification in rice production may reach certain natural and economic limits as well as risks. Pesticides wipe out nontarget organisms and thus degrade some of the essential ecosystem services they support, such as the turnover of carbon and nutrients on rice field soils. The observed accumulation of OC in paddy soils may lower the soil pH and oxygen to levels so as to affect rice growth (Chandresekaran & Yoshida 1972), and in our study, rice growth in January 2011 was indeed lower on fields exposed to high levels of synthetic insecticides. To reach faithful evaluations of the overall economic costs and benefits of current pesticide regimes, further investigations are recommendable specifically on the long-term effects of pesticides (particularly strong insecticides) on rice soil biota and associated hydro-edaphic processes. Studies setting a focus on comparatively immotile soil invertebrates (especially ecologically important groups such as annelids and nematodes) will likely provide better insights regarding the effects of pesticides on actual long-term rice productivity and possibly also on greenhouse gas production from rice fields (e.g. methane produced under anoxic conditions).
When deciding on pesticide strategies in rice production, Thai farmers and the society at large have to square up the short-term profits with any costs that may arise in the longer term. If government agencies take account of the effective external costs caused by pesticides, then their uses may be further regulated via policies at national level. Steps are already taken to strengthen low-pesticide user groups through participatory research and training on more eco-friendly field management practices. Increasing emigration of farm labors to other industries, however, sets certain limits to efficient ecological farming. For example, all the farmers in our study still used synthetic herbicides. For this reason, government agencies should promote specific pesticide-free reference sites to which conventionally managed fields can be compared, so that any (rather complex) long-term impacts of pesticide uses can be suitably assessed and evaluated (cf. Cochard et al. Forthcoming Citation2014).
Supplemental material
Supplemental appendices relating to this article are available online at http://dx.doi.org/10.1080/21513732.2014.905493, including Tables A1–A6, B1–B3, D1–D8 and Figure C1.
TBSM Supplemental material. Tables A1-A6 B1-B6 D1-D8 and Figure C1 1
Download MS Word (215.9 KB)Notes and acknowledgements
Data collection, including laboratory analyses of soil samples, was done by S. Maneepitak. Data management, analyses, and the write-up of the manuscript was done by the two authors collaboratively. The authors gratefully acknowledge the assistance of various persons. Ms. Sumana Maneepitak provided valuable help during data collection. Mr. Sawat Attainthee and Mr. Jamrus Rotjarean provided logistical support during the field surveys. Ms. Sirinthip Pholmas (Aquaculture and Aquatic Research Management, AIT) helped with the lab analysis. Dr. Prabhat Kumar, Dr. Damien Jourdain, and Dr. Ganesh Shivakoti (all at AIT) provided useful comments during study preparation and on the manuscript. Funding for this research was provided by the Asian Institute of Technology (AIT).
Related Research Data
References
- Andresen M, Cedergreen N. 2010. Plant growth is stimulated by tea-seed extract: a new natural growth regulator?. Hort Sci. 12:1848–1853.
- ATACO. 2001. General information on agriculture in Ang Thong [Internet]. Ang Tong: Agriculture and Cooperatives Office; [cited 2013 Apr 19]. [in Thai language]. Available from: http://www.angthong.go.th/moac/page3/fast1/da4/db22.html
- Ayutthaya Irrigation. 2012. Information on Ayutthaya irrigation project. Ayutthaya: Office of Irrigation Ayutthaya. [in Thai language]. Available from: http://province.rid.go.th/ayutthaya/data.html
- Baldwin DS, Mitchell AM. 2000. The effects of drying and re-flooding on the sediment and soil nutrient dynamics of lowland river–floodplain systems: a synthesis. Regulated Rivers Res Manag. 16:457–467. doi:10.1002/1099-1646(200009/10)16:5<457::AID-RRR597>3.0.CO;2-B
- Bank of Thailand. 2013. Thailand at a glance [Internet]. Bangkok: Bank of Thailand; [cited 2013 Mar 20]. Available from: http://www.bot.or.th/English/EconomicConditions/Thai/genecon/Pages/Thailand_Glance.aspx
- Bangkok Post. 2012. Rice exports: fall from 1st to 3rd [Internet]. Bangkok Post; [cited Feb 2013]. Available from: http://www.bangkokpost.com/learning/learning-from-news/318215/rice-exports-falls-from-1st-to-3rd
- Baruah M, Mishra RR. 1986. Effect of herbicides butachlor, 2, 4-D and oxyfluorfen on enzyme activities and CO2 evolution in submerged paddy field soil. Plant Soil. 96:287–291. doi:10.1007/BF02374772
- Bharati K, Mohanty SR, Rao VR, Adhya TK. 1999. Effect of endosulfan on methane production from three tropical soils incubated under flooded condition. Bull Environ Contam Toxicol. 63:211–218. doi:10.1007/s001289900968
- Botao ZWWGZ, Shirong WHC. 1992. Studies on the chemical components of tea seed oil and cake. J Nanjing Normal U (Nat Sci). 3:1–14.
- Buranatrevedh S, Sweatsriskul P. 2005. Model development for health promotion and control of occupational health hazards and accidents in Pathumthani, Thailand. Ind Health. 43:669–676.
- Calver M, Lymbery A, McComb J, Bamford M. 2009. Environmental biology. Cambridge (UK): Cambridge University Press.
- Chandrasekaran S, Yoshida T. 1973. Effect of organic acid transformations in submerged soils on growth of the rice plant. Soil Sci Plant Nutr. 19:39–45. doi:10.1080/00380768.1973.10432517
- Chatterjee S, Hadi AS. 1988. Sensitivity analysis in linear regression. New York (NY): Wiley.
- Chatterjee S, Hadi AS, Price B. 2000. Regression analysis by examples. New York (NY): Wiley.
- Chowdary VM, Rao NH, Sarma PBS. 2004. A coupled soil water and nitrogen balance model for flooded rice fields in India. Agric Ecosystems Environ. 103:425–441. doi:10.1016/j.agee.2003.12.001
- Chu X, Fang H, Pan X, Wang X, Shan M, Feng B, Yu Y. 2008. Degradation of chlorpyrifos alone and in combination with chlorothalonil and their effects on soil microbial populations. J Environ Sci. 20:464–469. doi:10.1016/S1001-0742(08)62080-X
- Cochard R, Maneepitak S, Kumar P. Forthcoming 2014. Aquatic faunal abundance and diversity in relation to synthetic and natural pesticide applications in rice fields of Central Thailand. Int J Biodiv Ecosyst Serv Manage. doi:10.1080/21513732.2014.892029
- Dwivedi S, Saquib Q, Al-Khedhairy AA, Musarrat J. 2012. Butachlor induced dissipation of mitochondrial membrane potential oxidative DNA damage and necrosis in human peripheral blood mononuclear cells. Toxicology. 302:77–87. doi:10.1016/j.tox.2012.07.014
- Extoxnet. 2012. Pesticide information profile [Internet]. Ithaca (NY): Cornell University, Extension Toxicology Network; [cited 2012 Aug 10]. Available from: http://pmep.cce.cornell.edu/profiles/extoxnet/24d-captan/index.html
- Farm Chemicals International. 2012. Crop protection database [Internet]. Cordova (TN): Cotton Media Group, Farm Chemicals International; [cited 2012 Aug 10]. Available from: http://www.farmchemicalsinternational.com/crop-protection-database/
- Ghosh BC, Bhat R. 1998. Environmental hazards of nitrogen loading in wetland rice fields. Environ Pollut. 102:123–126. doi:10.1016/S0269-7491(98)80024-9
- Greene SD. 2008. Extending integrated pest management to the golden apple snail: examining a community centre approach in northeast Thailand. Int J Pest Manag. 54:95–102. doi:10.1080/09670870701621282
- Heong KL, Teng PS, Moody K. 1995. Managing rice pests with less chemicals. GeoJournal. 35:337–349. doi:10.1007/BF00989142
- INCHEM. 2012. Chemical safety information from intergovernmental organizations [Internet]. Geneva: International Programme on Chemical safety IPCS; [cited 2012 Aug 20]. Available from: http://www.inchem.org/
- International Rice Research Institute. 2010. Establishing sustainable, resource efficient agri-food supply chains (IRRI Ref. No.: DPPC2010 22). Final report: resource efficiency and ecosystems services in rice production in Thailand’s central plain: baseline research. Los Baños: International Rice Research Institute.
- Iwai CB, Sujira H, Somparn A, Komarova T, Mueller J, Noller B, Kennedy IR, Solomon KR, Gee SJ, Crossan AN. 2007. Monitoring pesticides in the paddy field ecosystem of north-eastern Thailand for environmental and health risks. Rational Environ Manag Agrochemicals. 966:259–273. doi:10.1021/bk-2007-0966.ch016
- Janardan SK, Olson CS, Schaeffer DJ. 1984. Quantitative comparisons of acute toxicity of organic chemicals to rat and fish. Ecotoxicol Environ Saf. 8:531–539. doi:10.1016/0147-6513(84)90013-7
- Katayama A, Kaneda E, Mihara K, Kuwatsuka S. 1992. Effect of pesticides on interaction among cellulose decomposition, microflora and soil conditions: insertion of cellulose sheets in flooded soil samples. Soil Sci Plant Nutr. 38:169–177. doi:10.1080/00380768.1992.10416964
- Katayama A, Kuwatsuka S. 1991. Effect of pesticides on cellulose degradation in soil under upland and flooded conditions. Soil Sci Plant Nutr. 37:1–6. doi:10.1080/00380768.1991.10415003
- Kaufman AH. 2012. Organic farmers’ connectedness with nature: exploring Thailand’s alternative agriculture network. Worldviews Glob Relig Cult Ecol. 2:154–178.
- Kreutzweiser DP, Thompson D, Grimalt S, Chartrand D, Good K, Scarr T. 2011. Environmental safety to decomposer invertebrates of azadirachtin (neem) as a systemic insecticide in trees to control emerald ash borer. Ecotoxicol Environ Saf. 74:1734–1741. doi:10.1016/j.ecoenv.2011.04.021
- Kumaraswamy S, Rath AK, Satpathy SN, Ramakrishnan B, Adhya TK, Sethunathan N. 1998. Influence of the insecticide carbofuran on the production and oxidation of methane in a flooded rice soil. Biol Fert Soil. 26:362–366.
- Lawler SP. 2001. Rice fields as temporary wetlands: a review. Isr J Zool. 47:513–528. doi:10.1560/X7K3-9JG8-MH2J-XGX1
- Min H, Ye Y, Chen Z, Wu W, Yufeng D. 2001. Effects of Butachlor on microbial populations and enzyme activities in paddy soil. J Environ Sci Health Part B. 36:581–595. doi:10.1081/PFC-100106187
- OAE. 2008. Inequality in the agricultural sector in the year 2006. Bangkok: Office of Agricultural Economics, Bureau of Agricultural Economic Research, Ministry of Agriculture and Cooperatives [in Thai language].
- Od-ompanich W, Krittisiri A, Thongnoi M. 2007. Organic and inorganic rice production: a case study in Yasothon Province, northeast Thailand. Penang: Pesticide Action Network, Asia and the Pacific. Chapter 1, Organic and inorganic rice production; 3–16.
- OPNA. 2011. Ayutthaya Annual Provincial Report [Internet]. Ayutthaya: Office of Phranakorn Sri Ayutthaya Province; [cited 2012 Jan 10] [in Thai language]. Available from: http://www.ayutthaya.go.th/2554.pdf
- PANNA. 2012. Pesticide Database. San Francisco (CA): Pesticide Action Network North America; [cited 2012 Aug 18]. Available from: http://www.pesticideinfo.org/
- Panuwet P, Siriwong W, Prapamontol T, Ryan PB, Fiedler N, Robson MG, Barr DB. 2012. Agricultural pesticide management in Thailand: status and population health risk. Environ Sci Policy. 17:72–81. doi:10.1016/j.envsci.2011.12.005
- Phongpaichit P, Baker CJ. 1995. Thailand, economy and politics. Kuala Lumpur: Oxford University Press.
- Pingali PL, Marquez CB, Palis FG, Rola AC. 1995. Impact of pesticides on farmer health and the rice environment. Dordrecht: Kluwer Academic Publishers. Chapter 12, The impact of long-term pesticide exposure on farmer health: a medical and economic analysis in the Philippines; p. 343–360.
- Poolpak T, Pokethitiyook P, Kruatrachue M, Arjarasirikoon U, Thanwaniwat N. 2008. Residue analysis of organochlorine pesticides in the Mae Klong river of Central Thailand. J Hazard Mater. 156:230–239. doi:10.1016/j.jhazmat.2007.12.078
- Praneetvatakul S, Schreinemachers P, Pananurak P, Tipraqsa P. 2013. Pesticides, external costs and policy options for Thai agriculture. Environ Sci Policy. 27:103–113. doi:10.1016/j.envsci.2012.10.019
- Raksanam B, Taneepanichskul S, Siriwong W, Robson MG. 2012. Factors associated with pesticide risk behaviors among rice farmers in rural community, Thailand. J Environ Earth Sci. 2:32–39.
- Ranamukhaarachchi SL, Wickramasinghe S. 2006. Global advances in ecology and management of golden apple snails. Los Baños: Philippine Rice Research Institute. Chapter 6, Golden apple snails in the world: introduction, impact, and control measures; p. 133–152.
- Raut AK, Kulshrestha G, Chhonkar PK. 1997. Effect of butachlor on microbial soil populations in rice fields. Toxicological Environ Chem. 59:145–149. doi:10.1080/02772249709358431
- Reddy BVP, Dhanaraj PS, Rao VVSN. 1984. Insecticide microbiology. Heidelberg: Springer. Chapter 8, Effects of insecticides on soil microorganisms; p. 169–210.
- Roger PA. 1995. Impact of pesticides on farmer health and the rice environment. Dordrecht: Kluwer Academic Publishers. Chapter 10, The impact of pesticides on wetland rice field microflora: a review; p. 271–308.
- Ruay-aree S. 2003. Impact of insecticides on natural enemies, arthropod guild communities and species diversity in rice ecosystems. Annual Rice Insects Research Report Year 2001–2003. Bangkok: Department of Agriculture [in Thai language].
- Ryan J, Estefan G, Rashid A. 2001. Soil and plant analysis laboratory manual. 2nd ed. Aleppo: International Centre for Agricultural Research in the Dry Areas ICARDA.
- Sapbamrer R, Damrongsat A, Kongtun P. 2011. Health impact assessment of pesticide use in northern Thailand. J Environ Resp. 33:1–11.
- Savary S, Horgan F, Willocquet L, Heong KL. 2012. A review of principles for sustainable pest management in rice. Crop Prot. 32:54–63. doi:10.1016/j.cropro.2011.10.012
- Schellenberger S., Drake HL, Kolb S. 2012. Impairment of cellulose- and cellobiose-degrading soil bacteria by two acidic herbicides. FEMS Microbiol Lett. 327:60–65. doi:10.1111/j.1574-6968.2011.02460.x
- Schoenly K, Mew TW, Reichardt W. 1998. Sustainability of rice in the global food system. In: Dowling NG, Greenfield SM, Fischer KS, editors. Biological diversity of rice landscapes. Manila: Pacific Studies Center, International Rice Research Center; p. 285–302.
- Schulte EE, Hoskins B. 2009. Recommended soil testing procedure for the northeastern United States. Newark (DE): University of Delaware. Chapter 8, Recommended soil organic matter test; p. 63–74.
- Sematong S, Zapuang K, Kitana N. 2008. Pesticide use, farmer knowledge and awareness in Thong Pha Phum region, Kanchanaburi province. J Health Res. 22:15–20.
- Settle WH, Ariawan H, Astuti ET, Cahyana W, Hakim AL, Hindayana D, Lestari AS. 1996. Managing tropical rice pests through conservation of generalist natural enemies and alternative prey. Ecology. 77:1975–1988. doi:10.2307/2265694
- Simpson I, Roger PA, Oficial R., Grant IF. 1994. Effects of nitrogen fertilizer and pesticide management on floodwater ecology in a wetland ricefield. Biol Fertil Soils. 17:129–137. doi:10.1007/BF00337745
- Simpson IC, Roger PA. 1995. Impact of pesticides on farmer health and the rice environment. Dordrecht (Netherlands): Kluwer Academic Publishers. Chapter 9, The impact of pesticides on non-target aquatic invertebrates in wetland rice fields: a review; p. 249–270.
- Spencer D, Lembi C, Blank R. 2006. Spatial and temporal variation in the composition and biomass of algae present in selected California rice fields. J Freshwater Ecol. 21:649–656. doi:10.1080/02705060.2006.9664126
- Sribarikij K. 2011. Situation of organic farming in Thailand. Bang Khen: Office of Agricultural Economics. [in Thai language].
- Srisai U, Srisai S, Sathanasaowapath V, Sakaew S. 2003. Study on various green manure crops for soil improvement in Banthon soil series. Bangkok: Office of Land Development Region 12, Land Development Department [in Thai language].
- Tejada AW, Varca LM, Ocampo P, Bajet CM, Magallona ED. 1993. Fate and residues of pesticides in rice production. Int J Pest Manag. 39:281–287. doi:10.1080/09670879309371806
- Thapinta A, Hudak PF. 2000. Pesticide use and residual occurrence in Thailand. Environ Monit Assess. 60:103–114. doi:10.1023/A:1006156313253
- TMD. 2012. Thai meteorological department; daily rainfall in Ayutthaya province on the year 2011. Bangkok: Ministry of Information and Communication Technology. Available from: http://cdms.tmd.go.th/
- Tran VM, Perry JM. 2003. Challenges to using neem (Azadirachta indica var. sianensis Valenton) in Thailand. Econ Bot. 57:93–102. doi:10.1663/0013-0001(2003)057[0093:CTUNAI]2.0.CO;2
- Tri Phung D, Connell D, Miller G, Hodge M, Patel R, Cheng R, Abeyewardene M, Chu C. 2012. Biological monitoring of chlorpyrifos exposure to rice farmers in Vietnam. Chemosphere. 87:294–300. doi:10.1016/j.chemosphere.2011.11.075
- Usui Y, Kasubuchi T. 2011. Effects of herbicide application on carbon dioxide, dissolved oxygen, pH, and RpH in paddy-field ponded water. Soil Sci Plant Nutr. 57:1–6. doi:10.1080/00380768.2010.541868
- Varca LM. 2012. Pesticide residues in surface waters of Pagsanjan-Lumban catchment of Laguna de Bay, Philippines. Agric Water Manag. 106:35–41. doi:10.1016/j.agwat.2011.08.006
- Watanabe H, Takagi K. 2000. A simulation model for predicting pesticide concentrations in paddy water and surface soil. I. Model development. Environ Technol. 21:1379–1391.
- Way MJ, Heong KL. 1994. The role of biodiversity in the dynamics and management of insect pests of tropical irrigated rice – a review. Bull Entomol Res. 84:567–587. doi:10.1017/S000748530003282X
- WHO. 2010. The WHO recommended classification of pesticides by hazard and guideline to classification 2009. International Programme on Chemical Safety, World Health Organization. Stuttgart: Wissenschaftliche Verlagsgesellschaft GmbH.
- Wilson AL, Watts RJ, Stevens MM. 2008. Effects of different management regimes on aquatic macroinvertebrate diversity in Australian rice fields. Ecol Res. 23:565–572. doi:10.1007/s11284-007-0410-z
- World Bank. 2013. World development indicators. Thailand; Washington (DC): World Bank; [cited 2013 Aug 10]. Available from: http://data.worldbank.org/country/thailand
- Yamada J. 1998. Capital outflow from the agriculture sector in Thailand. No. 1910, World Bank Publications. Washington (DC): World Bank.
- Zeng L, Lesch SM, Grieve CM. 2003. Rice growth and yield respond to changes in water depth and salinity stress. Agric Water Manag. 59:67–75. doi:10.1016/S0378-3774(02)00088-4