
ABSTRACT
Plantation forests are becoming an increasingly important component of the world’s forested ecosystem. However, relatively little is known about how forest plantation management, overstory tree species composition and diversity impact biodiversity of nontree components of the forest. We assessed changes in ant functional group composition as related to changes in overstory tree diversity (monocultures vs. polycultures), species composition (native African species vs. exotic teak), and time (one and two years after planting). A pitfall trapping scheme was implemented during the summer months of 2006 and 2007. A total of 7473 specimens were collected representing six subfamilies, 22 genera, and 65 species. We found no significant differences in traditional diversity measures or functional group composition between treatments one year after planting. Two years after planting, we found that species richness of ground foraging ants had significantly increased (F = 4.60, d.f. = 4, 15, p = 0.01). Several observed trends may have indicated that these ant communities were in transition and will likely become more distinct over time as the different plantation types recover from disturbance and diverge from each other in overstory structure.
EDITED BY Sheila Ward
Introduction
Tropical forests are under numerous economic, political, and social pressures including land conversion for agricultural and infrastructure development and tropical timber production. Africa has seen the highest rate of change in forest cover with an annual loss rate of just under 1 million hectares per year between 1990 and 2010 (FAO Citation2011). Decreasing tropical forest area, a decline in native timber stock, and increasing demand for timber products have led to plantation forests becoming an increasingly important component of the world’s forested lands. Between 2000 and 2010, the rate of planted forest establishment rose to 115,000 ha per year (FAO Citation2011). Planted forest area represented approximately 187 million hectares worldwide in 2000 (FAO Citation2001) and rose to 260 million hectares worldwide by 2010 (FAO Citation2011). Plantation forests are depended on for wood biomass production, soil and water conservation, and wind protection (Carnus et al. Citation2003) and are key sources of fuel wood and nontimber forest products (FAO Citation2015).
In 2010, planted forests represented almost 2.5 million hectares in West Africa (FAO Citation2011). In 2005, Ghana had an estimated 160,000 ha of forest plantations (FAO Citation2005), an increase in 85,000 ha since 2001 (FAO Citation2001). Of this approximately 90% was estimated to be exotic species, predominantly Tectona grandis monocultures. In spite of their high productivity and ability to meet some timber production goals, exotic species cannot satisfactorily fill the ecological and socioeconomic roles of native species. Little research has been undertaken to understand the relationship between forest management and biodiversity (Hartley Citation2002). In addition, the majority of assessments made have not satisfactorily evaluated a variety of alternative land uses such as native species plantations, polycultures, and nonforested land uses (Stephens & Wagner Citation2007).
With the increasing loss of habitats and biodiversity around the world, there is an urgent need for biodiversity assessment (Agosti et al. Citation2000). There is considerable interest in the identification of robust bioindicators for use in land monitoring and assessment programs (Noss Citation1990). Living organisms can integrate a variety of effects over time that short-term physical and chemical measures cannot, making them suitable indicators of environmental conditions (Danks Citation1992). Traditionally, bioindicators have been used to assess ecosystem response to human-induced environmental perturbation (Agosti et al. Citation2000). Terrestrial invertebrates are an important component of forest ecosystems and comprise a major part of their biological diversity (Beattie et al. Citation1992). In contrast to larger more mobile animals, terrestrial invertebrates are less likely to move between treatment units, so their presence is a better indication of and more strongly related to site condition (Bromham et al. Citation1999). Terrestrial invertebrates dominate the biomass, are highly diverse, occur ubiquitously, and are fundamentally important in ecosystem function (Samways Citation1994; Andersen Citation1995). Recent work on bioindicators identification has focused on soil invertebrates and microfauna (Cluzeaua et al. Citation2012). Specific insect guilds are highly sensitive to habitat disturbance (Day et al. Citation1993; Samways Citation1994; Mendez et al. Citation1995). For example, carabids (Kromp Citation1990; Beaudry et al. Citation1997; Villa-Castillo & Wagner Citation2002), Lepidoptera (Holloway & Stork Citation1991; Kremen Citation1992), Odonata (Samways Citation1996), and Formicidae (Buffington Citation1967; Majer Citation1982; Andersen Citation1990, Citation1991, Citation1995, Citation1997a; Roth et al. Citation1994; York Citation1994, Citation1999, Citation2000; Brown Citation1997; King et al. Citation1998; Peck et al. Citation1998; Bromham et al. Citation1999; Andrew et al. Citation2000; Vanderwoude et al. 2000; Stephens & Wagner Citation2006), have all been used successfully as bioindicators (Peck et al. Citation1998).
We selected ants as potential bioindicators of land-use type, because of their high diversity and biomass, their ecological importance at all trophic levels, their ease of sampling, and their well-understood community dynamics (Andersen & Sparling Citation1997). Furthermore, ants consistently show strong successional patterns in ecosystems and their functional diversity and composition are related to land management practices and disturbances (Andersen & Sparling Citation1997), including forest management (Andersen & Sparling Citation1997; Vanderwoude et al. Citation2000; Willett Citation2001; Stephens & Wagner Citation2006). Majer (Citation1983) showed that ants could be used to monitor ecosystem recovery and disturbance and have been used extensively in Australia to observe rehabilitation of mine sites. Additionally, ants have high spatial and temporal fidelity to sites (Nakamura et al. Citation2015).
The objectives of this study were to experimentally evaluate changes in ant species diversity and functional group composition under different levels of overstory tree diversity (a monoculture and six and 10 species polycultures of native species) and in plantations of native African species and an exotic species (Tectona grandis, or teak). We also looked for indicator species and functional groups for each type of plantation. We tested the hypothesis that changes in ant species diversity and ant functional group composition would be related to differences in overstory tree diversity and/or native vs. exotic species.
Materials and methods
Study sites
This study was conducted in Ghana, West Africa in the moist semi-deciduous forest zone between 6°34ʹ33ʺ N and 7°10ʹ49ʺ N. The moist semi-deciduous forest zone is the most extensive closed canopy forest type in Ghana, characterized by multistory canopy layers and approximately equal proportions of evergreen and deciduous species. This is the major timber-producing area in Ghana and is suitable for the production of agricultural crops, orchard crops, and exotic timber plantations (Wagner et al. Citation2008).
During July of 2005, experimental plantations were established on degraded forest sites within the South Fomangsu Forest Reserve (6°35ʹN, 0° 57ʹW) and Afram Headwaters Forest Reserve (7°10ʹN, 1°40ʹW). Both reserves are located within the moist semi-deciduous forest zone and are approximately 90 km apart. Degraded areas were identified within the reserves as lacking overstory trees and being dominated by weedy grass species and some woody shrubs. The degradation within the reserves was initially due to encroachment of illegal agriculture and chainsaw felling of timber. The degraded areas were within the bounds of the forest reserves and approximately 25–40 ha in size. We anticipated that the neighboring forests would provide a source for colonizing ant fauna. These plantations were established as part of a larger study examining the impacts of overstory tree diversity and species composition on ecosystem functions.
Experimental design
The treatments selected included (1) a native species monoculture, of Khaya ivorensis (an African mahogany), (2) exotic species monoculture, Tectona grandis (teak), and two polyculture conditions of (3) a six native timber species mixture, and (4) a 10 native timber species mixture (). The experimental plantations included tree species that represent different successional stages, growth forms and economic values ranging from timber to non-timber forest products (). Two replicates of each treatment were installed at each Forest Reserve. Plantations were set in complete randomized blocks with each block containing 1 replicate of each of the four treatments, for two replicates of each treatment at each forest reserve. Each individual plantation was 40 m × 40 m with an initial planting distance of 1 m. Within each mixed native species plantation, trees of each species were randomly distributed. All seedlings were of local provenance and reared in the FORIG nursery until approximately 3 months in age. A 4 m buffer was left between treatments.
Table 1. Species diversity and composition of treatments.
Table 2. Tree species characteristics.
Ant sampling
Sampling of ants via pitfall traps was conducted during July/August in 2006 and 2007, after the onset of the short rainy season, at one and two years after plantation establishment. Five pitfall traps were placed on each of two parallel 25-m transects at 5-m spacing, for a total of ten pitfall traps per treatment replica. Transects were placed at the center of each replicate plantation with a random start and direction within the stand. The traps were placed in two parallel transects instead of a single transect to reduce edge effects.
A pitfall trap consisted of a plastic deli style container (11 cm diameter by 8 cm deep) buried flush to ground level. During the 48-hour sampling periods, traps were set flush with the soil surface and with approximately 250 ml of soapy water in the trap. Any debris inside the trap was carefully removed when the traps were set. Preliminary trap testing conducting in the field ranged from 24 hours to 10 days. Analysis of these trap catches showed a 48-hour trapping period allowed for sufficient ant capture and reduced the risk of trap disturbance and flooding, especially during the rainy season. In addition, species richness curves were optimized at between six and eight traps (unpublished data).
Pitfall trapping has been widely used in studies of Australian ant communities (Andersen Citation1995) and has been shown to provide a reliable estimate of species composition (Andersen Citation1991; Agosti et al. Citation2000). Andersen (Citation1991) showed that pitfall trapping for ants was an adequate collection method for habitats with dense litter and vegetation as occurred at the sites in this study, in comparison to more time-intensive quadrant counts, which are better suited to open habitat types. The use of pitfall traps may underrepresent cryptic, soil-litter-dwelling ant species, although they do occur in small numbers.
The contents of each trap were collected individually and transported back to the lab for sorting, preservation, and preparation of museum vouchers. Ants were identified to species and placed into functional groups as adapted from Andersen (Citation2007 and personal communication) and described in ; identifications were based on Taylor (Citation2007). Members of the genus Dorylus were excluded from this study because they are highly mobile and do not establish long-term stationary colonies, and therefore are not associated with long-term site characteristics. This behavior precludes them from being suitable bioindicators. Specimens were vouched by Dr. Brian Taylor and have been deposited into the Northern Arizona University School of Forestry voucher collection and in the Forestry Research Institution of Ghana insectarium.
Table 3. Classification of ant functional groups collected from the semi-deciduous forest zone of Ghana, West Africa.
Ant species diversity and functional groups
The traditional diversity measures of species richness (R), the Shannon-Wiener Diversity Index (H), and the Simpson Dominance Index (D) were calculated for each treatment. Species richness is the number of species observed. The Shannon-Wiener Diversity Index was calculated as a measure of relative diversity per treatment type per year. The Simpson Dominance Index was used to determine the strength of species numerical abundance. These traditional diversity measures fail to assess species assemblages or groups with particular traits, so species were also grouped into functional groups for further analysis. Functional groups were determined according to behaviors, habitat preferences, and trophic level interactions, using existing functional group assignments developed by Andersen (Citation2007 and personal communication).
Statistical analyses
Prior to any statistical interpretation of the ant data, we decided to pool the trap collections across treatment replicate to obtain one value per treatment replicate per year, because we were primarily interested in observing indicator species and guild responses to treatment. Effect of treatment was evaluated in two separate analyses: (1) comparing plantations with different levels of diversity of native species (1, 6, and 10 native species; ), and (2) comparing native African species (all plantations) with exotic teak monocultures. We used data from each year to determine if changes in communities occurred over time.
We applied standard analysis of variance (ANOVA) tests to determine differences between traditional diversity indices in overstory tree diversity treatments using JMP In 5.1.2 (SAS Citation2004) after meeting assumptions of normality and equal variance. Nonparametric Welch ANOVA was applied when standard ANOVA assumptions were not met (SAS Citation2004). To determine differences between species diversity indices for the native vs. exotic treatments, we applied a two-sample t-test after meeting assumptions of normality and equal variance (Hays Citation1963).
Functional group analysis
Multiple response permutation analyses (MRPP) was performed for the relative abundance measures of each ant functional group to test the null hypothesis of no difference in functional group composition among treatments (McCune & Mefford Citation2006). Indicator species value analysis (referred to as indicator value) by the Dufrene and Legendre (Citation1997) method was performed to determine the specific contributions of each species to the functional group and to determine the strength of indication of treatment provided by either a functional group or an individual species (Stephens & Wagner Citation2006).
Results
A total of 7473 specimens were collected representing six subfamilies, 22 genera and 65 species (). The number of specimens collected per treatment was similar and ranged from 746 to 1262. The greatest number of species was trapped in the genus Pheidole (16 species). The most commonly trapped ants were members of Pheidole, represented by three to six species per treatment. The most frequently observed ant was Odontomachus troglodytes Santschi, which represented 17–55% of ants collected per treatment. Composition of ant communities by functional group varied little between treatments. Results from two years after planting showed increases in ant species richness and nonsignificant differences in ant community composition.
Table 4. Composition of ant genera by functional group. Data are number of species per genera, with percent total ants per treatment per year (column) in brackets.
Ant species diversity and overstory tree species diversity
At one year after planting, there were no significant differences in measures of ant species diversity in relation to overstory diversity of native tree species (). Insignificant measures included species richness (F = 0.96; d.f. = 4, 15; p = 0.5), Shannon-Weiner Diversity Index (F = 0.82; d.f. = 4, 15; p = 0.5), and Simpson’s Dominance Index (F = 0.76; d.f. = 4, 15; p = 0.6) (). At two years after planting species richness was significantly different between treatments (F = 4.60; d.f. = 4, 15; p = 0.01). Species richness was highest in the plantations of six native timber species (R = 19.75 ±SE 1.48) and lowest in the native African mahogany monoculture (R = 13.25 ±SE 1.48) and (). Shannon-Weiner Diversity Index (F = 2.28; d.f. = 4, 15; p = 0.1) was highest in the plantations of six native timber species (H = 2.22 ±SE 0.24) and lowest in native African mahogany monocultures (H = 1.38 ±SE 0.24) (). Simpson’s Dominance Index (F = 1.64; d.f. = 4, 15; p = 0.2) was highest in the plantations of six native timber species (D = 0.83 ±SE 0.09) and lowest in native African mahogany monocultures (D = 0.54 ±SE 0.09) ().
Figure 1. Ant species richness (R) comparisons with standard error bars in 2-year-old plantations for (a) overstory tree species diversity, and (b) teak monocultures s. all native species plantations. Significance shown at α = 0.05. Bars with different letters are statistically different based on a standard mean separation test.
Figure 2. Shannon Weiner Index (H) comparisons with standard error bars for ant species in 2-year-old plantations for (a) overstory tree species diversity, and (b) teak monocultures vs. all native species plantations. Significance shown at α = 0.05. Bars with different letters are statistically different based on a standard mean separation test.
Figure 3. Simpsons Dominance Index (D) with standard error bars for ant species in 2-year-old plantations for (a) overstory tree species diversity, and (b) teak monocultures vs. all native species plantations. Significance shown at α = 0.05. Bars with different letters are statistically different based on a standard mean separation test.
Ant species diversity and native species vs. teak overstories
At one year after planting, there were no significant differences between the plantations of native African species and teak in measures of ant species diversity, including species richness (native species R = 11.25; exotic teak R = 8.75) (t = −1.43, d.f. = 18, p = 0.1); Shannon-Weiner Diversity Index (t = −1.24, d.f. = 18, p = 0.1); or Simpson’s Dominance Index (t = −1.26, d.f. = 18, p = 0.2) (). However, at two years after planting, species richness (t = −2.54, d.f. = 18, p = 0.02) was significantly higher in the plantations of native species (R = 13.25) than in the exotic teak plantations (R = 11.75) ().
Functional group analysis
During both the 2006 and 2007 collection periods, neither ant functional group composition nor individual ant species composition differed significantly at among the one, six, and 10 species treatment, nor between the native African species and teak plantations (α = 0.05, ; and ). The A statistic for the MRPP comparisons of both overstory diversity and native vs. teak plantations was very close to zero for both ant functional groups and individual species in both years (), indicating that the heterogeneity within groups was equal to that expected by chance.
Table 5. Multiple response permutation procedure (MRPP) to determine ant functional group and individual species relative abundance response to treatment per year.
Figure 4. Ant functional group composition 1 year after planting for (a) overstory tree species diversity, and (b) teak monocultures vs. all native species plantations. Different ratios of column fills indicate differences in functional groups composition – greater dissimilarity between columns equals greater dissimilarity between ant communities. TCS – tropical climate specialist, SP – specialized predators, SC – subordinate camponotini, O – opportunist, G – generalist, CS – cryptic species.
Figure 5. Ant functional group composition 2 years after planting for (a) overstory tree species diversity, and (b) teak monocultures vs. all native species plantations. Different ratios of column fills indicate differences in functional groups composition – greater dissimilarity between columns equals greater dissimilarity between ant communities. TCS – tropical climate specialist, SP – specialized predators, SC – subordinate camponotini, O – opportunist, G – generalist, CS – cryptic species.
While no indicator species or groups were identified for any treatments, the Opportunist functional group dominated all of the treatments in both years, representing 36–67% of the ants collected in each treatment. The Generalist functional group was typically the second most common functional group in both years representing an average of 26% of ants collected in each treatment. Specialized predators and Subordinate Camponotini averaged 13% and 11%, respectively. Tropical climate specialist and Cryptic species were very seldom observed and contributed to less than 2% of the ants collected from any treatment (, and ).
Changes over time
Over the 2 years of the study, we observed a significant change in species richness (F = 53.22, d.f. = 8, 30, p = < 0.0001) in all treatments ( and ). The exotic teak and native African mahogany monocultures gained two and lost two species between years. The mixed native species plantations gained 10–15 species between years. We observed only small, nonsignificant changes in the proportions of functional group in each treatment (). Subordinate Camponotini species declined in all treatments, Cryptic species increased in all treatments, and Specialized Predators increased in the plantations of one, six, and 10 native tree species and declined in exotic teak monocultures. Opportunists increased in the exotic teak monocultures and native mixed species plantations and decreased in native African mahogany monocultures. Generalists increased or remained unchanged in mixed native species plantations and decreased in the teak and African mahogany monocultures.
Figure 6. Change in ant species richness one and two years after planting for (a) overstory tree species diversity, and (b) teak monocultures vs. all native species plantations. One year after planting there were no differences in species richness among treatments. 2 years after planting all treatments showed an increase in species richness which differed for both overstory diversity and between teak monoculture and the native species plantations (see also ).
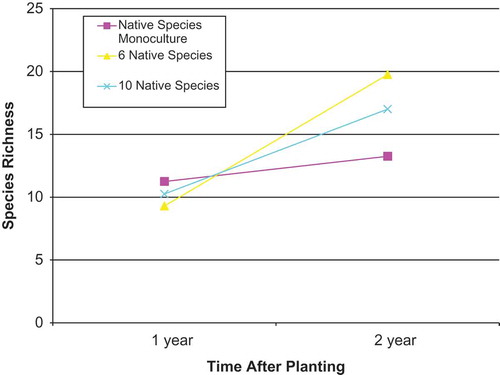
Figure 7. Changes in number of ant species representing each functional group over time for exotic teak and native African mahogany monocultures, 6 and 10 native species mixed plantations. Positive bars indicate an increase in species per functional group, negative bars indicate a decrease in the number of species per functional group. TCS – tropical climate specialist, SP – specialized predators, SC – subordinate camponotini, O – opportunist, G – generalist, CS – cryptic species.
Discussion
Over the two years of the study, we observed a 20% increase in species richness across all treatments (). If current trends persist, we predict species diversity will become stable over time. As supported by other observations (Stephens et al. Citation2008), we expect distinct ant communities will develop in these plantation types, which may include specific indicator species or functional groups.
This study highlights the potential of ants as bioindicators of habitats conditions in tropical forested systems, where they have been generally underutilized (Piper et al. Citation2009). Anderson (Citation1991) indicated that ants are associated with structural components of their habitats. Peck et al. (Citation1998) saw significant changes in ant communities based on vegetation community diversity and structure. Disturbance resulting from fire and timber management has been observed to affect ant communities (Neumann Citation1992; Andrew et al. Citation2000; York Citation2000).
Changes in ant diversity and overstory composition
Overstory tree diversity had a positive impact on ant species diversity at two years after plantation establishment (–, and ), although not at one year after planting. Increasing overstory tree diversity from one to six species resulted in a 30% increase in ant species richness. The species present in the six and ten native timber species plantations increased by 15 and 10 species respectively between the first and second years (). This suggests that, within plantation forests, moderate increases in overstory tree diversity can have a significant effect on ant biodiversity, and perhaps on other taxa.
Native environments typically support higher number of insect species than non-native environments (DeGomez & Wagner Citation2001). In this study, the native species plantations had approximately 20% more ant species than the exotic teak plantation over both years (). At two years, the native species plantations had significantly higher species richness teak plantations. A nonsignificant difference in species composition was also observed () with six genera being unique to the native African species overstories and only one genera unique to teak plantations. Since teak is a major plantation species in West Africa and elsewhere (FAO 20001), the lower associated ant diversity in this study is of concern.
Ant functional groups and succession
Whereas traditional diversity measures are based on numerical counts, functional group analysis is based on differences in characteristics among species groups. Unlike traditional diversity measures, functional group analysis permits examination of how species habitat requirements and competitive interactions may impact diversity patterns (Anderson Citation1991). In this study, the relative abundances of each functional group were similar among treatments especially at one year after planting ( and ), with MRRP A values indicating high homogeneity between treatments (). However, by Year 2, we see a trend of increasing heterogeneity in ant functional groups among treatments in MRRP A values (although still insignificant) ().
This study may have presented the early stages of establishment of distinct ant communities under differing overstory composition. As the treatment areas recover from forest degradation, disturbance, and plantation establishment (site prep, planting, and early site maintenance), and their composition and structure become more distinct, more distinct ant communities may emerge. Significant differences among plantation types in ant diversity indicators were detectable at only twoyears after plantation establishment. Other work (Stephens et al. Citation2008) assessed ants as indicators of land use in Ghana at 10–13 years after planting and found distinct patterns in communities of ants and other organisms among agriculture, citrus orchards, exotic species plantations, mixed native species plantations, and native forests. The plantations were similar in species composition to the 10 native timber species plantation and teak monocultures used in this study. The agricultural areas and citrus orchards were also similar to the degraded conditions prior to plantation establishment for this study at the Forest Reserve sites. Furthermore, indicator species and functional groups were identified for the more mature land uses (Stephens et al. Citation2008). These observations support the conjecture that the newly established plantations of this study are in the early stages of establishment for distinct ant communities.
In Years 1 and 2 under different overstory types, the ant communities were generally dominated by Opportunists and Generalists ( and ). We have observed that Opportunists tend to move into disturbed habitats (Stephen et al. unpublished), whereas Generalists seem indifferent to successional stage. In this study, between Years 1 and 2, Opportunists increased (except for the native African mahogany monoculture) and Generalists showed no pattern (). In another study (Stephen et al. unpublished), a similar relationship between Opportunist and Generalist functional groups and different land uses was observed, with Opportunists dominating agricultural fields. We anticipate future changes from Opportunist-dominated ant communities to more functional group diversity and stronger links to overstory tree diversity and composition.
Nonsignificant shifts in functional group composition between Year 1 and Year 2 include decreases in the subordinate Camponotini (SC) and increases in the Cryptic species functional groups in all treatments. The SC group was composed largely of arboreal Camponotus species strongly associated with downed woody debris (Higgins & Lingren Citation2006; Stephens & Wagner Citation2006). The Camponotus species that were found in Year 1 may have been residual populations using coarse woody debris and the few small shrubs remaining from before overstory removal and plantation establishment. By Year 2, since woody material on the treatment sites had lessened and the young trees were not of sufficient size to provide suitable habitat, Camponotus species were probably being displaced by more pioneering species more adapted to disturbance and early successional conditions. Camponotus species may re-enter these areas when the overstory trees mature and provide habitat.
In contrast to the SC group, Cryptic species such as Strumigenys species, specialize in predation on leaf litter dwelling microinvertebrates (Holldobler & Wilson Citation1990). The increase in Cryptic species between Years 1 and 2 was likely a response to changes in understory and soil conditions after removal of agricultural crops and plantation establishment that improved microhabitats for their prey. The number of species in the Specialist Predators (SP) functional group also increased in all of the native overstory treatments () from Year 1 to Year 2, perhaps as a consequence of understory changes. For example, Cerapachys sp. are predators of termites and other ants, particularly Pheidole sp. (Holldobler & Wilson Citation1990). Pheidole is a Generalist, which was readily abundant in treatments where Specialist Predators were observed (, ).
As these young plantations transition through successional stages of stand development, it seems likely that distinct ant community patterns will emerge. Our experimental plantations with managed understories and open canopies may not yet have developed all of the characteristics that promote specific ant functional groups or species. Regular weeding was used to control the understory vegetation during the early years of plantation development, and the tree species used in these plantations have different growth characteristics () and grew at significantly different rates, all of which may have impacted ant community composition and diversity. The cumulative differences in the plantation types as the stands develop will impact both the overstory and understory ant communities. As canopy structure matures, shading of the understory will increase and changes in understory vegetation and leaf litter will support different ant communities. For example, as individual trees increase in bole diameter and height during stand succession, several species of arboreal nesters would be expected to appear, including carton-nesting Crematogastor spp. and Camponotus spp. (Holldobler & Wilson Citation1990).
Future research is required to fully assess the stages of stand development and management that are most influential on ant communities. As these plantations mature and are managed over time, some tree species are likely to be thinned or harvested to meet management objectives. This would present the opportunity to assess how those changes in stand structure and diversity further impact ant communities. A longer period of observation over 5–10 years may reveal the full sequence of ant community assemblage establishment and the appearance of indicator species and functional groups associated with overstory tree diversity and composition. Additional work could be conducted to assess the association of ant communities with changes in understory vegetation, leaf litter, and soil characteristics.
Conclusion
Biodiversity is clearly an important component of ecosystems, supporting their function (Tilman et al. Citation1996) and their anthropocentric value (Wilson Citation1984). Conventional wisdom has long held that biodiversity and plantation forests are mutually exclusive (Stephens & Wagner Citation2007). Stephens and Wagner (Citation2007) argued the importance of land use comparisons prior to passing judgment on plantation forest impacts on biodiversity. Observed cases in the literature indicate that plantation management, can impact biodiversity positively and negatively, depending on the strategies used. Based on the results of this study and other work (Stephens et al. Citation2008), the six native tree species mixture at only two years after planting recouped an astonishing 80% of the total number of ant species, and from 40% to 100% of the individual ant functional groups observed at native forest sites. The native African mahogany monoculture recouped 60% of native forest ant diversity. These numbers show that biodiversity and plantation forests are not necessarily at odds. Casual observation of soil, microclimate, understory plants, and birds, reptiles and mammals in the more mature mixed native species and exotic teak plantations suggest that strong community difference are likely occur across numerous floral and faunal groups in different kinds of plantations. Our findings suggest that moderate changes in management, such as focusing on mixed native species plantations, can recapture a significant level of native forest ant diversity and potentially other taxa as well.
Acknowledgements
The authors would like to thank Dr. Brian Taylor for his assistance with African ant taxonomy, Dr. Andersen for his assistance with ant functional group assessment, Dr. McGavin and the current staff of the Oxford University Museum of Natural History – entomology collections for lab space, and the Forestry Research Institute of Ghana staff for assistance with field work, logistics and a home away from home.
Disclosure statement
No potential conflict of interest was reported by the authors.
Additional information
Funding
References
- Agosti D, Majer JD, Alonso LE, Schultz TR. 2000. Ants: standard methods for measuring and monitoring biodiversity. Washington, DC: Smithsonian Press; 280pp.
- Andersen AN. 1990. The use of ant communities to evaluate change in Australian terrestrial ecosystems: a review and recipe. Proc Ecol Soc Aust. 25:99–107.
- Andersen AN. 1991. Responses of ground-foraging ant communities to three experimental fire regimes in a savanna forest of tropical Australia. Biotropica. 23:575–585.
- Andersen AN. 1995. Measuring more of biodiversity: genus richness as a surrogate for species richness in Australian ant faunas. Biol Conserv. 73:39–43.
- Andersen AN. 1997a. Using ants as bioindicators: multiscale issues in ant community ecology. Conserv Ecol. 8:1–15.
- Andersen AN. 1997b. Functional groups and patterns of organization in North American ant communities: a comparison with Australia. J Biogeogr. 24:433–460.
- Andersen AN. 2007. Ant diversity in arid Australia: a systematic overview. In: Snelling RR, Fisher BL, Ward PS, editors. Advances in ant systematics (Hymenoptera: Formicidae): homage to E. O. Wilson – 50 years of contributions. Gainsville (FL): Memoirs of the American Entomological Institute, 80. p. 19–51.
- Andersen AN, Sparling GP. 1997. Ants as indicators of restoration success: relationship with soil microbial biomass in the Australian seasonal tropics. Restor Ecol. 5:109–114.
- Andrew N, Rodgerson L, York A. 2000. Frequent fuel-reduction burning: the role of logs and associated leaf litter in the conservation of ant biodiversity. Austral Ecol. 25:99–107.
- Beattie A, Auld B, Greenslade P. 1992. Changes in Australian terrestrial biodiversity since European settlement and into the future. In: Gifford RM, Barson MM, editors. Australia’s renewable resources: sustainability and global change. International Geosphere-Biosphere Program Australia Planning Workshop, Bureau of Rural Resources Proceedings No. 14 AGPS; 1990 Oct 3–4; Canberra. p. 189–202, 206.
- Beaudry S, Duchesne LC, Cote B. 1997. Short-term effects of three forestry practices on carabid assemblages in a jack pine forest. Can J For Res. 27:2065–2071.
- Bromham L, Cardillo M, Bennet AF, Elgar MA. 1999. Effects of stock grazing on the ground invertebrate fauna of woodland remnants. J Ecol. 24:199–207.
- Brown BJ, Ewel JJ. 1987. Herbivory in complex and simple tropical successional ecosystems. Ecology. 68:108–116.
- Brown Jr KS. 1997. Diversity, disturbance, and sustainable use of Neotropical forest: insects as indicators for conservation monitoring. J Ins Con. 1:25–42.
- Buffington JD. 1967. Soil arthropod populations of the New Jersey pine barrens as affected by fire. Ann Entomol Soc Am. 60:530–535.
- Carnus J, Parrotta MJ, Brockerhoff EG, Arbez M, Jactel H, Kremer A, Lamb D, O’Hara K, Walters B. 2003. Planted forests and biodiversity. Paper Presented at: UNFF Intersessional experts Meeting on the Role of Planted Forests in Sustainable Forest Management; 2003 Mar 24–2003 Mar 30; New Zealand.
- Cluzeaua D, Guerniona M, Chaussodb R, Martin-Laurentb F, Villenavec C, Cortetd J, Ruiz-Camachoe N, Perninf C, Mateilleg T, Philippotb L, et al. 2012. Integration of biodiversity in soil quality monitoring: baselines for microbial and soil fauna parameters for different land-use types. Eur J Soil Biol. 49:63–72.
- Danks HV. 1992. Arctic insects as indicators of environmental change. Arctic. 45:159–166.
- Day KR, Marshall S, Heaney C. 1993. Associations between forest type and invertebrates: ground beetle community patterns in a natural oakwood and juxtaposed conifer plantations. Forestry. 66:37–50.
- DeGomez T, Wagner MR. 2001. Arthropod diversity of exotic vs. native Robinia species in northern Arizona. Agric For Entomol. 3:19–27.
- Dufrene M, Legendre P. 1997. Species assemblages and indicator species: the need for a flexible asymmetrical approach. Ecol Monogr. 67:345–366.
- FAO. 2001. State of the world’s forests 2001. Rome: Food and Agriculture Organization of the United Nations.
- FAO. 2005. State of the world’s forest 2005. Rome: Food and Agriculture Organization of the United Nations.
- FAO. 2011. State of the World’s Forests 2015. Rome: Food and Agriculture Organization of the United Nations.
- FAO. 2015. State of the World’s Forests 2011. Rome: Food and Agriculture Organization of the United Nations.
- Hartley MJ. 2002. Rationale and methods for conserving biodiversity in plantation forests. For Ecol Manage. 155:81–95.
- Hays WL. 1963. Statistics. New York (NY): Holt, Rinehart and Winston.
- Higgins RJ, Lingren BS. 2006. The fine scale physical attributes of coarse woody debris and effects of surrounding stand structure on its utilization by ants (Hymenoptera: Formicida) in British Columbia, Canada. In: Grove SJ, Hanula JL, editors. Insect biodiversity and dead wood: proceedings of a symposium for the 22d International Congress of Entomology. Gen. Tech. Rep. SRS-XX. Asheville, NC: U.S. Department of Agriculture Forest Service, Southern Research Station, XX p.
- Holldobler B, Wilson EO. 1990. The ants. Belknap Press of Harvard (MD): Harvard University.
- Holloway JD, Stork NE. 1991. The dimensions of biodiversity: the use of invertebrates as indicators of human impact. In: Hawkesworth DL, editor. The biodiversity of microorganisms and invertebrates: its role in sustainable agriculture. Wallingford (UK): CAB International; p. 37–62, 302.
- King JR, Andersen AN, Cutter AD. 1998. Ants as Bioindicators of habitat disturbance: validation of the functional group model for Australia’s humid tropics. Biodiver Conserv. 7:1627–1638.
- Kremen C. 1992. Assessing the indicator properties of species assemblages for natural areas monitoring. Ecol Appl. 2:203–217.
- Kromp B. 1990. Carabid beetles (Coleoptera, Carabidae) as bioindicators in biological and conventional farming in Austrian potato fields. Biol Fertil Soils. 9:182–187.
- Majer JD. 1982. Recolonisation by ants and other invertebrates in rehabilitated mineral sand mines near Eneabba. Western Australia Reclamation and Revegetation Research. 1:63–81.
- Majer JD. 1983. Ants: bio-indicators of minesite rehabilitation, land-use, and land conservation. Environ Manage. 7:375–383.
- McCune B, Mefford MJ. 2006. PC-ORD: multivariate analysis of ecological data, version 5.10. Gleneden Beach (OR): MjM Software Design.
- Mendez CA, Sisk TD, Haddad NM. 1995. Beyond birds: multitaxonomic monitoring programs provide a broad measure of tropical biodiversity. In: Bissonette JA, Krausman PR, editors. Integrating people and wildlife for a sustainable future. Bethesda (MD): The Wildlife Society; p. 451–456, 715.
- Nakamura A, Burwell CJ, Ashton LA, Laidlaw MJ, Katabuchi M, Kitching RL. 2015. Indentifying indicator species of elevation: comparing the utility of woody plants, ants and moths for long-term monitoring. Austral Ecol. 1:1–10.
- Neumann FG. 1992. Responses of foraging ant populations to high-intensity wildfire, salvage logging and natural regeneration processes in Eucalyptus regnans regrowth forest of the Victorian Central Highlands. Aust For. 55:29–38.
- Noss RF. 1990. Indicators for monitoring biodiversity: a hierarchical approach. Conserv Biol. 4:355–364.
- Peck SL, McQuaid B, Campbell CL. 1998. Using ant species (Hymenoptera: formicidae) as a biological indicator of agroecosystem condition. Environ Entomol. 27:1102–1110.
- Piper SD, Catterall CP, Kanowski JJ, Proctor HC. 2009. Biodiversity recovery during rainforest reforestation as indicated by rapid assessment of epigaeic ants in tropical and subtropical Australia. Austral Ecol. 34:422–434.
- Roth DS, Perfecto I, Rathcke B. 1994. The effects of management systems on ground-foraging ant diversity in Costa Rica. Ecol Appl. 4:423–436.
- Samways MJ. 1994. Insect conservation ecology. New York (NY): Chapman and Hall; 358pp.
- Samways MJ. 1996. Spatial patterns of dragonflies (Odonata) as indicators for design of a conservation pond. Odonatologica. 25:157–166.
- SAS Institute, Inc. 2004. JMP-IN version 5.1.2, statistical analysis software. Cary (NC): SAS Institute, Inc.
- Stephens SS. 2008. Biodiversity and ecosystem function: the role of overstory tree diversity in Ghana, West Africa. Flagstaff (AZ): Northern Arizona University.
- Stephens SS, Wagner MR. 2006. Using ground foraging ant (Hymenoptera: Formicidae) functional groups as bioindicators of forest health in northern Arizona ponderosa pine forests. Environ Entomol. 35:937–949.
- Stephens SS, Wagner MR. 2007. Forest plantations and biodiversity: a fresh perspective. J For. 105:307–313.
- Taylor B. 2007–2013. The ants of (sub-Saharan) Africa [cited 2015 Sept 29]. Available from: http://www.antbase.org/ants/africa/antcover.htm
- Tilman D, Wedin D, Knops J. 1996. Productivity and sustainability influenced by biodiversity in grassland ecosystems. Nature. 279:718720.
- Vanderwoude C, Lobry de Bruyn LA, House APN. 2000. Long-term ant community responses to selective harvesting of timber from Spotted Gum (Corymbia variegata)-dominated forests in south-east Queensland. Ecol Manage Restor. 1:203–214.
- Villa-Castillo J, Wagner MR. 2002. Ground beetle (Coleoptera: Carabidae) species assemblage as an indicator of forest condition in northern arizona ponderosa pine forests. Environ Entomol. 31:242–252.
- Wagner MR, Cobbinah JR, Bosu PP. 2008. Forest entomology in West Tropical Africa: forest insects of Ghana. 2nd ed. Dordrecht: Springer; 244pp.
- Willett TR. 2001. Spiders and other arthropods as indicators in old growth versus logged redwood stands. Restor Ecol. 9:410–420.
- Wilson EO. 1984. Biophilia. Cambridge (MA): Harvard University Press; 157pp.
- York A. 1994. The long-tern effects of fire on forest ant communities: management implications for the conservation of biodiversity. Mem Queens Mus. 36:231–239.
- York A. 1999. Long-tern effects of frequent low-intensity burning on the abundance of litter-dwelling invertebrates in costal blackbutt forests of Southeastern Australia. J Insect Conserv. 3:191–199.
- York A. 2000. Long-term effects of frequent low-intensity burning on ant communities in coastal blackbutt forests of Southeastern Australia. Austral Ecol. 25:83–98.