
ABSTRACT
Responding to global environmental issues like biodiversity loss and climate change challenge national governments and intergovernmental bodies. A conventional response has been to set targets. Yet to achieve targets, governments must implement effective policies. Indicators that track policy implementation could provide information on individual country progress towards targets and for international benchmarking. We take up a recommendation from Convention on Biological Diversity mandated experts to develop a policy indicator(s) for biodiversity. This expert group identified four indicator attributes: identification, establishment, strengthening and assessment. We review biodiversity (and climate change) policies implemented in the period 1952–2012 in 54 nations using an Organisation for Economic Co-operation and Development (OECD) database. We find: the number of countries implementing biodiversity policies increased steadily until the end of the 2000s (identification); evidence of continuous innovation in the types of policy instruments implemented (establishment); and evidence of policy revision and shifts in jurisdiction (strengthening). To overcome a lack of data to evaluate policy effectiveness (assessment) we suggest improvements in data collection and the possibility to combine the OECD database with other databases.
EDITED BY Christine Fürst
1. Introduction
The publication of Silent Spring (Carson, Citation1962) was a call to action for nations to address harm to biodiversity. Six decades later, the reduction of biodiversityFootnote1 loss is a challenge affirmed by the 193 countries that are party to the Convention on Biological Diversity (CBD) in 2010 at the 10th Conference of Parties (COP-10).Footnote2 The mechanisms to achieve this goal are not prescribed and this flexibility has resulted in varied policy response measures. In practical terms, measuring global progress requires the setting of goals and the development of indicators to track progress (Organisation for Economic Co-operation and Development (OECD) Citation2003). International goals have been set with the CBD’s Strategic Plan for Biodiversity 2011–2020 (Strategic Plan) and the Aichi Biodiversity Targets (Aichi Targets). However, targets alone are insufficient; the need to measure progress towards these targets was recognised by CBD experts (the Ad Hoc Technical Expert Group, AHTEG) at the 11th Conference of the Parties (COP-11) of the CBD in 2012.
There are 20 Aichi Targets. To assist signatory nations, the COP-mandated Biodiversity Indicators Partnership (BIP) has developed lists of suitable, policy-relevant, sound and measurable indicators (OECD Citation1993) for most of the Aichi Targets. However, there are currently no indicators for Aichi Target 3. The paper aims to address this deficiency by identifying potential indicators and how these indicators can be applied in practice. Aichi Target 3 is intended to track the policy responses of signatory countries to: (1) eliminate incentives that are harmful to biodiversity by 2020 (e.g., subsidies, tax credits and regulatory advantages) and (2) to introduce positive incentives to support biodiversity-friendly behaviours.Footnote3 The CBD defines positive incentives as ‘economic, legal or institutional measure designed to encourage beneficial activities…for instance incentive payments for organic farming, agricultural land set-aside schemes as well as public or grant-aided land purchases or conservation easements.’Footnote4 Specifically, our focus in this paper is on tracking positive incentives. For readers interested in an assessment of agricultural, fishery and energy subsidies in OECD countries; their impact on biodiversity and opportunities to eliminate them, see Van Winkle et al. (Citation2015).
Van Winkle et al. (Citation2015) also review the feasibility of developing a set of Aichi Target 3 indicators for positive incentives using an existing Organisation for Economic Cooperation and Development/European Environment Agency Database, Instruments used for Environmental Policy and Natural Resources ManagementFootnote5 (the OECD/EEA Database). Although the BIP has yet to develop indicator(s) for Target 3, the AHTEG has provided some guidance, suggesting four discrete attributes for any indicator developed, to track the identification, establishment, assessment and strengthening of policy responses. Van Winkle et al. (Citation2015) take these four attributes and propose a set of five operational indicators. Note that unlike with harmful subsidies they do not undertake an assessment of positive incentives, rather they provide guidance on how such an assessment could be implemented. They define the attributes as follows: identification ‘provides information on whether a jurisdiction has considered the variety of positive incentives that could be put in place to address a particular driver of biodiversity loss or degradation’; assessment ‘provides information on whether an assessment (of the effectiveness of the incentive) has been undertaken’; establishment ‘provides information on the positive incentives that have been put in place. This could include information the type, number, and scale (e.g., geographic coverage, revenues) of incentives’ and strengthening ‘provides information on trends related to the geographic scale and/or the ambition of positive incentives in place’. Next they propose five operational indicators, the number of: (1) countries implementing positive incentives (by type) for biodiversity over time; (2) positive incentives for biodiversity by instrument type implemented over time; (3) positive incentives by sector (fish, forestry, agri-biodiversity, etc.) over time; (4) hectares under positive incentive programmes (by country, by instrument, in total, etc.) and (5) the revenue generated (or expenditure created) by positive incentives for biodiversity (as relevant) over time. In this paper, we undertake to implement these five proposed operational indicators.
Specifically, we use the OECD/EEA Database to implement four out of the five proposed operational indicators suggested by Van Winkle et al. (Citation2015). We find there is inadequate data in the OECD/EEA Database to address their Indicator 4. Furthermore, we implement two additional indicators (Trends in policy evolution: jurisdictional scale and Trends in policy evolution: policy revision) to provide further information principally for the strengthening attribute. In constructing these indicators, we provide a comprehensive and up-to-date review of positive policy responses undertaken by OECD nations in the period from 1952 through 2012 for both biodiversity-related and also climate change policies. Our decision to also assess policy responses for climate change was twofold: climate change is expected to have a significant influence on biodiversity outcomes (e.g., Hampe & Petit Citation2005; MEA Citation2005; Heller & Zavaleta Citation2009; TEEB Citation2009; UK NEA Citation2011), and it provides a basis for comparing two grand challenges faced by policymakers globally.
The six operational indicators implemented provide information on the evolution of policy responses that address three of four of the AHTEG’s goals for indicators, described earlier: on global trends in the identification, establishment and strengthening of positive policy responses. They also provide: (1) a useful catalogue of national policy responses to biodiversity loss supporting the parallel and complementary efforts of the Intergovernmental Platform on Biodiversity and Ecosystem Services (IPBES), namely, to generate a catalogue of policy support tools and methodologiesFootnote6 and (2) information that will allow countries to benchmark their efforts across time, sector, jurisdiction and instrument. The importance of information initiatives is discussed by Hill et al. (Citation2015) in their review of impediments to deliver the 20 Aichi Targets. After describing the data, our methods and results, we end with suggestions on how to combine indicators and data sets to address the AHTEG’s indicator goal for assessment.
2. Data and methods
The OECD collaborates with the EEA to collect information on implemented environmental policy instruments. Data are collected from 54 countries comprising the OECD member and accession countries and EEA member and cooperative countries. Data collection began in 1998, and for the version of the OECD/EEA Database we used, the data were last updated on March 2014. Other researchers have used the same database to track the implementation of environmental policy. Söderholm (Citation2006) used it to investigate the number of OECD countries taxing aggregates extraction. Bräuer et al. (Citation2006) used it to investigate the type of market-based incentives implemented to preserve biodiversity and to compare approaches in different regions in Europe and with the US. For our purposes, we queried the database by country, instrument, environmental domain and status (see ).
Table 1. Information available on each instrument in the OECD/EEA Database with an example.
To query the OECD/EEA Database, we used Microsoft SQL Server 2008 and to process the data, Microsoft Excel 2010. The database, as designed, defines policies with three fields, with what we presume to be an increasing level of detail: the policy name, a sub-scheme level and a description. However, there are consistency issues in the type of information contained in each field across policies and countries. To increase the usability of the database, clear input and language guidelines (and examples) should be provided to participating countries.
Nevertheless, the OECD/EEA Database is a source of valuable data. To capture information on biodiversity/climate change policy responses, it was necessary to build a set of queries as ‘biodiversity’ and ‘climate change’ were not part of the original nomenclature and therefore arguably not recognised issues when it was initially constructed. Furthermore, some policy tools, e.g., payment for ecosystem services (PES), schemes that are now common in biodiversity policy are absent. We classified biodiversity policy responses as schemes that directly target the protection of species, penalise the destruction, degradation or fragmentation of habitats, or disturb ecosystem functions. For climate change, we counted those policy responses that modify incentives for energy consumption and for greenhouse gas emissions. More general sustainability policies were not selected. After data cleaning, there were 512 biodiversity and 1284 climate change policy response records.
Using the cleaned data set, we undertook two lines of inquiry. We reviewed the feasibility of developing a set of five indicators for Aichi Target 3 using the OECD/EEA Database as suggested by Van Winkle et al. (Citation2015) and described above. Secondly, we assessed if there was sufficient information in these five indicators to address the four attributes identified by the AHTEG that, if met, are intended to provide sufficient information for an operational indicator(s) on biodiversity policy responses, i.e., for each indicator we highlight which AHTEG attributes are met by the indicator. Specifically, for identification, we use a proxy of the number of countries implementing positive incentives for biodiversity and climate change over time as there is no information on whether countries have ‘considered’ positive incentives but not implemented them. For establishment, we provided data on the number of countries that have implemented policy responses and the number of policy responses implemented at any one time and over time. This attribute also includes information on the scale (e.g., geographic coverage and revenues) of policy responses for which there is partial information. Under the strengthening attribute, we gathered information on the maturation of policy responses using information on the number of policy responses that have been revised. There was insufficient information in the database to address the assessment attribute, but we provide some insights into how to address an assessment attribute in Section 4. A summary of the attributes, indicators and data used is provided in .
Table 2. Summary of indicators with AHTEG attributes.
3. Results
Results are reported using the five (note only four are practical with the OECD/EEA Database) indicators suggested in Van Winkle et al. (Citation2015). Two additional indicators are also described that cover the scope of the policy response and the status of the policy response. For each indicator, we list, in brackets, which AHTEG attributes the indicator accounts for (identification, establishment, strengthening and assessment). A cautionary note raised by Bräuer et al. (Citation2006) and echoed here is that these preliminary indicators rely on the completeness of reporting by member states and consistency in the way each member states classifies policies.
Indicator 1:
Evolution of policy responses (Attributes: identification and establishment)
shows the number of OECD/EEA countries in each year and cumulative over the period 1952–2012 that have implemented positive incentives for biodiversity and for climate change.
Figure 1. Number of countries (out of 54) implementing biodiversity and climate policy 1952–2012.
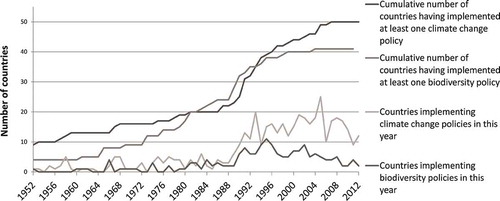
The number of countries that have implemented at least one climate change or one biodiversity positive policy response grew linearly until the end of the 1980s, before steeply increasing and plateauing in the early 2000s. Fewer countries in the sample over the period of analysis have implemented positive incentives for biodiversity as compared to climate change (41 vs. 50). There are no records in the OECD/EEA Database for positive polices being implemented by Indonesia for climate change or by Brazil, Cyprus, Indonesia, Ireland and South Africa for biodiversity. We cannot conclude that these countries did not implement positive policy responses in this period rather there are none recorded in the database.
Indicator 2:
Evolution in policy instrument types (Attributes: identification and establishment)
Beyond the longitudinal snapshot of policies implemented and shown in , we also present information on the types of policy responses implemented for biodiversity and for climate change policy, see ,).
Figure 2. (a) Evolution in policy instrument types for biodiversity and (b) Evolution in policy instrument types for climate change.
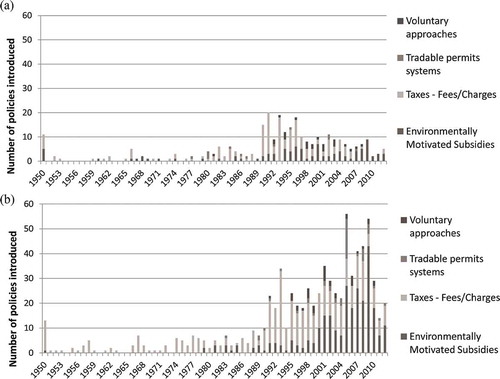
The implementation of the different types of instruments is similarly distributed for biodiversity and climate change, with taxes-fees/charges dominating, followed by environmentally motivated subsidies and then voluntary approaches and tradable permits systems (with 52%, 39%, 5% and 4% of the total biodiversity policy and 55%, 38%, 4% and 3% for the climate change policies, respectively). Overall, fewer policy response measures were adopted for biodiversity than for climate change (see ,) and also ), yet innovation in the adoption of different types of instruments is apparent earlier for biodiversity than for climate change policy responses. For instance, tradable permit systems appeared in 1977 for biodiversity and 6 years later in climate change policy, but this type of policy instrument has since been used more frequently for climate change. It is a similar story for voluntary approaches.
There is also evidence of continued reliance on subsidies and taxes and indeed of greater reliance on subsidies since 2000. This coincides in Europe with new agri-environmental measures embedded in the Common Agricultural Policy (CAP). A key theme in the 2003 CAP reforms was the decoupling of subsidies/support payments from agricultural production and the introduction of agricultural management policies to preserve cultural landscapes and biodiversity.
Indicator 3:
Distribution of policies by sector and region (Attributes: identification and establishment)
,) outlines the aggregate policies implemented by sector and by geographical region.
Figure 3. (a) Distribution of policies for biodiversity by sector and geographical region and (b) Distribution of policies for climate change by sector and geographical region.
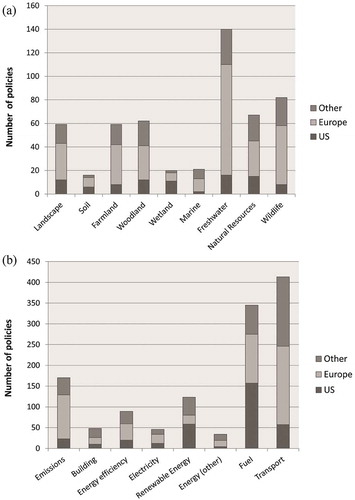
A majority of the biodiversity policies are related to freshwater and specifically to reducing water pollution or treating wastewater. We include these policies as they directly or indirectly effect water quality and freshwater/estuarine/marine habitat quality. The Natural Resources category comprises mining and mineral extraction activities and the Wildlife category covers fisheries, hunting and species protection. There is a similar distribution of schemes between Farmland, Woodland and Landscape categories. More than half of the Farmland schemes promote agri-environmental measures, a quarter targets the use of fertilisers and pesticides and the remainder are concerned with agricultural land use conservation and farm waste. The Woodland category comprised schemes to promote conservation (80% of the total) and also reforestation/afforestation. For climate change the majority of policy responses are targeted at the transport and fuel sector.
Indicator 4:
Trends in revenues raised (Attributes: strengthening)
We saw in Indicator 2 that taxes or fees were the most common policies implemented. In ,), we show the revenues raised by such taxes and fees.
Figure 4. (a) Trends in revenues raised: total and (b) Trends in revenues raised: by nation.
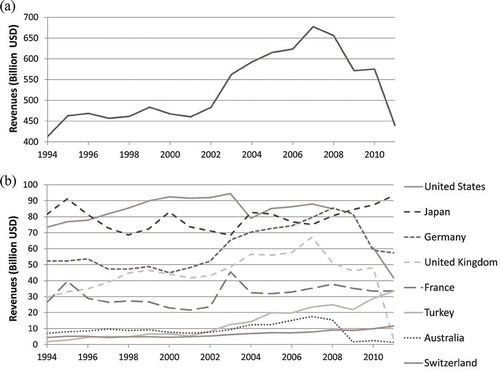
shows that total revenues raised through environmental taxes and charges were quite stable up until the end of the 1990s before rising rapidly in the early 2000s. Revenues then plummeted with the global financial crisis (2007–08). For a subset of countries, see , including the US, UK, Germany and Australia, revenues increased to the early 2000s before declining drastically between 2007 and 2008. However, in a smaller group of countries, including Turkey, Japan and Switzerland, revenues continued to increase. In France, however, there is no clear trend in the revenues raised.
Indicator 5:
Number of hectares under positive incentive programmes (Attributes: identification, establishment and strengthening)
The OECD/EEA Database does not contain data to assess the total area under positive incentive programmes. However, in Section 4, we describe another database that collects such information.
The two additional indicators we propose focus on the evolution of policy responses, specifically: jurisdictional scale and policy status (implemented and revised).
Indicator 6:
Trends in policy evolution: jurisdictional scale (Attributes: identification, establishment and strengthening)
shows that until the end of the 1980s there was a similar number of policies at the state/regional/local and national/federal scale. Since then, the number of policies implemented at a national or federal scale has exceeded the number of policies implemented at the state, regional or local levels. Furthermore, since 1995, more national policies have been introduced for climate change than for biodiversity.
Indicator 7:
Trends in policy evolution: policy revision (Attributes: identification, establishment and strengthening) plus an initial data examination step (Attribute: learning)
A trend that is particularly strong for climate change policy responses is the rapid increase in revised policies over the last decade, see .
Figure 5. Trends in policy evolution: number policies by jurisdiction.
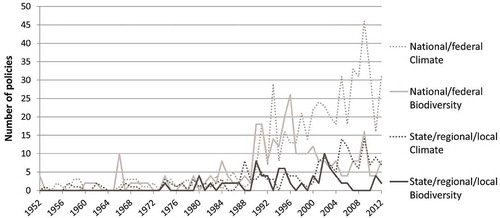
Figure 6. Trends in policy evolution: number of policies introduced and revised.
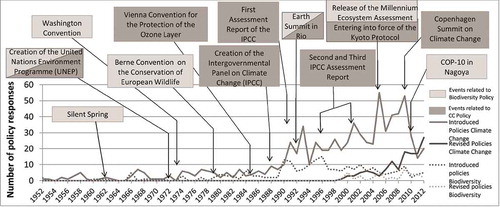
Additionally, we superimposed on annotated key external events, e.g., international treaties and meetings on global climate change and biodiversity policy that could have influenced policy adoption. We tested for statistically significant correlations between the number of biodiversity/climate change policies introduced in a year and a binary parameter that = 1 if a key event took place in that year or the previous year, i.e., in preparation for a key event, and = 0, otherwise. The results of the correlation statistics are that major international events identified in are positively statistically significantly correlated at the 5% level to the implementation of biodiversity (p-value = 0.011) and climate change (p-value = 0.012) policies.
4. Discussion
The OECD/EEA Database provided sufficient data to develop four policy indicators for biodiversity suggested by Van Winkle et al. (Citation2015) and an additional two indicators. Indicator 5 above, suggested by Van Winkle et al.’s (Citation2015) could not be derived from the database. The six indicators constructed provide preliminary operational indicators to monitor the CBD targets as well as supporting the IPBES goal to catalogue biodiversity policies and to leverage information flows to generate more effective pathways for biodiversity policy (Hill et al. Citation2015).
We consider the extent to which the indicators provide relevant guidance to policymakers. In particular, we are interested whether or not the indicators meet AHTEG goals and can be used for benchmarking. In their critical review of benchmarking as a policy learning tool, Dominique et al. (Citation2013) find that international benchmarking is often not used for policy learning but rather to: (1) drive political agendas, e.g., to support favoured policy reforms and investments; (2) claim context prevents international learning, e.g., through difficulties in transferability to other contexts and (3) sideline other types of policy learning, e.g., learning through failure and learning through local experimentation. We address these claims in each of our indicators.
Indicators 1–3 provide data on the AHTEG’s identification and establishment attributes, but they provide no information on the strengthening and assessment attributes. The indicators may provide opportunities for policy learning and can perhaps incentivise, policy makers by providing evidence of increased policy diversification and implementation by most OECD country governments over six decades. The proliferation of different types of instruments suggests nations are learning from each other. Furthermore, the comparison of biodiversity and climate change polices is suggestive of policy design and implementation learning between global challenges. Information on policy failure is not captured in the OECD/EEA Database and as such there is no information on learning through failed policies.
Indicator 4 on revenue generated by positive incentives for biodiversity over time is not straightforwardly an unbiased and transferable indicator. Biodiversity policies can be either revenue-raising, i.e., a tax or fee, or non-revenue-raising, i.e., a voluntary standard, and without data on the effectiveness of each policy at limiting biodiversity losses, we cannot say that increased revenues over time is evidence of effective policy. Why? Increased revenues may indicate that the biodiversity policy is widely implemented and generating incentives for changed behaviour, i.e., effective policy or that harmful activities are increasing, i.e., ineffective policy, and conversely, declining revenues might indicate an overall reduction in (harmful) activities, i.e., effective policy. In terms of policy learning, particularly to drive political agendas, this indicator might encourage greater implementation as policymakers could claim that revenues raised offset investments in biodiversity conservation, i.e., that policy can be revenue neutral.
Indicator 6, which tracks jurisdictional scale, provides information about the AHTEG’s identification, establishment and strengthening attributes. How? Over time there has been a shift to policy implementation at the national or supranational (e.g., European Union) level which forces national government’s compliance. However, in terms of policy learning, such initiatives may stifle learning through experimentation and transferability. Policy implementation at local jurisdictional scales maybe associated with more learning through experimentation/pilot programmes (Dominique et al. Citation2013) or it could be the outcome of policy obstruction at the national level that is circumvented by state level action, e.g., the US’s bottom-up climate change mitigation and adaptation policies (Lutsey & Sperling Citation2008). More research is needed to understand the implications of jurisdiction on policy learning. Finally, Indicator 7, which tracks policy revisions, provides data on the identification, establishment and strengthening attributes. We suggest that policy revisions might be the outcome of lessons learned on policy effectiveness and that the proliferation of revisions per se might be an indication to policymakers that it can be more efficient, less costly and politically expedient to revise an existing measure than to put a new one in place. Again more research is needed to understand the growth in policy revisions and on the links to policy learning.
The OECD/EEA Database provides (1) relevant information to construct six indicators that address two or more AHTEG attributes but not all four attributes and (2) no information to address the AHTEG assessment attribute. We address each point in turn. In practice, as no indicator uniquely covers any AHTEG attribute, the indicator user will need to decide which indicator, or combination of indicators, is appropriate for each use. For instance, if a policymaker were interested in which types of policies to develop and implement, in practice they might review Indicators 1–3, whereas, a policymaker concerned about how to strengthen policy responses might review Indicators 6 and 7. A policymaker interested in the history of biodiversity policy might visually inspect , and using their knowledge, reflect on how external events have led to policy development, implementation and experimentation.
The weaknesses identified in this review might inspire modifications to the OECD/EEA Database in order to provide better information for benchmarking and to satisfy the AHTEG indicator attributes. To guide our suggestions for improvements, we reviewed other databases and the literature. For instance, the International Energy Agency’s (IEA) Policies and Measures Databases provides policy response information on energy-related policy and measures in IEA countries, and some non-IEA countries. Each record comprises similar information to the OECD/EEA Database but with some additional elements which if adopted could be used to support the indicators we constructed. For example, information on current policy status, e.g., in force, ended, superseded, would provide additional data to Indicator 7 and may point to policies that were found to be ineffective. In a similar vein, data on policies that have ended could provide additional information for Indicators 1–3 by identifying the types of policies or sectors that no longer exist/are no longer covered. The IEA Database also provides information on the policy target, e.g., overarching framework, strategic plan, multi-/cross-sectoral, and on the theme, e.g., energy efficiency, that could provide additional policy data to augment Indicators 1–3 and Indicator 6. The literature provides other ideas for integrating other types of data to improve the indicators. For example, evidence of regional cooperation and integrated planning (see McGeoch et al. Citation2010; Ramsar Convention Secretariat Citation2010; Waldron et al. Citation2013), e.g., regular exchange of data, cooperation on scientific and technical matters, evidence of national biodiversity strategy development (Butchart et al. Citation2010) and development of cooperative planning and jurisdictional and institutional coordination within a nation to reflect biodiversity as a cross-cutting issue (see Ramsar Convention Secretariat Citation2010) could be used to improve Indicator 6 and in so doing address the AHTEG strengthening attribute.
Further research is needed to develop indicators on policy effectiveness. The indicators constructed here provide no information on the effectiveness of policy responses, because the indicators are on policy responses per se and not the outcomes of policies in delivering biodiversity gains or climate change mitigation. In developing an indicator for the AHTEG assessment attribute, we might look to Clough’s (Citation2000) three practicality tests for individual policies and a combination of polices: effectiveness at achieving biodiversity objectives; efficiency in terms of costs per unit of achievement and administrative feasibility. In terms of data, we suggest that it might be possible to combine indicators. The indicators suggested by Van Winkle et al. (Citation2015) and implemented here concern positive policy responses; a stated limitation is satisfying the assessment attribute, i.e., assessing the link between the implemented policy and the policy outcomes. The 2014 EEA indicators designed to support environmental policymaking comprise a total 137 indicators, of which 27 are for biodiversity and 46 for climate change. The indicators are designated by focus (driving force, pressure, state, impact and response) and type (descriptive, performance, efficiency, policy effectiveness and total welfare). Of the EEA biodiversity/climate change indicators six/zero are designated as response indicators, respectively,Footnote7 and all six biodiversity response indicators are designated as descriptive (EEA Citation2014). Whilst neither the OECD/EEA Database nor the EEA Database provides all the information required by policymakers, an advantage of these databases is they are both updated and maintained. A way forward, we suggest is to link our six policy response indicators with the EEA’s eleven ‘pressure’ and ten ‘state’ biodiversity indicators to test relationships between single and in-combination policy responses indicators and state and pressure biodiversity indicators. In this way, improvements over time in states and reductions in pressures might provide information on policy effectiveness.
5. Conclusions
Making choices between policy instruments is an essential part of policymaking. Benchmarking exercises can provide impetus for policymakers to design and implement policy responses and assist policymakers in these choices through the provision of information on current international utilisation, as well as the evolution in the implementation of different policy instruments. In this paper, we utilised the OECD/EEA Database to generate four out of the five indicators suggested in Van Winkle et al. (Citation2015). Furthermore, we constructed two additional indicators that not only provide information on the AHTEG’s identification and establishment attributes but also provide information on the strengthening attribute. We also compared two policy challenges, biodiversity and climate change.
Working with an existing database has the advantage that data have already been collected and therefore could save considerable time and expense. We have shown that the OECD/EEA Database can be used to generate indicators to assess the implementation of biodiversity policy and that these might support CBD targets. The six indicators constructed provide evidence that many OECD, accession and EEA countries have implemented (and reported) positive policies in biodiversity and climate change policy realms. We note that environmental subsidies and taxes are the dominant policy but that other more market-based instruments and voluntary approaches have also been implemented and that policy at the national and federal jurisdictional scales has dominated recent policies and that there has been a trend towards policy revision.
Our study shows the potential of the OECD/EEA Database to catalogue policies and to inform the design of operational policy response indicator(s) for biodiversity to benchmark progress towards the Aichi Target 3. However, although the OECD/EEA Database is regularly updated, it was designed before international focus on biodiversity and thus is somewhat cumbersome for this purpose. Parallel with another goal of IPBES ‘to promote and catalyse further development’ of tools and methodologies the OECD/EEA Database could be modified to record biodiversity and ecosystem service-focussed policies. Another gap we identified is the dearth of information on the effectiveness and efficiency of existing instruments and their transferability. In the future, the development of a set of new or linked indicators to assess the effectiveness of biodiversity and climate policy could provide a step to achieving actionable change.
Acknowledgements
Thanks to CSIRO Ecosystem Sciences Division for sponsoring this research and the associated internship. Thanks also to Javi Navarro Garcia, CSIRO for assistance with the database. Thanks also to Dr Katia Karousakis and Christina Van Winkle, OECD.
Disclosure statement
No potential conflict of interest was reported by the authors.
Additional information
Funding
Notes
1. Where, biological diversity according to Article 2 of the Rio de Janeiro Convention on Biodiversity means ‘the variability among living organisms from all sources including, inter alia, terrestrial, marine and other aquatic ecosystems and the ecological complexes of which they are part, this includes diversity within species, between species and of ecosystems’.
2. See the Press Release from COP-10 at http://www.cbd.int/doc/press/2010/pr-2010-10-29-cop-10-en.pdf
5. We were sent the database, however, it can also be accessed here: http://www2.oecd.org/ecoinst/queries/
6. See, Objective 3 Deliverable 4(c), http://www.ipbes.net/work-programme/objective-4.html
7. They are designated areas, nationally designated protected areas, sites designated under the EU Habitats and Birds directives, patent applications based on genetic resources, financing biodiversity management and public awareness. The other categories of indicators are driving force, pressure, state and impact.
References
- Bräuer I, Müssner R, Marsden K, Oosterhuis F, Rayment M, Miller C, Dodoková A. 2006. The use of market incentives to preserve biodiversity. Final Report. A project under the Framework contract for economic analysis ENV.G.1/FRA/2004/0081. Canberra. Available from: http://www.deh.gov.au/soe/2006/emerging/indicators/index.html
- Butchart SHM, Walpole M, Collen B, Van Strien A, Scharlemann JPW, Almond REA, Baillie JEM, Bomhard B, Brown C, Bruno J, et al. 2010. Global biodiversity: indicators of recent declines. Sciences. 328:1164–1168.
- Carson R. 1962. Silent spring. New York (NY): Houghton Mifflin.
- Clough P. 2000. Encouraging private biodiversity - incentives for biodiversity conservation on private land. Treasury Working Paper Series 00/25. Wellington: New Zealand Treasury.
- Dominique KC, Malik AA, Remoquillo-Jenni V. 2013. International benchmarking: politics and policy. Sci Public Policy. 40:504–513.
- EEA. 2014. Digest of EEA indicators 2014. Luxembourg: European Environment Agency. (EEA Technical report No 8/2014). ISSN 1725-2237.
- Hampe A, Petit RJ. 2005. Conserving biodiversity under climate change: the rear edge matters. Ecol Lett. 8:461–467.
- Heller NE, Zavaleta ES. 2009. Biodiversity management in the face of climate change: a review of 22 years of recommendations. Biol Conserv. 142:14–32.
- Hill R, Dyer GA, Lozada-Ellison L-M, Gimona A, Martin-Ortega J, Munoz-Rojas J, Gordon IJ. 2015. A social-ecological systems analysis of impediments to delivery of the Aichi 2020 targets and potentially more effective pathways to the conservation of biodiversity. Glob Environ Chang. 34:22–34.
- Lutsey N, Sperling D. 2008. America’s bottom-up climate change mitigation policy. Energy Policy. 36:673–685.
- McGeoch MA, Butchart SHM, Spear D, Marais E, Kleynhans EJ, Symes A, Chanson J, Hoffmann M. 2010. Global indicators of biological invasion: species numbers, biodiversity impact and policy responses. Divers Distributions. 16:95–108.
- [MEA] Millennium Ecosystem Assessment. 2005. Ecosystems and human well-being: policy responses. Washington (DC): Island Press. Chapter 5, Biodiversity; p. 132.
- OECD. 1993. OECD core set of indicators for environmental performance reviews. Paris: OECD. (OECD Environment Monographs No. 83).
- OECD. 2003. OECD environmental indicators: development, measurement and use. OECD Reference Paper. Paris: Environment and Performance and Information Division, OECD Environment Directorate.
- Ramsar Convention Secretariat. 2010. Wise use of wetlands: concepts and approaches for the wise use of wetlands. In: Ramsar handbooks for the wise use of wetlands. 4th ed., vol. 1. Gland: Ramsar Convention Secretariat.
- Söderholm P. 2006. Environmental taxation in the natural resource extraction sector: Is it a good idea? Environ Policy Governance. 16:232–245.
- TEEB. 2009. TEEB climate issues update. Geneva: TEEB. TEEB is hosted by the United Nations environment programme and supported by the European Commission, the German Federal environment ministry and the UK government’s Department for environment, Food and rural Affairs.
- UK National Ecosystem Assessment. 2011. The UK national ecosystem assessment: synthesis of the key findings. Cambridge (UK): United Nations Environment Programme, World Conservation Management Centre.
- Van Winkle C, Karousakis K, Bark R, van der Heide M. 2015. Biodiversity policy response indicators. Paris: OECD. (OECD Environment Working Papers, No. 90). doi:10.1787/5jrxd8j24fbv-en.
- Waldron A, Mooers AO, Miller DC, Nibbelink N, Redding D, Kuhn TS, Roberts JT, Gittlem JL. 2013. Targeting global conservation funding to limit immediate biodiversity declines. PNAS. 110:12144–12148.