
ABSTRACT
Most ecosystem services that are not traded on markets contribute to human welfare; however, these services are often undervalued due to the fact that their economic value is not well known. Accounting for the value of these services can help in making decisions that enable efficient use of environmental resources. This paper reports on a study of recreational trips to nature areas, the economic value of recreation in nature and factors influencing such trips. It also aimed to explore the possibilities of designing a nature-based recreation management strategy that could meet societal preferences and demands for recreation amenities. Data were obtained from a survey that involved Swedish residents who were randomly selected from a national register and were analysed using a negative binomial regression model. The results showed that the average frequency of trips to nature areas was 80 trips annually and the average travel cost for a trip to these areas was 117 SEK (16 USD). Forest-dominated areas were the most frequently visited and mountainous areas the least. Trips to mountain-dominated areas had the highest travel cost, followed by water-dominated areas, with forest areas the lowest. The consumer surplus for a trip to a nature area was 526 SEK (72 USD). The frequency of trips to nature areas was influenced by factors such as travel cost, type of nature area, travel time to and time spent at the nature area, recreational activity, income and dwelling place. If the aim of the Swedish policy on outdoor recreation (i.e. Right to Public Access) is to increase the frequency of trips to nature areas, facilities that could help reduce travel costs to these areas should be provided. Nature areas should be managed towards meeting societal preferences and demands for recreation. The findings could assist ecosystem managers in land use planning processes and in designing a sustainable nature-based recreation strategy.
EDITED BY Bas Amelung
1. Introduction
Although ecosystems provide a range of services that are important for human welfare, ecosystem degradation and loss of biodiversity threaten the ability of ecosystems to continuously supply these services (MEA Citation2005; TEEB Foundations Citation2010; de Groot et al. Citation2012). In order to develop an effective ecosystem management strategy, it is important to have an understanding of the supply and demand sides of ecosystem services (ESs), that is, biophysical and sociocultural and economic values (Chan et al. Citation2012; Martin-Lopez et al. Citation2014). The economic value of ESs encompasses the direct and indirect contributions of these services to human welfare, which are reflected in people’s preferences for ES (Bockstael & Freeman Citation2005). As preferences are often influenced by non-economic factors such as ethical and moral motivations, sociocultural values tend to influence economic values (Martin-Lopez et al. Citation2007; Kumar & Kumar Citation2008). Furthermore, an ecosystem’s capacity to supply services determines the range of potential uses of ESs, and thus has an influence on the sociocultural and monetary values of ES (Martin-Lopez et al. Citation2014). This highlights the need to incorporate the supply and demand sides of an ES into ecosystem management decisions.
The importance of ecosystems to societal welfare has various dimensions, e.g. biophysical, sociocultural and economic (de Groot et al. Citation2010). However, expressing the value of an ES in monetary units plays an important role in informing policymakers about the relative importance of ES (de Groot et al. Citation2012). Ecosystems provide a mixture of services that are traded on markets such as timber and fish (market services) as well as services that cannot be sold in markets (non-market services) such as water and air purification and recreation experience associated with free access to recreation site, which is the focus of this study. The economic value of market ESs is well known and is reflected in market prices whereas the economic value of non-market ESs is not well known and research is often required to estimate their value (Garrod & Willis Citation1999). Most non-market ESs are public goods, that is, once produced, people cannot be excluded from using them (i.e. they are non-excludable) and the use of a service by an individual does not reduce its availability to other people, that is, there is non-rivalry (Tietenberg & Lewis Citation2010). Due to the non-excludability and non-rivalry characteristics of public goods, it is practically impossible to charge or compensate people for the use of these goods. This study focuses on the economic value of recreation experiences in Swedish nature areas (i.e. locations that provide people with opportunities to explore different types of outdoor recreation activities). Sweden has a policy of ‘Right to Public Access’ to nature areas for outdoor recreation (Swedish Environmental Protection Agency Citation2011), which provides people with free access to nature and makes recreational experiences in nature a non-market ES and a public good. Without assigning monetary values to non-market ESs, the contributions of these services to human welfare may be undervalued (Costanza et al. Citation1997; Carpenter et al. Citation2006; Fisher et al. Citation2008). Accounting for the economic value of non-market ESs can help in making decisions regarding allocating resources between competing uses and enable efficient use of environmental resources (Carpenter et al. Citation2009; Crossman & Bryan Citation2009; Daily et al. Citation2009; TEEB in Policy Citation2011).
Nature-based recreation (i.e. recreation experiences in nature areas) plays an important role in Swedish society (Fredman et al. Citation2012; Ezebilo et al. Citation2015). It provides people with opportunities to satisfy their recreation needs as well as maintain natural, cultural and historical resources in nature (Swedish Environmental Protection Agency Citation2011). It also has the potential to promote public health by encouraging physical activities and mental well-being. In trying to promote the participation of Swedish residents in recreation activities, it is important to have greater understanding of factors that could influence people’s behaviour in relation to trips to recreation sites. Several factors have been identified in the literature that influence trips to recreation sites. These include travel cost, income and age (Lundevaller Citation2009; Norman et al. Citation2010), education and recreation activities (Shrestha et al. Citation2007; Ovaskainen et al. Citation2012; Cho et al. Citation2014), travel time (Loomis et al. Citation2000; Shrestha et al. Citation2002; Fezzi et al. Citation2014; Wolff Citation2014), time spent at recreation site (Shrestha et al. Citation2002; Norman et al. Citation2010), gender and transport mode (Loomis et al. Citation2000; Norman et al. Citation2010), home location and ethnicity (Zawacki et al. Citation2000; Bennear et al. Citation2005), category of visitors (Ovaskainen et al. Citation2012) and the availability of alternative nature area (Neuvonen et al. Citation2007; Edwards et al. Citation2011). However, international policy commitments to the provision of ESs have generated a debate on the need for economic evaluation of ESs and the integration of the findings into decision-making (MEA Citation2005; Daily et al. Citation2009; Goldstein et al. Citation2012). Most of the previously published papers on the economic value of recreation have focused on a few recreation activities in one environment at a local level (e.g. Norman et al. Citation2010; Cho et al. Citation2014; Logar et al. Citation2014). This makes it rather difficult to use the findings in drawing general conclusions about the economic value of recreation in a country and the findings are rarely incorporated into ecosystem management decisions. In order to address some of these shortcomings, this study focuses on recreation in several ecosystems, several activities and different natural environments on a national scale. The findings can provide us with a clearer picture about the economic value of recreation for a country and can be integrated into ecosystem management decisions.
The economic value of recreation in nature areas can be used as justification for funding initiatives aimed at managing nature towards the provision of recreation opportunities and supporting the policy of ‘Right to Public Access’ in Sweden. The value represents the loss to society that policymakers should take into account if public access to nature is banned (Simos et al. Citation2013). In order to design a sound policy on the management of nature areas for recreation, knowledge of the costs and benefits associated with maintaining these areas is crucial (Martinez-Espineira & Amoako-Tuffour Citation2008). The use of nature areas for recreation could lead to ecological changes in these areas. For this reason, recreation managers are often charged with reducing the changes and at the same time, providing opportunities for recreation experiences (Hammitt et al. Citation2015; D’Antonio & Monz Citation2016). Among the several factors that influence ecological changes are nature type, visitor use levels and their behaviour (Pickering Citation2010; Monz et al. Citation2013; Hammitt et al. Citation2015). Recreation managers could apply various actions to reduce the impacts of these factors on nature: for example, limiting use, hardening the environment against such impacts, directing visitors to desirable locations and encouraging minimum-impact visitor behaviour (Cole Citation2008). The availability of nature areas and amenities for recreation has positive impacts on people’s participation in recreational activities (French et al. Citation2001). Thus, a policy that favours an increase in government spending on amenities that provide opportunities for recreation is likely to promote participation in recreation. It is important for the policy to provide incentives that take into account individual preferences and the different restrictions they face in participating in recreation (Humphreys & Ruseski Citation2007).
Governmental investigations on nature for recreation in Sweden have emphasized the importance of accessible nature and facilities for recreation close to home (Hultman et al. Citation2000). Findings from various studies on outdoor recreation in Sweden have shown that distance from home to nature area limits accessibility to the area and that Swedish residents would pay to avoid an increase in the distance to nature for recreation (Kardell & Lindhagen Citation1995; Lindhagen Citation1996; Hörnsten & Fredman Citation2000). The focus on accessible nature for recreation has increased in Sweden as the process of urbanization leads to an increased distance to nature for many people (Ode & Fry Citation2006; Lundevaller Citation2009). Therefore, the supply of accessible nature for recreation, especially in urban areas, has become an issue for land use planning. The goal of the policy on outdoor recreation (i.e. Right to Public Access) in Sweden is to promote public participation in recreational activities (Emmelin et al. Citation2010). However, the distance from home to nature area and consequently the travel cost often restricts access to nature. Furthermore, Sweden has several nature types and Swedish residents are heterogeneous, which implies that their frequency of trips to nature might vary in relation to nature types, travel cost, distance of their home to nature and socio-economic factors such as income, age, gender and educational level.
Using the case of Sweden, the aim of this study was to examine recreational trip frequency to nature areas in relation to travel cost, nature types, distance of home to nature and socio-economic factors as well as estimating the economic value of recreation. The possibilities of designing a nature-based recreation management strategy that could help meet societal preferences and demands for recreational amenities are discussed.
This study involves Swedish residents who have visited nature areas for recreation. It is hoped that the findings from the study will provide a greater understanding of the distribution of benefits and costs associated with recreation in Sweden to help support the need for the government to sustain funding for amenities that provide opportunities for recreation. It will also provide us with a greater understanding of possible ways of promoting the participation of Swedish residents in recreational activities and a strategy that recreation managers could use in reducing the negative impacts of recreation on nature.
2. Conceptual framework
The economic theory of individual preferences and demand assumes that consumers are aware of the utility (i.e. satisfaction) they get from goods and services (Gravelle & Rees Citation2004). If a consumer prefers one consumption bundle over another bundle, the former consumption bundle is the utility-maximizing bundle to the consumer (Ezebilo et al. Citation2012). In the so-called perfect market, consumers choose goods that maximize their utility subject to a budget constraint. The higher the price of a good, the lower the quantity of that good consumed (Varian Citation2010). In Sweden, participation in recreation activities is often influenced by accessibility and the costs associated with travelling to recreation areas (Ward & Beal Citation2000; Edwards et al. Citation2011).
Travel cost demand for recreation is derived from the indirect utility function (i.e. the maximum satisfaction that a visitor gets from trips to recreation sites when he or she is faced with a price and an amount of income) of visitors to a recreation site. This reflects visitors’ preferences in terms of numbers of trips to a recreation site over a period of time. The main assumption of the travel cost method (TCM) is that the frequency of trips to a recreation site decreases as the travel distance increases (Bockstael Citation2007). Using the utility maximization framework, an individual visitor’s preferences for recreation can be represented by the indirect utility function as:
where u is the utility that the visitor gets from consuming two different goods, R is the number of trips to a recreation site, q is the quantity of all other goods consumed, s is the vector of recreation site characteristics, a is the personal attributes of the visitor, c is the travel cost associated with trips to recreation sites, z is the composite price of all other goods and y is income. From Equation (1), the Marshallian demand (i.e. the relationship between the price of a trip to a recreation site and the number of trips to the site) for recreation is:
Integrating the Marshallian demand function and estimating the area below the demand curve and above the price line gives the consumer surplus (CS; Gravelle & Rees Citation2004). This is the difference between the maximum amount a visitor would be willing to pay for a trip to a recreation site and the cost for a trip to the site. The CS represents the economic value of recreation to the visitor. The value that people put on recreation activity provides ecosystem managers with important information on the economic value of resources at recreation sites, which cannot be revealed in markets.
This study focuses on recreation close to home, thus the length of stay at recreation sites was restricted to ≤24 hours and the distance from home to the site limited to ≤80 km. The delimitation of length of stay was used in order to reflect the official definition of recreation (i.e. a visit to a recreation site for at most a 1-day stay). It was also used to exclude tourism, that is, visits to a recreation site involving at least one overnight stay (World Tourism Organization Citation2008). It is important to differentiate recreation close to home from tourism because they often compete for the same resources such as money and time (Tangeland et al. Citation2013). The diameter of an average metropolitan city in Sweden is about 40 km (Naturvårdverket Citation2009); however, some urban residents often travel to rural areas for recreation. Thus, in this study, the delimitation of distance (i.e. 80 km) was used in order to include both recreation sites in urban areas and sites that urban residents visit in rural areas.
Travel cost often includes the opportunity cost of travel time (Fezzi et al. Citation2014) using a fraction of the wage rate such as a quarter or a half (Bowker et al. Citation1996; Zawacki et al. Citation2000). However, in this study, travel cost and travel time were treated separately in order to allow us to estimate the opportunity cost of travel time within the model (Loomis & Walsh Citation1997; Shrestha et al. Citation2002). Because the speed that one chooses to travel at influences travel time (Wolff Citation2014), various speeds have been used in previously published papers such as 80 km/hour (Boxall et al. Citation1996; Zawacki et al. Citation2000), 50 km/hour (Englin et al. Citation1996), 60 km/hour (Layman et al. Citation1996) and 45 km/hour (Rockel & Kealy Citation1991). In this study, it was assumed that the travel speed is 50 km/hour. This travel speed reflects the average recommended speed in and around densely populated cities in Sweden. However, it is important to note that the 50 km/hour is based on a conservative estimate.
2.1. Revealed preference methods
Revealed preference methods are non-market valuation methods in which consumer purchasing habits are used to estimate the use values of non-market ES (Champ et al. Citation2003). The most commonly used revealed preference methods are the hedonic pricing method (HPM) and the TCM. The HPM is often used for estimating the economic values of ES that influence housing prices. The TCM is based on the assumption that costs which people incur during their trip to a recreation site represent a proxy of the value of the site (Haab Citation2002; Bockstael Citation2007). The TCM is often used for estimating the economic value (i.e. use value) of nature used for recreation. Due to the fact that we want to understand actual consumer behaviour with regard to recreational trips and the fact that this study focuses mainly on nature used for recreation, the TCM was applied. The TCM can be classified into the following:
The zoned travel cost method (ZTCM) involves using survey data from people living in predefined zones based on different distances from their homes to a recreation site. The cost of trips from all points in a given zone is assumed to be constant and the values that people hold for the site are elicited based on the predefined zones they belong to. Because the ZTCM recreational values are elicited for each of the predefined zones, important information associated with individual consumer behaviours is not considered.
The random utility model (RUM) is a combination of the TCM with the contingent valuation method (Mitchell & Carson Citation1989) in exploring visitors’ decisions to participate in a recreation activity and the number of trips to a recreation site. The RUM is often used to estimate benefits associated with specific site characteristics and quality changes as well as when there are many substitute sites.
The individual travel cost method (ITCM) entails using survey data from individual trips to a recreation site to elicit the value of the site. It provides more information about individual consumer behaviours and gives more precise results than the ZTCM. As we wanted to obtain a lot of information about individual consumer behaviours and the characteristics of all the recreation sites in Sweden that were considered, the ITCM was used in this study. In the rest of the paper, we will use ‘TCM’ as shorthand for ‘ITCM’.
The conventional TCM model is based on the premise that it costs visitors to a recreational site more money as the distance from their home to the site increases (Bockstael Citation2007). The visitor chooses the optimum number of trips subject to a cost constraint. Furthermore, it assumes that the number of trips to a recreation site is a real number and that there is only one site (Douglas & Taylor Citation1999). To loosen the latter constraint, a range of previous studies (e.g. Edwards et al. Citation2011; Cho et al. Citation2014) has treated sets of ‘similar’ sites taken together as one ‘typical’ site. This is known as the ‘typical site approach’. In a Swedish context, Norman et al. (Citation2010) applied this approach to recreation in forests in Southern Sweden. On closer inspection, however, Norman et al. (Citation2010) consider many different nature types, not only forests, even though Southern Sweden is dominated by forest. This study makes the variety of nature types in a forest-dominated country more explicit by treating the whole of Sweden as one site, encompassing multiple nature types. Our flexible interpretation of the TCM approach resembles that of other studies. For example, in an Irish study, Mayor et al. (Citation2007) used a similar method to model the recreational value of Irish forests; Willis (Citation1991) applied a similar method to model the open-access recreation benefits of forests in Great Britain; and Offenbach and Goodwin (Citation1994) modelled the demand for hunting trips in Kansas.
3. Materials and methods
3.1. The study area
Sweden is located in Northern Europe and covers a land area of approximately 449,964 km2, of which 70% consists of forests (Swedish Forest Agency Citation2013). About 50 mammal and bird species are game species in Sweden (Danell et al. Citation2010). Of these species, moose is the most important in terms of the number of people hunting it and the number of days devoted to hunting (Mattsson et al. Citation2014). Other game species hunted in Sweden include reindeer, roe deer, wolves, fox, brown bear and lynx. Lakes cover 9% of the land area of Sweden. Vänern and Vättern are the country’s largest lakes, with Vänern being the third largest lake in Europe (Sweden Official Site Citation2015).
In Sweden, there is a strong tradition of using nature for recreation and caring for nature. The works of Carl Linnaeus (i.e. the foremost Swedish botanist) contributed to making Sweden a nature-conscious country (Sweden Official Site Citation2015).
Although recreational fishing is popular in Sweden, a licence is required for fishing. However, people who fish with hand gear in public waters do not need a licence. According to fishing regulations, it is often prohibited to fish about 100 m from fish farms or use stationary fishing equipment. In Sweden, dogs are one of the most important pets. According to the regulations on animal welfare, dog owners should walk their dogs every 6 hours and some dog owners use nature for this activity (Svenska Kennelklubben Citation2015). While walking dogs in nature helps the dogs to be physically fit, it also encourages the owners, especially the elderly, to engage in physical exercise to keep fit too. There have been some cases of dog attacks on people, especially children playing on recreation sites, in some European countries. This incidence is rare in Sweden, but it is important to develop a strategy that reduces human–animal conflict on recreation sites. There are various nature organizations in Sweden and the most popular ones include the Swedish Society for Nature Conservation and the Association for the Promotion of Outdoor Life. These nature organizations help in influencing government nature conservation policy and in motivating people to engage in nature recreation activities.
3.2. Survey design and data collection
The data for this study were collected by means of mail questionnaire in which the questions were designed through focus group meetings and a pretest survey. The focus group comprised 20 scientists whose works were related to recreation and those that did not work on recreation-related issues. The questions that were developed from the first focus group meeting were drafted and sent to members of the group for their comments. The draft was modified and subsequent drafts were sent to the group twice and a final questionnaire draft was produced. To validate the draft, a pretest survey was conducted with 50 people who were randomly selected from the Swedish telephone directory in the summer of 2007. Some concerns raised by these people led to modification of the draft and a final version of the questionnaire was produced.
For the main survey, the questionnaire was sent to 4700 people aged 18–75 years who were randomly selected from the Swedish national register containing all residents of Sweden (i.e. the general population). The survey was conducted from October 2007 to January 2008. The questionnaire consisted of 55 questions and 14 of the questions that are more relevant to the subject of the paper were used.
After explaining the aim of the survey and the confidentiality of their responses, the respondents were asked a series of questions (Box 1.)
Box 1. Questions relevant to this study that were presented to the respondents
Gender.
Educational level.
Age.
Disposable income.
Location of home (urban/rural).
Whether the respondent had visited a nature area for recreation in the last 12 months (i.e. from October 2007).
The type of nature area that the respondent mostly visited in the last 12 months.
Frequency of visits to the nature area: (a) Less than four times per year (b) four to eight times per year (c) one to three times each month (d) one to three times each week (e) four to six times each week (f) 365 times in the year.
Whether the respondent owns a dog.
Whether the respondent mainly engages in fishing.
The distance of the respondent’s home to the nature area she or he used for recreation.
Length of time that the respondent spent at the nature area she or he visited mostly.
Average cost associated with the respondent’s trips to nature area in the last 12 months.
Whether the respondent belonged to an outdoor recreation organization.
Of the 4700 people who were selected for the survey 1792 completed and returned the questionnaires after two reminders. This study is based on responses only from respondents who had taken trips to nature areas for recreation. This is because this study focuses on the use values of nature and the TCM can only be used to capture use values.
3.3. The econometric model
Due to the fact that the frequency of trips to a recreation site, which is the dependent variable in this study, is count data the Poisson regression model (Cameron & Trivedi Citation1986; Greene Citation2012) was first considered for modelling the data. The Poisson model has a restrictive assumption known as the equidispersion, that is, the mean of the dependent variable equals its variance. However, when the variance is higher than the mean it leads to a problem of overdispersion and this results in biased parameter estimates and standard errors (Hilbe Citation2011; Ovaskainen et al. Citation2012). To explore whether the Poisson model meets the equidispersion assumption, an overdispersion test based on a regression approach (Cameron & Trivedi Citation1990) was applied. The overdispersion test showed a test statistic value of 5.95–7.77, which exceeds the critical value of one degree of freedom on the chi-square table at the 0.05 statistical significance level (i.e. 3.84). The null hypothesis of equidispersion was rejected, that is, overdispersion is present in the data generated from this study. This revealed that the equidispersion assumption required for using the Poisson regression model was not met. As an alternative, a less restrictive model known as the negative binomial regression model (Hilbe Citation2011; Greene Citation2012), which relaxes the equidispersion assumption, was used. The probability of negative binomial distribution is:
where (.) is the probability function for r (i.e. gamma function),
is the overdispersion parameter and
is the heterogeneity parameter.
The standard negative binomial model (non-truncated) often has convergence problems (Greene Citation2012). To explore whether convergence problems exist in the estimated model, log likelihood ratio tests were conducted. The log likelihood ratio test for the existence of convergence problem in the estimated negative binomial regression model showed a test statistic value of 32.72, which is greater than the critical value to of one degree of freedom on the chi-square table at the 0.05 statistical significance level (i.e. 3.84), thus the null hypothesis (i.e. the existence of convergence problem) was also rejected. This indicates that there is no convergence problem in the estimated model. Thus, the standard negative binomial regression (non-truncated) was used in the continued analysis of factors influencing the frequency of trips to recreation sites.
To explore multicollinearity in the independent variables, the variance inflation factor (VIF) of the variables was estimated. The VIF of each of the independent variables that were included in the estimated model did not exceed 1.82. This indicates that multicollinearity is not a serious problem (Chatterjee & Price Citation1991) in the estimated model. The negative binomial regression model was estimated using the LIMDEP NLOGIT version 4.0.1 statistical package (Econometric Software Inc Citation2007) and the effects of the respondent attributes on the frequency of trips to nature areas were analysed. The negative binomial model was estimated as:
where is the vector of parameters to be estimated, TRIP is the frequency of trips to nature areas, TC is travel cost, T_time is the opportunity cost of travel time, INCOME is disposable income, DURATION is the length of time spent in nature, AGE is the age of the respondent, MEMBER is membership of a recreation organization, URBAN is dwelling place, GENDER is the respondent’s gender, EDUC is educational level, FISH is fishing in nature, DOG is ownership of a dog, Forest is forest-dominated area, Water is water-dominated area, Mountain is mountainous area, Grass is grass-dominated area, Meadow is area dominated by grasses and other non-woody plants, park is nature park and
is the vector of random error term, which is assumed to be independently and identically distributed. The travel time to a recreation site was treated separately in the estimated negative binomial model in order to estimate the opportunity cost of travel time (see, e.g. Loomis & Walsh Citation1997). The opportunity cost of travel time (T_time) was calculated by multiplying the round trip time by one-quarter of the wage rate of the respondent. The wage rate was calculated by dividing the respondent’s annual income by the average annual working hours (i.e. 2080 hours). Using the negative binomial regression model (i.e. a count data model), the average individual CS per trip to a recreation site can be obtained from the slope of demand function (i.e. coefficient of the estimated TC). This is done by calculating the negative reciprocal of the estimated TC coefficient (Creel & Loomis Citation1990; Heberling & Templeton Citation2009).
Trip frequencies reported by the respondents were categorical variables. In order to obtain a point estimate of the frequencies, the variables were transformed into discrete count variables and the midpoint of the interval was taken. To obtain the point estimate of trip frequency for respondents who had taken fewer than four trips to recreation sites in the past 12 months, the trips were expressed as 1, 2, 3 and the midpoint value was taken (i.e. two trips per year). This corresponds to the average trip frequency for all respondents who had taken fewer than four trips. For respondents who had four to eight trips (4, 5, 6, 7, 8) per year, the trip frequency is six trips per year. For respondents who had one to three trips (1, 2, 3) per month, the trip frequency is two trips each month, which corresponds to 24 trips per year (i.e. two trips multiplied by 12 months). For respondents who had one to three trips (1, 2, 3) each week, the trip frequency is two trips per week and this corresponds to 104 trips for 52 weeks (i.e. 1 year). For respondents who had four to six trips (4, 5, 6) each week, the trip frequency each week is five trips, which corresponds to 260 trips in 52 weeks (i.e. 1 year). The last group of respondents had 365 trips to recreation sites in the past 12 months. The trip frequencies used in the following analyses were 2, 6, 24, 104, 260 and 365 trips, respectively.
4. Results
Of the 1792 respondents to the questionnaire used in this study, approximately 45% (800) visited nature areas for recreation within 80 km of their homes for a stay of ≤ 24 hours. Approximately 74% (591) of the 800 respondents answered all questions associated with the variables used in the present analyses. The results showed that on average, the respondents had approximately 80 trips to nature areas in the last 12 months (). Aggregating the trips over the 591 respondents, the total number of trips to nature areas each year is 47,280. The respondents who lived in rural areas took an average of 109 trips annually and it was 72 trips for those who lived in urban areas. Women had 88 trips to nature and men had 70. The respondents who belonged to an outdoor recreation organization had 85 trips and those who did not belong had 78 trips.
Table 1. Descriptive statistics of variables used in statistical analysis.
The total travel cost (i.e. TC plus opportunity cost of travel time) for a trip to a nature area was approximately 117 SEK (16 USD). Multiplying the total travel cost for a trip by the average annual frequency of trips, the annual total travel cost is 9360 SEK (1282 USD). The total amount over the 591 respondents is estimated to be 5,531,760 SEK (757,775 USD). The respondents travelled an average of approximately 12 kilometres for a trip to a nature area and had a travel time of approximately 0.46 hours (i.e. 28 minutes). The travel time translates to an opportunity cost of 19 SEK (3 USD) for a trip to a nature area and approximately 41 SEK (6 USD) for 1 hour of travel time, respectively. Multiplying the opportunity cost of travel time for a trip by the average annual frequency of trips, the average annual opportunity cost for travel time to nature areas is 1520 SEK (208 USD).
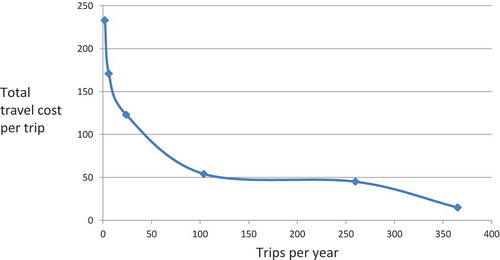
Approximately 10.5% of the respondents had an average of two trips to nature areas in the last 12 months () and their average total cost associated with each trip was 233 SEK (32 USD). Approximately 20.7%, 26.7% and 28% of the respondents had 6, 24 and 104 trips, respectively. Furthermore, 8% and 6% of the respondents had an average of 260 and 365 trips, respectively. The relationship between the total travel cost and the frequency of trips to nature area is presented in . The results reveal that an increase in the total travel cost is associated with a decrease in the frequency of trips. For example, when the total travel cost was approximately 233 SEK (32 USD), the respondents had two trips to nature, and when the total travel cost was 15 SEK (2 USD), the respondents had 365 trips.
Figure 1. Total travel cost curve for recreational trips to nature area.
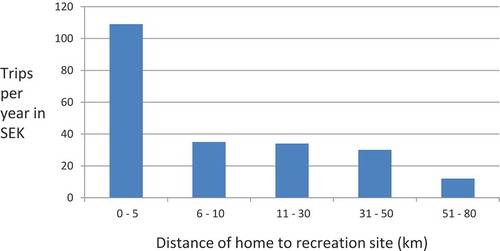
The results showed that the closer the respondent’s home is to a nature area the greater the number of trips to that area, and the farther the home is from a nature area the lower the number of trips (). For example, the respondents who lived 51–80 km from a nature area had 12 trips to that area and those who lived at most 5 km from the site had 109 trips.
Figure 2. Trips in relation to distance travelled.
Of all the nature types explored in this study, forest-dominated areas were the most visited, followed by meadow areas, and mountain areas were the least visited (). The results reveal that trips to mountain-dominated areas had the highest total travel cost followed by areas dominated by water, and forest-dominated areas had the least.
Table 2. Nature types in relation to travel cost and frequency of trips.
A negative binomial regression model was estimated to examine the factors that might have influenced the frequency of trips to nature areas (). The results show that the overdispersion parameter (alpha) was statistically significant. This indicates that the data used in this study were influenced by the problem of overdispersion, thereby supporting the evidence for the use of the negative binomial regression for analysing the data. The statistic was highly statistically significant, which is an indication of the overall significance of the regression model. The results revealed that the CS (526 SEK = 72 USD) for a recreational trip is more than four times higher than the calculated total travel cost (117 SEK = 16 USD). This implies that the respondents get greater benefits from recreation than the costs associated with the recreational trip. Multiplying the CS by the average frequency of trips gave an annual CS of 42,080 SEK (5764 USD) per respondent. Aggregating the CS over the 591 respondents in this study, the total benefit of recreation in nature to them is 24,869,280 SEK (3,406,751 USD).
Table 3. Negative binomial model results for recreational trips.
The results showed that an increase in TC, travel time and length of time spent in a nature area was associated with a decrease in the frequency of trips to the area, respectively (). An increase in income was associated with an increase in the frequency of trips. In terms of marginal effects, an increase in TC and opportunity cost of travel time by 10 SEK was associated with a decrease in the annual frequency of trips to nature areas by 1.3 and 8.3 trips, respectively. An increase of 1 hour in the time spent in nature areas decreased the annual frequency of trips to nature areas by approximately 15 trips. An increase in income of 10 SEK was associated with an increase in the annual frequency of trips to nature areas of four trips.
The results revealed that the presence of an urban area and fishing were associated with a decrease in the frequency of trips to nature areas, respectively. The presence of dog ownership was associated with an increase in the frequency of trips. In terms of marginal effects, living in an urban area and fishing were associated with decreases in the annual frequency of trips to nature areas of approximately 21 and 42 trips, respectively. The ownership of a dog was associated with an increase in the annual frequency of trips of 35 trips.
The results showed that the presence of forest-dominated areas was associated with an increase in the frequency of trips to nature areas. The presence of water-, mountain- and nature park-dominated areas led to a decrease in the frequency of trips to nature areas. In terms of marginal effects, forest-dominated areas were associated with an increase in the annual frequency of trips to nature areas of approximately 29 trips. Water-dominated areas, mountains and parks were associated with decreases in the annual frequency of trips of approximately 27, 48 and 39 trips, respectively. The coefficients associated with membership of an outdoor recreation organization, gender, age, education, grass-dominated areas and meadow were not statistically significant.
5. Discussion
The findings from this study show that forest-dominated areas are frequently used for nature-based recreation in Sweden. Forest is also associated with the lowest travel cost compared with the other nature types that were explored. This suggests that an increase in the frequency of trips to forest areas does not necessarily lead to a greater travel cost. This can be explained by the abundance of forest in Sweden, that is, 70% forest cover (Swedish Forest Industries Federation Citation2012), and the fact that recreation in forest areas requires very little investment. For example, people do not need special clothing and equipment to visit forests, unlike mountain- and water-dominated areas. The findings are supported by previously published papers, such as Lundmark and Muller (Citation2010), who reported that seaside and mountainous areas are more in demand by tourists in Sweden than forest-dominated areas. Loomis and Walsh (Citation1997) found that people would pay more for recreational activities that require large investment than those that require little investment. If the aim is to establish recreational forest in order to meet the goal of Right to Public Access, it is important for recreation managers and planners to manage the forest towards meeting societal preferences and demands in terms of, for example, tree species composition, accessibility (i.e. degree of openness in the forest) and tree species mixtures. For example, the forest could be managed in a way that promotes a mixture of broadleaved and coniferous tree species as well as encouraging accessibility to visitors. To maintain the quality of recreational forest, managers could limit its use and provide incentives that promote visitors’ behaviours that have the least impacts on forest. These recreational forest management strategies are in line with the findings of Norman et al. (Citation2010), who found that broadleaved tree species are more important than conifers for visitors. Heyman et al. (Citation2011) and Cole (Citation2008) found that open forests are attractive to Swedish forest visitors and that visitors’ behaviours could be modified to reduce the negative impacts on recreational forests.
With regard to the relationship between travel cost and the frequency of trips to nature areas, the result is in line with that of the economic theory of demand, that is, as the price of the good increases, the quantity that would be bought decreases (Varian Citation2010). The findings are supported by several previously published papers, such as Cho et al. (Citation2014), who found that the frequency of trips to national forests in the United States decreased as the travel costs increased. In a Finnish study, Ovaskainen et al. (Citation2012) found that visitors to a national hiking area took fewer trips to the area at a higher travel cost. In an Australian study, Pascoe et al. (Citation2014) found that people who spend a lot of money on visiting a fishing area go less frequently to those areas. Furthermore, Swedish residents prefer a shorter distance to recreational forests (Hörnsten & Fredman Citation2000). Residents of Helsinki within a short distance of green areas had a higher number of trips to those areas than those who lived longer distances away (Neuvonen et al. Citation2007). This suggests that if the aim is to promote the participation of Swedish residents in recreational activities to promote their physical and mental well-being (Chiesura Citation2004; Townsend Citation2006), land use planners should consider designing an improved road network, and more fuel-efficient vehicles could be advocated to help reduce transport costs. Nature types that require human interventions, such as forest, meadows and urban parks should be established closer to homes to motivate various categories of Swedish residents to engage in recreational activity. This is supported by French et al. (Citation2001), who found that the availability of nature areas promotes people’s participation in recreation. It is important for recreation managers and planners to consider transport costs and the distance of built areas (i.e. homes) to a recreation site when selecting the location for the site. However, geographical restrictions make it practically impossible to bring some nature types, such as mountains and water bodies, closer to homes. Recreation managers should put more effort into providing nature types that can be created by humans, such as forest, grassland and meadows.
The findings on the economic value of recreation reveal that the annual CS (i.e. benefits of recreation) is approximately 12% of the average annual income of Swedish residents. This indicates that nature-based recreation plays an important role in the welfare of these residents. The CS for a trip to a nature area was three to five times greater than that of previously published papers on recreation in Sweden. For example, Norman et al. (Citation2010) found that the CS for a trip to recreational forest in southern Sweden ranged from 110 SEK to 174 SEK. One possible reason for the difference is that this study focused on many nature types simultaneously in the whole of Sweden, while Norman et al. (Citation2010) focused on only one nature type in one segment of the country. The findings from this study justify government spending on amenities that provide opportunities for recreation as well as loss to Swedish residents if they are denied opportunities for recreation. Policymakers should consider the costs and benefits associated with the provision of recreation opportunities among competing uses of land. These are supported by the findings of other researchers, such as Simos et al. (Citation2013) and Martinez-Espineira and Amoako-Tuffour (Citation2008).
The finding on travel time is in line with that of previously published papers. For example, Italian residents had fewer recreation trips when faced with a longer travel time (Fezzi et al. Citation2014). If the aim is to reduce travel time and consequently travel cost to promote the participation of Swedish residents in recreation activities, it is important for land use planners to consider improving the available road network, thereby reducing possible traffic congestion on roads to recreation sites. The frequency of public transport to neighbourhoods of nature areas could be increased to help reduce the restrictions visitors face as reported by Humphreys and Ruseski (Citation2007). This would help reduce travel cost to nature areas and encourage people to be involved in recreational activity.
The result on the effect of income on trip frequency is in line with findings from previously published papers on the subject, such as Swedish residents who have a lot of money had many recreational trips (Lundevaller Citation2009). People who have a lot of money in Croatia visited the beach frequently for recreation (Logar et al. Citation2014). Swedish society is heterogeneous in terms of income (i.e. high-, middle- and low-income groups), thus it is important for recreation managers and planners to consider this heterogeneity in the design and selection of location for recreation sites. For example, the preferences of various groups of people and associated restrictions should be considered when selecting the site. This is because if the site is far from people’s homes, recreation on that site might become a luxury good and the low-income group may be restricted from using it for recreation.
In the event of using a resource, people tend to maximize net benefits. In this study, it was found that people who spent a longer time in a nature area visited the area fewer times. The findings are in line with those of Latinopoulos (Citation2014), who reported that people who spent more time in a protected area in Greece went less frequently to the area. The results on the effect of dwelling place on trip frequency are in line with the findings of Bennear et al. (Citation2005), who found that urban residents in the United States purchased fewer fishing licences. Zawacki et al. (Citation2000) found that urban residents took fewer trips related to wildlife recreation in the United States. To improve access to nature in urban areas, it is important that land use planners consider amenities for recreation in urban development. This could be done by establishing urban forestry and encouraging urban gardening.
The finding on the effect of recreational fishing on trip frequency differs from previously published papers, such as Ovaskainen et al. (Citation2012), who found that visitors engaged in fishing in a national hiking area in Finland went more frequently to the area. One possible reason for the difference is that Ovaskainen et al. (Citation2012) considered only one recreation site; however, all nature areas in a country were considered in this study. Public waters may be crowded with visitors, which could generate conflicts of interest. It is important for recreation area managers and planners to consider designing a strategy that helps reduce the potential crowding of fishing visitors in public waters so that many people can get access to the area. The findings showed that people who owned a dog were frequent visitors to nature areas. This has the potential for conflicts of interest in nature areas. For example, there have been some cases where dogs have attacked children playing at a recreation site. It is important for recreation managers to consider developing some possible ways of regulating dogs at recreation site. For example, a part of the site could be reserved for dogs and their owners, and penalties imposed on people who allow their dogs to roam freely on the site.
6. Conclusions
This study provides an insight into trips to nature areas for recreational activities, and the costs and benefits associated with these trips in Sweden. The findings reveal that trips to nature areas are strongly linked to travel costs and nature type. Forest-dominated areas play the most important role in trips to nature areas for recreation. If the aim is to motivate people to visit nature areas frequently for recreation, it is important to provide more facilities that could help reduce travel time and consequently reduce travel costs to nature areas. For example, the existing road network to nature areas could be improved and maintenance works carried out on poor roads to help reduce traffic congestion. The frequency of public transport to these areas could be increased and more research on fuel-efficient vehicles advocated. The introduction of urban forestry and urban greening as well as urban gardening could help in providing nature types that could meet the demands of some urban residents. In planning and designing a recreation site, it is important to bear in mind that some visitors to the site may have pets, such as a dog. This suggests the need for recreation managers and land use planners to incorporate facilities that will accommodate these pets in the design of the recreation site. It is also important for visitors to the site to be well informed about regulations associated with the handling of pets. This will help reduce the tendency for human–pet conflicts on recreation sites.
Although recreation experience contributes to societal welfare, it is important to note that nature also provides other ESs that are important for the society. Managing nature towards the provision of one single service might lead to the loss of other ESs. It is important for recreation managers and land use planners to consider possible ways of designing and managing nature areas to promote the provision of multiple ESs simultaneously. The findings contribute to a greater understanding regarding the distribution of costs and benefits associated with nature-based recreation in Sweden. This should help outdoor recreation managers to plan and design a nature-based recreation strategy that meets societal preferences and demands for recreation. This will help the society to benefit as much as possible from recreation.
Acknowledgements
I thank all Swedish residents who spent their valuable time in completing the questionnaire. I will like to thank the editor of this manuscript for the useful comments. The research was made possible by financial support from the Friluftsliv i förändring (FIF) forskningsprogram (research programme, Outdoor Recreation in Change), Sweden.
Disclosure statement
No potential conflict of interest was reported by the author.
Additional information
Funding
References
- Bennear LS, Stavins RN, Wagner AF. 2005. Using revealed preferences to infer environmental benefits: evidence from recreational fishing licenses. J Regul Econ. 28:157–179.
- Bockstael NE, McConnell KE. editors. 2007. Environmental and resource valuation with revealed preferences: A theoretical guide to empirical models. Springer-Dordrecht: Netherlands.
- Bockstael NE, Freeman AM. 2005. Welfare theory and valuation. In: Mäler K-G, Vincent JR, editors. Handbook of environmental economics: valuing environmental changes. Amsterdam: North Holland; p. 517–570.
- Bowker JM, English DBK, Donovan JA. 1996. Toward a value for guided rafting on southern rivers. J Agric Appl Econ. 28:423–432.
- Boxall PC, McFarlane BL, Gartrell M. 1996. An aggregate travel cost approach to valuing forest recreation at managed sites. For Chron. 72:615–621.
- Cameron AC, Trivedi PK. 1986. Econometric models based on count data: comparisons and applications of some estimators and tests. J Appl Econometrics. 1:29–53.
- Cameron AC, Trivedi PK. 1990. Regression based tests for overdispersion in the Poissonregression model. J Econom. 46:347–364.
- Carpenter SR, DeFries R, Dietz T, Mooney HA, Polasky S, Reid WV, Scholes RJ. 2006. Millennium ecosystem assessment: research needs. Science. 314:257–258.
- Carpenter SR, Mooney HA, Agard J, Capistrano D, Defries RS, Diaz S, Dietz T, Duraiappah AK, Oteng-Yeboah A, Pereira HM, et al. 2009. Science for managing ecosystem services: beyond the Millennium ecosystem assessment. Proc Natl Acad Sci USA. 106:1305–1512.
- Champ PA, Boyle K, Brown TC, editors. 2003. A primer on nonmarket valuation. Boston: Kluwer Academic Publishers.
- Chan KMA, Satterfield T, Goldstein J. 2012. Rethinking ecosystem services to betteraddress and navigate cultural values. Ecological Econ. 74:8–18.
- Chatterjee S, Price B. 1991. Regression analysis by example. New York: Wiley.
- Chiesura A. 2004. The role of urban parks for a sustainable city. Lands Urban Plan. 68:129–138.
- Cho S-H, Bowker JM, English DBK, Roberts RK, Kim T. 2014. Effects of travel cost and participation in recreational activities on national forest visits. For Policy Econ. 40:21–30.
- Cole DN. 2008. Ecological impacts of wilderness recreation and their management. In: Dawson CP, Hendee JC, editors. Wilderness management: stewardship and protection of resources and values. Golden: Fulcrum Press; p. 395–438.
- Costanza R, d’Arge R, de Groot R, Farberk S, Grasso M, Hannon B, Limburg K, Naeem S, O’Neill RV, Paruelo J, et al. 1997. The value of the world’s ecosystem service and natural capital. Nature. 387:253–260.
- Creel MD, Loomis JB. 1990. Theoretical and empirical advantages of truncated count data estimators for analysis of deer hunting in California. Am J Agric Econ. 72:434–441.
- Crossman ND, Bryan BA. 2009. Identifying cost-effective hotspots for restoring natural capital and enhancing landscape multi-functionality. Ecological Econ. 68:654–668.
- D’Antonio A, Monz C. 2016. The influence of visitor use levels on visitor spatial behaviour in off-trail areas of dispersed recreation use. J Environ Manage. 170:79–87.
- Daily GC, Polasky S, Goldstein J, Kareiva PM, Mooney HA, Pejchar L, Ricketts TH, Salzman J, Shallenberger R. 2009. Ecosystem services in decision making: time to deliver. Front Ecol Environ. 7:21–28.
- Danell K, Bergström R, Elmberg J, Emanuelsson U, Christiernson A. 2010. Viltet [The game]. In: Danell K, Bergström R, editors. Vilt, människa, samhälle [Game, people, society]. Stockholm: Liber; p. 17–31.
- de Groot R, Brander L, van der Ploeg S, Costanza R, Bernard F, Braat L, Christie M, Crossman N, Ghermandi A, Hein L, et al. 2012. Global estimates of the value of ecosystems and their services in monetary units. Ecosystem Serv. 1:50–61.
- de Groot RS, Alkemade R, Braat L, Hein L, Willemen L. 2010. Challenges in integrating the concept of ecosystem services and values in landscape planning, management and decision making. Ecol Complex. 7:260–272.
- Douglas AJ, Taylor JG. 1999. A new model for the travel cost method: the total expenses approach. Environ Model Softw. 14:81–92.
- Econometric Software Inc. 2007. NLOGIT version 4.0. New York, NY: Econometric Software Inc.
- Edwards D, Jensen FS, Marzano M, Mason B, Pizzirani S, Shelhaas M-J. 2011. A theoretical framework to assess the impacts of forest management on the recreational value of European forests. Ecol Indic. 11:81–89.
- Emmelin L, Fredman P, Sandell K, Lisber JE. 2010. Planera för Friluftsliv: Natur, Samhälle, Upplevelser. Stockholm: Carlsson bokförlag.
- Englin J, Boxall PC, Chakraborty K, Watson DO. 1996. Valuing the impacts of forest fires on backcountry forest recreation. For Sci. 42:450–455.
- Ezebilo EE, Boman M, Mattsson L, Lindhagen A, Mbongo W. 2015. Preferences and willingness to pay for close to home nature for outdoor recreation in Sweden. J Environ Plann Manag. 58:283–296.
- Ezebilo EE, Sandström C, Ericsson G. 2012. Browsing damage by moose in Swedish forests: assessments by hunters and foresters. Scand J For Res. 27:659–668.
- Fezzi C, Bateman IJ, Ferrini S. 2014. Using revealed preferences to estimate the value of travel time to recreation sites. J Environ Econ Manage. 67:58–70.
- Fisher B, Turner K, Zylstra M, Brouwer R, de Groot R, Farber S, Ferraro P, Green R, Hadley D, Harlow J, et al. 2008. Ecosystem services and economic theory: Integration for policy-relevant research. Ecological Appl. 18:2050–2067.
- Fredman P, Romild U, Yuan M, Wolf-Watz D. 2012. Latent demand and time contextual constraints to outdoor recreation in Sweden. Forests. 3:1–21.
- French SA, Story M, Jeffery RW. 2001. Environmental influences on eating and physical activity. Annu Rev Public Health. 22:309–335.
- Garrod G, Willis KG. 1999. Economic valuation of the environment. Cheltenham, U.K: Edward Elgar.
- Goldstein JH, Caldarone G, Duarte TK, Ennaanay D, Hannahs N, Mendoza G, Polasky S, Wolny S, Daily GC. 2012. Integrating ecosystem service trade-offs into land-use decisions. Proc Natl Acad Sci USA. 109:7565–7570.
- Gravelle H, Rees R. 2004. Micro-economics. Essex, England: Pearson Education Ltd.
- Greene WH. 2012. Econometric analysis. 7th ed. New Jersey: Prentice Hall.
- Haab TC, McConnell KE. editors. 2002. Valuing environmental and natural resources: the econometrics of non-market valuation. Edward Elgar: Cheltenham, UK.
- Hammitt WE, Cole DN, Monz CA. 2015. Wildland recreation: ecology and management. Hoboken: John Wiley and Sons.
- Heberling M, Templeton J. 2009. Estimating the economic value of national parks with count data models using on-site secondary data: the case of the great sand dunes National park and preserve. Environ Manage. 43:619–627.
- Heyman E, Gunnarsson B, Stenseke M, Henningsson S, Tim G. 2011. Openness as a key- variable for analysis of management trade-offs in urban woodlands. Urban for Urban Gree. 10:281–293.
- Hilbe JM. 2011. Negative binomial regression. New York: Cambridge University Press.
- Hörnsten L, Fredman P. 2000. On the distance to recreational forests in Sweden. Landsc Urban Plan. 51:1–10.
- Hultman J, Sandell K, Sörlin S, editors. 2000. Friluftshistoria. Från härdande friluftsliv till ekoturism och miljöpedagogik. Teman i det svenska friluftslivets historia. Malmö: Carlssons.
- Humphreys BR, Ruseski JE. 2007. Participation in physical activity and government spending on parks and recreation. Contemp Econ Policy. 25:538–552.
- Kardell L, Lindhagen A. 1995. Förändringar I Växjöbornas friluftsliv mellan 1975 och 1992. Uppsala: Institutionen för skoglig landskapsvård, Sveriges lantbruksuniversitet.
- Kumar M, Kumar P. 2008. Valuation of the ecosystem services: A psycho-cultural perspective. Ecological Econ. 64:808–819.
- Latinopoulos D. 2014. The impact of economic recession on outdoor recreation demand: an application of the travel cost method in Greece. J Environ Plann Manag. 57:254–272.
- Layman RC, Boyce JR, Criddle KR. 1996. Economic valuation of the Chinook salmon sport fishery of the Gulkana River, Alaska, under current and alternate management plans. Land Econ. 72:113–128.
- Lindhagen A 1996. Forest recreation in Sweden: four case studies using quantitative and qualitative methods. Report no. 64. Uppsala: Swedish University of Agricultural Sciences.
- Logar I, Jeroen CJM, van den B. 2014. Economic valuation of preventing beach erosion: comparing existing and non-existing beach markets with stated and revealed preferences. J Environ Econ Policy. 3:46–66.
- Loomis J, Yorizane S, Larson D. 2000. Testing significance of multi-destination and multi-purpose trip effects in a travel cost method demand model for whale watching trips. Agric Resource Econ Rev. 29:183–191.
- Loomis JB, Walsh RC. 1997. Recreation economic decisions: comparing benefits and costs. 2nd ed. Pennsylvania: Venture Publishing, Inc.
- Lundevaller EH. 2009. The effect of travel cost on frequencies of shopping and recreational trips in Sweden. J Transp Geogr. 17:208–215.
- Lundmark L, Muller DK. 2010. The supply of nature-based tourism activities in Sweden. Tourism. 56:379–393.
- Martinez-Espineira R, Amoako-Tuffour J. 2008. Recreation demand analysis under truncation, overdispersion, and endogenous stratification: an application to Gros Morne National Park. J Environ Manage. 88:1320–1332.
- Martin-Lopez B, Gomez-baggethun E, Garcia-Llorente M, Montes C. 2014. Trade-offs across value-domains in ecosystem services assessment. Ecol Indic. 37:220–228.
- Martin-Lopez B, Montes C, Benayas J. 2007. The non-economic motives behind the willingness to pay for biodiversity conservation. Biol Conserv. 139:67–82.
- Mattsson L, Boman M, Ezebilo EE. 2014. More or less moose: how is the hunting value affected? Scand J For Res. 29:170–173.
- Mayor K, Scott S, Tol RSJ 2007. Comparing the travel cost method and the contingent valuation method – An application of convergent validity theory to the recreational value of Irish forests. ESRI Working Paper No. 190.
- MEA (Millennium Ecosystem Assessment). 2005. Ecosystems and human well-being: synthesis. Washington, DC: Island Press.
- Mitchell RC, Carson RT. 1989. Using surveys to value public goods: the contingent valuation method. Washington, DC: Resources for the Future.
- Monz CA, Pickering CM, Hadwen WI. 2013. Recent advances in recreation ecology and the implications of different relationships between recreation use and ecological impacts. Front Ecol Environ. 11:441–446.
- Naturvårdverket 2009. Statistikprogram för Friluftsliv – ett förslag. Rapport 5975. Naturvårdverket, Stockholm, Sweden.
- Neuvonen M, Sievänen T, Tönnes S, Koskela T. 2007. Access to green areas and the frequency of visits – A case study in Helsinki. Urban for Urban Gree. 6:235–247.
- Norman J, Ellingson L, Boman M, Mattsson L. 2010. The value of forests for outdoor recreation in southern Sweden: are broadleaved trees important? Ecological Bulletins. 53:21–31.
- Ode A, Fry G. 2006. A model for quantifying and predicting urban pressure on Woodland. Landsc Urban Plan. 77:17–27.
- Offenbach LA, Goodwin BK. 1994. A travel-cost analysis of the demand for hunting trips in Kansas. Rev Agric Econ. 16:55–61.
- Ovaskainen V, Neuvonen M, Pouta E. 2012. Modelling recreation demand with respondent- reported driving cost and stated cost of travel time: A finnish case. J For Econ. 18:303–317.
- Pascoe S, Doshi A, Dell Q, Tonks M, Kenyon R. 2014. Economic value of recreational fishing in Moreton Bay and the potential impact of the marine park rezoning. Tourism Manag. 41:53–63.
- Pickering CM. 2010. Ten factors that affect the severity of environmental impacts of visitors in protected areas. Ambio. 39:70–77.
- Rockel ML, Kealy M. 1991. The value of nonconsumptive wildlife recreation in the United States. Land Econ. 67:422–434.
- Shrestha RK, Seidl AF, Moraes AS. 2002. Value of recreational fishing in the Brazilian Pantanal: a travel cost analysis using count data models. Ecological Econ. 42:289–299.
- Shrestha RK, Stein TV, Clark J. 2007. Valuing nature-based recreation in public natural areas of the Apalachicola River region, Florida. J Environ Manage. 85:977–985.
- Simos P, Barata E, Cruz L. 2013. Using count data and ordered models in National Forest recreation demand analysis. Environ Manage. 52:1249–1261.
- Svenska Kennelklubben. 2015. Dansk-svensk gårdshund [Danish-Swedish farm dog]. [Cited 2015 Oct 25]. Available from: http://www.skk.se/global/dokument/att-aga-hund/kampanjer/skall-inte-pa-hunden-2013/dog-owners-in-the-city_hi20.pdf
- Sweden Official Site. 2015. Swedes love nature. [Cited 2015 Oct 24]. Available from: https://sweden.se/nature/swedes-love-nature/
- Swedish Environmental Protection Agency. 2011. Right of public access – a unique opportunity. Stockholm: Swedish Environmental Protection Agency. [Cited 2013 Aug 30]. http://www.swedishepa.se/Documents/publikationer6400/978-91-620-8522-3.pdf
- Swedish Forest Agency. 2013. Forestry. Jönköping: Swedish Forest Agency.
- Swedish Forest Industries Federation. 2012. Swedish forestry. Stockholm: Swedish Wood.
- Tangeland T, Vennesland B, Nybakk E. 2013. Second-home owners’ intention to purchase nature-based tourism activity products – A Norwegian case study. Tourism Manag. 36:364–376.
- TEEB Foundations. 2010. Integrating the ecological and economic dimensions in biodiversity and ecosystem service valuation. In: Kumar, P. editor. The economics of ecosystems and biodiversity: Ecological and economic foundations. London: Earthscan.
- TEEB in Policy. 2011. The global biodiversity crisis and related policy challenges. In: Ten Brink P, editor. The economics of ecosystem and biodiversity in national and international policy making. London: Earthscan.
- Tietenberg T, Lewis L. 2010. Environmental economics and policy. Boston: Pearson Education, Inc.
- Townsend M. 2006. “Feel blue? Touch green! participation in forest/woodland management as a treatment for depression.” Urban Fore and Urban Gree. 5:111–120.
- Varian HR. 2010. Intermediate Microeconomics: A modern approach. New York: W.W Norton & Company.
- Ward FA, Beal D. 2000. Valuing nature with travel cost models: A manual. Cheltenham, UK: Edward Elgar.
- Willis KG. 1991. The recreational value of the forestry commission estate in Great Britain: A Clawson-Snetsch travel cost analysis. Scott J Polit Econ. 38:58–75.
- Wolff H. 2014. Value of time: Speeding behavior and gasoline prices. J Environ Econ Manage. 67:71–88.
- World Tourism Organization. 2008. Understanding Tourism: Basic Glossary. [Cited 2013 Aug 27]. Available from: http://dtxtq4w60xqpw.cloudfront.net/sites/all/files/docpdf/glossaryenrev.pdf
- Zawacki WT, Marsinko A, Bowker JM. 2000. A travel cost analysis of nonconsumptive wildlife-associated recreation in the United States. For Sci. 46:496–506.