
 ?Mathematical formulae have been encoded as MathML and are displayed in this HTML version using MathJax in order to improve their display. Uncheck the box to turn MathJax off. This feature requires Javascript. Click on a formula to zoom.
ABSTRACT
This study utilized the Integrated Valuation of Ecosystem Services and Tradeoffs (InVEST) pollination model to investigate the impacts of using field data on ecosystem services mapping studies by using potential pollination services in Cumberland and Colchester counties in Nova Scotia, Canada, as a case study. The model was run using two different sources of data to inform the floral resource component of the model. First, the model was run driven by proxies and approximate values gathered from the literature. The second iteration of the model utilized field-based data to generate floral resource abundance and distribution values. Both models utilized honey bee-specific species preference data drawn from field observations and expert opinion in the literature. Results indicated an 8.1% increase in the amount of land designated as high quality when the model was informed by field-based data. Such discrepancies are important when considering the potential implications of ecosystem services mapping studies on policy. As a tool, ecosystem services mapping provides the opportunity to spatially evaluate the impact that different land-use planning regimes could have on the supply and provision of various ecosystem services. However, as its popularity rises, it is important to keep in mind the accuracy and resolution of the data used to inform the modelling process.
EDITED BY:
1. Introduction
Although spatial modelling and mapping of ecosystem goods, such as timber and food, have a long history, the mapping of ecosystem services, the ‘conditions and processes through which natural systems, and the species that make them up, sustain and fulfill human life’ (Daily Citation1997, p. 3), is a relatively new discipline. Despite this novelty, some common patterns and approaches have emerged. In particular, as is common in much natural resources management, the field commonly uses proxies such as land cover to represent complex ecosystem processes and relies on data from remote-sensing sources (Seppelt et al. Citation2011; Martínez-Harms and Balvanera Citation2012). The use of field-based data is relatively uncommon in much current ecosystem services mapping. A review of 153 studies by Seppelt et al. (Citation2011) found that less than 40% of studies involving the assessment of ecosystem services utilized primary data sources, and only approximately 10% of the studies in the review incorporated locally collected field-based data. Martinez-Harms and Balvanera’s (Citation2012) review of 41 studies mapping ecosystem services yielded similar results. Of those that utilized field data, most were focused on a single service over a relatively small and specific area, such as carbon storage in the soils of southeast Queensland, Australia (Collard and Zammit Citation2006), the cultural services of deer hunting on farmlands in Michigan (Knoche and Lupi Citation2007) or crop pollination services on Californian watermelon crops (Kremen et al. Citation2004). Alongside more traditional tools used to inform policymaking, ecosystem service mapping can be utilized by policymakers to identify key areas of ecosystem service supply and assess potential trade-offs in land-use planning (Tallis and Polasky Citation2009; Seppelt et al. Citation2011; Martínez-Harms and Balvanera Citation2012; Martínez-Harms et al. Citation2016). However, while a useful addition to the policymaking toolbox, the production of ecosystem service maps can be a resource intensive process, potentially limiting their application to smaller, local-scale decision settings or when implications of trade-offs are high.
Pollination, particularly by bees, is one of the most well-studied ecosystem services, likely because of its perceived importance in food production (Klein et al. Citation2007; Ricketts et al. Citation2008; Potts et al. Citation2010; Breeze et al. Citation2011; Hanley et al. Citation2015). Numerous studies have evaluated the potential of different landscapes to support bee pollinator populations, based on elements such as the influence of natural, semi-natural and anthropogenic landscapes (Garibaldi et al. Citation2004; Hines and Hendrix Citation2005), nest site availability (Potts et al. Citation2003, Citation2005) and abundance, composition and distribution of floral communities (Potts et al. Citation2003; Lázaro et al. Citation2008). Kremen et al. (Citation2007) developed a conceptual model to describe the delivery of pollination services across agricultural landscapes. A simplified version of this model, based on landscape structure, pollinator communities, plant communities and the linkages between them, was developed by Lonsdorf et al. (Citation2009) to quantify and map relative pollinator abundances across agroecosystems. This simplified model, which eventually became part of the Integrated Valuation of Ecosystem Services and Tradeoffs (InVEST) software-based series of models, begins by locating appropriate nesting substrates and floral resources for the wild pollinators present in a system based on a land-cover map. The amount and location of these resources are then used to generate a map of pollinator abundance (Lonsdorf et al. Citation2009). In comparison to wild pollinators, relatively few studies have looked at the relationship between managed western honey bee (Apis mellifera) (hereafter referred to as honey bee) colonies and the landscapes that sustain them. Although managed pollinator populations require some human intervention to persist, particularly in colder climates, the availability of floral resources is generally used to determine whether a landscape can support managed pollinators. It does raise the question, however, of precisely what service is being mapped when we do this. When honey bees or any managed pollinator is deployed, it is not exclusively crops that are being pollinated for human use, for instance a blueberry crop, but also wild plants, the perpetuation of which more resembles a habitat service. Moreover, managed bees, and honey bees in particular, are effectively domesticated animals kept by farmers for production purposes. In this context, the ‘pasture’ that sustains them and allows for honey production represents a provisioning service. These interesting complexities must be acknowledged, but we will continue here to discuss them as pollination services.
Using the potential supply of forage for managed honey bees in Cumberland and Colchester counties of Nova Scotia, Canada, as a case study, we aim to investigate the influence of field data on ecosystem service mapping studies. Using the InVEST pollination model, we examined the differences in model output that occur when estimating floral resource values using proxies and approximate values found in the literature alone as compared to using locally collected field data for a set of key model inputs. The discrepancies between the two outputs highlight the importance of calibrating models to local conditions using field-based data. This is of importance when model results will be used as a decision support tool in policymaking, a factor that is not only applicable to ecosystem services mapping but also natural resources management in general.
2. Methods
2.1. Study area
This study was conducted in Cumberland and Colchester counties in the province of Nova Scotia, Canada (). As is the case in much of the province, the landscape of Cumberland and Colchester counties is highly heterogeneous, a result of a long history of human modification. Prior to European settlement, the region was densely forested and undoubtedly well utilized by indigenous peoples. It is presently characterized by small farms separated by tracts of forests of varying density – a complex landscape. The beekeeping industry is well established in Cumberland and Colchester counties, with approximately 4000 honey bee colonies being managed across the two counties.
Figure 1. The study area, Cumberland and Colchester counties of Nova Scotia, Canada, including the sites where field data were collected in the summer of 2015.
Beekeeping in Cumberland and Colchester is typically done on smaller scales (individual beekeepers typically have fewer than 100 colonies across multiple apiaries) in comparison to other regions of Nova Scotia, such as the Annapolis Valley where individual beekeepers may maintain hundreds of colonies. The smaller scale of their operations made beekeepers in Cumberland and Colchester counties ideal participants for this study, as beekeepers were asked to identify apiary sites for field data collection and collect data on colony productivity to be compared to landscape data, a process that could not be completed because of a low response rate. Beekeepers participated voluntarily and were identified through the Nova Scotia Beekeepers Association (NSBA), a presentation at the NSBA Annual General Meeting in 2015 and through the social networks of participating beekeepers (snowball sampling).
2.2. Invest modelling
The InVEST suite of models was developed by the Natural Capital Project (http://www.naturalcapialproject.org) as a tool to quantify, map and, where possible, assign monetary value to ecosystem services to better incorporate values associated with natural capital into decision-making (Sharp et al. Citation2016). The primary aim of the software is to provide information concerning how changes in ecosystems are likely to lead to changes in the flow of ecosystem services to people (Sharp et al. Citation2016). Currently, there are 18 spatially explicit models in the InVEST suite used to map a variety of ecosystem services in terrestrial, freshwater and marine systems (Sharp et al. Citation2016). Among the suite of models is a crop pollination model, designed to model and map relative patterns of pollinator abundance and potential pollination service values across landscapes (Sharp et al. Citation2016).
The InVEST pollination model that was used in this study is GIS based and spatially explicit. It uses information concerning the potential availability of nesting sites and floral resources, in combination with the flight range of the species in question, to map an index of potential bee abundance across a given landscape (Sharp et al. Citation2016). The final output of the model is based on Equation (1), where is the suitability for nesting of land-use/land-cover (LULC) type j,
is the relative amount of floral resources LULC type j produces,
is the Euclidean distance between cells m and x and αβ is the expected foraging distance of pollinator species β (Sharp et al. Citation2016).
The InVEST pollination model utilizes Equation (1) to produce the final index of potential pollinator abundance.
The crop pollination model focuses on wild bees as key pollinators; however, there is nothing inherent in the model that means it cannot be used for managed honey bees. For honey bees to persist on the landscape, two things are necessary: a suitable spot to place hives and sufficient food proximal to their nesting site, both of which are accounted for in the InVEST pollination model (Kremen et al. Citation2007; Lonsdorf et al. Citation2009; Sharp et al. Citation2016).
2.3. Data inputs
There are three primary inputs needed to run the InVEST pollination model: a table of pollinator species, a digital LULC map in raster format and a table of land-cover attributes.
2.3.1. Table of pollinator species
In the InVEST pollination model, the table of pollinator species is used to inform the model of the nesting and foraging preferences of each species to be modelled (Sharp et al. Citation2016). Since only one species (honey bees) was modelled in this study, the table is fairly simple (Supplementary Materials 1, Table S1.1).
2.3.2. LULC raster
The LULC raster was generated using the Nova Scotia Forest Ecosystem Classification (FEC) (Nova Scotia Department of Natural Resources Citation2007) and data provided in the Nova Scotia Topographic Geodatabase (Service Nova Scotia and Municipal Relations Citation2009). Two alterations to the FEC were made. First, a subclass was extracted from the forested classes based on their canopy cover; polygons with less than 40% cover were separated from those that are more densely covered. There were two reasons for doing so. First, conversations with participating beekeepers indicated they prefer areas with some but not a lot of tree-cover as apiary sites. Second, a less dense canopy allows for more growth in the understory, including many shrubs and herbaceous species that provide a good source of pollen and/or nectar for honey bees (Lefrançois et al. Citation2008; Latif and Blackburn Citation2010; Cho et al. Citation2017). The urban class in the FEC was also further subclassified because it encapsulated a multitude of urban elements with varying potentials to host and support honey bee populations, including buildings, parking lots, parks and backyards. Data concerning buildings, parking lots and parks, among other classes provided in the Nova Scotia Topographic Geodatabase, were used to delineate urban areas into two new classes: one that has the potential to host honey bee colonies and provide floral resources (e.g. cemeteries, parks) and one incapable of doing so (e.g. buildings, parking lots). The altered FEC was then used to create a 10 × 10 m raster of the study area representing LULC.
2.3.3. Table of land-cover attributes
A table of honey bee-specific land-cover attributes had to be constructed that characterized each LULC class in terms of nest site suitability and floral resource availability in the early and late summer. For this study, two tables of land-cover attributes were used, one which populated the floral resource availability based on data found in the literature on the spatial analysis of bee floral resources (e.g. Lonsdorf et al. Citation2009) (Supplementary Materials 1, Table S1.2) and one populated using field data collected through the fieldwork process, as well as field data and expert opinion from the CANPOLIN database, as described in Section 2.4 (Supplementary Materials 1, Table S1.3). The nesting site potential values are the same in both tables and are based on identifying LULC classes with potential vehicle access, minimal tree cover and a likelihood to harbour a wide variety of herbaceous plants.
2.4. Field data collection
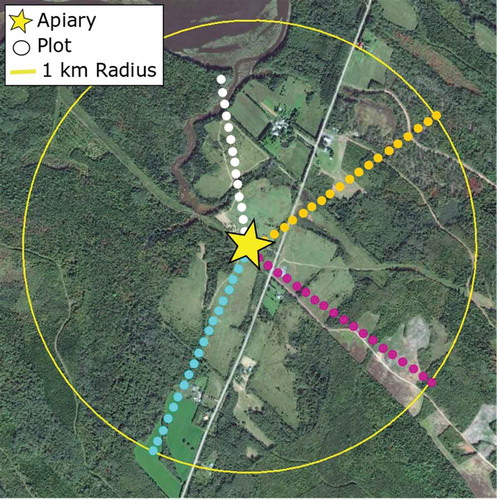
Throughout the summer of 2015, detailed surveys were conducted of flowering vegetation within a 1-km radius of the apiaries identified by participating beekeepers (). A 1-km radius was chosen because although honey bees are generally accepted to, at times, forage at distances greater than 1 km (Visscher and Seeley Citation1982; Beekman & Ratnieks Citation2000), typical foraging distances are known to be shorter in complex landscapes (Steffan-Dewenter and Kuhn Citation2003), as is the case in Cumberland and Colchester counties. The high degree of landscape heterogeneity found throughout the study area prompted us to reduce the assumed foraging distance and thus the area over which data were collected.
At each apiary site identified by beekeepers, four radial 1-km transects were laid out beginning at the honey bee colonies, using satellite imagery obtained from Google Earth. Transects were laid out to target open areas, but forested areas within sites were also visited to get a sense of the species present (). Along each transect, up to twenty 3 m × 3 m vegetation plots were established. Transects were sometimes terminated before 1 km because of impassable bodies of water (see the white transect in ). In these cases, the floral resource values for the remaining plots in the transect were recorded as zero, as honey bees do not generally forage on aquatic plants.
Figure 2. The layout of plots (circles) along transects surrounding an apiary within a 1-km radius.
In each plot, all species of flowering plants were identified and their percentage cover recorded, using a modified Daubenmire (Citation1959) method with 10 classes (). Percentage cover was used because of the large amount of time it took to visit and evaluate all of the sites at the sampling density established (up to 1 month). While using a different method to assess floral resource availability, such as flower density counts, might have yielded more precise estimates of floral resources within plots, the additional time required to assess sites would have greatly reduced the number of sites that could be included in the study. In addition, assessing percentage cover allowed us to arrive at robust estimates of density of flowering vegetation present without needing to be at the sites during the exact, sometimes very brief, time that the diverse range of plants present was in bloom. Two observers carried out the vegetation surveys for this study. To ensure consistency between observers, identical training was provided, and every 10 transects the two conducted ‘calibrating transects’ during which both observers evaluated the same plots. Geotagged photographs were taken using a Garmin Oregon 750™ of every plot which were reviewed at random to ensure consistency between observers in their cover class determinations. Each site was surveyed twice over the growing season, once in the early summer (June 5–July 10) to capture early blooming species, such as willow (Salix sp.) and dandelion (Taraxacum officinale), and again later in the season (July 30–August 25) to capture late flowering species such as clover (Melilotus officinalis) and goldenrod (Solidago sp.). When unfamiliar plants were encountered, a sample and photograph were taken and the species was identified in the lab.
Table 1. Modified Daubenmire method for evaluating vegetation percentage cover.
After field work, the data were converted to digital format in Excel and used to generate landscape forage quality scores for each plot in the study. These scores were based on both the quality and quantity of forage available for honey bees over a given area and were calculated through a two-stage process. Initially, each flowering species present in each plot was assigned two scores, one based on its percentage cover within a plot (as recorded in the field) and one based on the species’ known utility to honey bees. Utility scores were derived from the Canadian Pollination Initiative’s electronic floral calendar and are based on an extensive compilation of data, derived from field observations and expert opinion, of honey bee-specific species utilization (NSERC-CANPOLIN Citation2013) (Supplementary Materials 2, Table 2.7). As the CANPOLIN electronic floral calendar reported honey bee floral preference in terms of the resources the species provides (i.e. nectar, pollen) and the time of year resources are provided, it was necessary to convert these into honey bee-specific utility scores by transforming them into a relative scale from 0 to 1 to be utilized by the InVEST model. The products of the per cent cover and utility scores for each species in a plot were then summed to arrive at an overall forage quality score for each plot. A more detailed description of how these scores were calculated is found in Supplementary Materials 2.
For each LULC class, an average of forage quality from each visit to that LULC class was calculated. InVEST is based on relative values; therefore, each average was calculated as a percentage of the highest score and entered into the table of land-cover attributes. Classes in which no field data were collected (e.g. plantation, beach, open bog) were given a value of 0 (Supplementary Materials 1, Table S1.3).
2.5. Running the model
The InVEST pollination model was run to generate a relative index of pollinator abundance (IOA) on a scale of 0–1 for each 10 × 10 m cell of the LULC raster. The model was run twice, once with the table of land-cover attributes informed by the values found in the literature (Supplementary Materials 1, Table S1.2) and once informed by the data collected through fieldwork (Supplementary Materials 1, Table S1.3).
2.6. Analysing model results
Results of both the literature and field data-driven InVEST models were grouped based on index of abundance to determine the amount of land designated as high, medium and low quality. The two resulting rasters were also subtracted to quantify the difference between the two models.
3. Results
Recruitment efforts described in Section 2.1 resulted in 18 apiaries being included in this study (). Two parallel analytic processes were conducted. Both utilized the InVEST model, but the floral resource availability in one iteration was based on values found in the literature, and in the other, the field-based data were used. This process and the results are illustrated for both the literature and field data-driven iterations of the model ().
Figure 3. Results of the InVEST modelling for the potential abundance of honey bees in Cumberland and Colchester counties of Nova Scotia. The model uses an LULC raster (a), a table of land -cover attributes (one iteration was informed by the literature and one was informed by field work) and a table of pollinator species as inputs to derive maps of nesting suitability (b) and floral resources (c). Combining (b) and (c) using Equation (1) generates an index of potential pollinator abundance on the landscape (d). Two iterations of the model were run, one informed by proxies and approximate values from the literature (i) and the other by field work (ii).
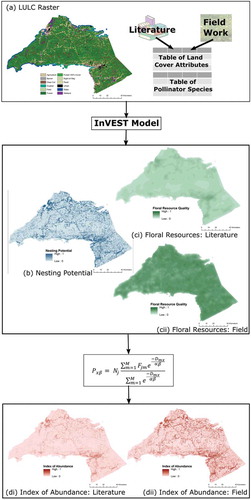
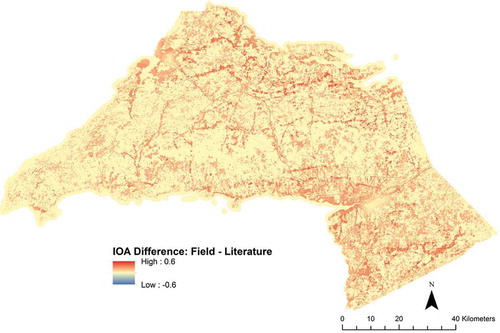
Visual inspection of indicates higher levels of floral resource availability, and therefore higher IOA when the model is informed by field data ((cii,dii)) compared to literature-based data ((ci,di)). Of note are the differences in floral resource values recorded for the forested classes, both with more than 40% cover and less than 40% cover, wetland classes and agricultural classes (Supplementary Materials 1, Tables S1.2 and S1.3). Not surprisingly, given the heterogeneity of the landscape, the areas of high potential abundance are fragmented and distributed across both Cumberland and Colchester counties. This visual inspection was further confirmed through a raster subtraction which indicated that in every landscape across the study area, the field data-driven model produced an equal or higher index of abundance than the literature-driven model ().
Figure 4. Results of a subtraction between the results of the field-based InVEST model and the results of the literature-driven iteration.
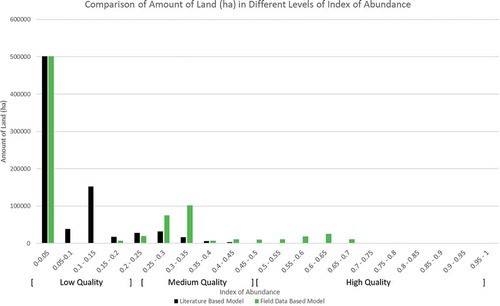
To better understand the scale of increase in pollinator abundance between the literature and field data-driven models, we compared the amount of land that falls into different levels of IOA generated by the analysis informed by field and literature-driven data (). Results of the field data-driven iteration of the model indicate there is an increased potential for the study area to support honey bees, then when the model is informed exclusively by established values in the literature. The field data-driven model produces an 8.1% increase in the amount of the study area that could be considered to have high potential to support honey bees (IOA > 0.5). It should be noted that the amount of land falling into the lowest category (IOA 0–0.05), with no potential to support honey bees, is almost the same in both iterations of the model (in both cases 63.0% of the study area). Therefore, the increase in area with a high IOA is because the floral resource quality of marginal lands (especially in forested, wetland and agricultural classes) in the literature-based iteration is improved based on the data derived from field work.
Figure 5. Comparison of the amount of land in different levels of the index of abundance generated by the analysis informed by literature and field-based data.
4. Discussion
4.1. Source of difference in the models
Since both the field and literature data-driven models had the same values for nesting site potential, any difference in output is entirely attributable to the floral resource values. The largest changes in floral resource potential were found in the forested classes. Floral resource values for forested classes with more than 40% cover increased from 0.4/0.0 (early summer/late summer) in the literature-based iteration of the model to 0.42/0.85 in the field data iteration (Supplementary Materials 1, Tables S1.2 and S1.3). Forested classes with less than 40% cover increased from 0.4/0 to 0.64/1 (Supplementary Materials 1, Tables S1.2 and S1.3). This difference is likely because the literature-driven values focus solely on the floral resource potential of the trees present. Trees provide floral resources for honey bees only in the spring and early summer (NSERC-CANPOLIN Citation2013). However, this neglects the understory of the forest, which, despite comprising less than 1% of the total biomass of forest ecosystems, accounts for upwards of 90% of the floristic diversity of the system, including many species that provide good forage for honey bees throughout the growing season, such as raspberry (Rubus idaeus), wild rose (Rosa acicularis) and aster (Aster sp.) (Gilliam Citation2007; Proctor et al. Citation2012; Cho et al. Citation2017). The presence of a forest understory is limited by the amount of light that reaches the forest floor, and therefore forests with less dense canopies will be more likely to support an understory with the rich floristic diversity conducive to supporting honey bee populations (Lefrançois et al. Citation2008; Latif and Blackburn Citation2010; Cho et al. Citation2017). As such, the increase of floral resources in the forested classes is likely to be at the lower densities of canopy closure.
The potential of wetlands to provide floral resources also appears to have been underestimated in the literature-driven model in comparison to the field data-based model. The early/late season floral resource value of wetlands in the literature-driven model was 0.2/0.2 and in the field-driven model, the values were 0.38/0.6 (Supplementary Materials 1, Tables S1.2 and S1.3). There is a lack of literature on the value of wetlands as forage for honey bees, but studies that have looked at the relationship between bees and the landscapes on which they depend have consistently attributed low value to wetlands (e.g. Lonsdorf et al. Citation2009; Sponsler and Johnson Citation2015). In the case of this study, the value of wetlands in the field data appears to be attributed to the presence of dense patches of goldenrod, common vetch (Vicia sativa) and aster on lands designated as wetlands in the FEC but was not noted as wetland during the field data collection process. This disparity may be caused by errors within the FEC when it comes to identification of wetlands. Numerous authors have noted the difficulties in identifying wetlands through image classification, and thus, it is reasonable to assume there are accuracy issues with the wetland classification classes in this dataset (Sader et al. Citation1995; Hogg and Todd Citation2007). The data in the FEC are also nearly 10 years old, meaning it is also possible that some of the parcels designated as wetland may have undergone some form of land-cover/land-use change, either through natural or anthropogenic means, resulting in an LULC class change on the ground which is not recorded in the dataset. This source of error in the model may have resulted in an overestimation of the value of wetlands. However, it should be noted that wetlands constitute only a small portion of the study area (2.6%), so the impacts of this overestimation on the results should be minimal.
The early/late season value of agricultural land as a source of floral resource for honey bees was also noticeably higher in the field data-driven model compared to the literature-driven data-based iteration (0.68/0.85 compared to 0.5/0.5, respectively; Supplementary Materials 1, Tables S1.3 and S1.2). This may be attributed to the age of the land classification data used (2007) and the ongoing trend of land abandonment of some historically cultivated agricultural land in the study area (Devanney and Reinhardt 2011). During the field data collection component of the study, it was observed that numerous plots of land designated as agricultural in the FEC were, in fact, no longer in production. Vegetation succession patterns on abandoned farmland in this part of Nova Scotia follow a general pattern of colonization by spontaneous vegetation, beginning with an herbaceous phase, moving to a shrub-dominated phase and culminating in a forested phase (Smith et al. Citation1993; Benjamin et al. Citation2005; Cramer et al. Citation2008). The abandoned parcels of agricultural land of concern in this study have likely been out of cultivation for less than 10 years, meaning they are characterized by herbaceous species, particularly weedy, often exotic species, and a few small trees (Drinkwater Citation1957; Benjamin et al. Citation2005; Cramer et al. Citation2008). The increase in floral diversity, particularly that of weedy species, has a positive impact on the ability of a parcel of land to support honey bees (Alaux et al. Citation2010; Di Pasquale et al. Citation2013; Requier et al. Citation2015). This phenomenon explains the increase in floral resource quality of parcels of land classified as agricultural.
4.2. Fine scale ecological conditions lead to the provision of ecosystem services
Broad scale, landscape level processes are important for the provision and management of ecosystem services (Daily Citation2000; Steffan-Dewenter et al. Citation2002). However, it is important to understand and account for what is occurring on finer scales to fully understand the biophysical conditions required for ecosystem service provision. Field-based approaches to mapping ecosystem services at a scale reflective of the biophysical underpinnings of the service of interest provide a finer scale understanding of how the processes responsible for the delivery of these services operate across landscapes (Kremen Citation2005; Kremen and Ostfeld Citation2005; Schröter et al. Citation2015; Martínez-Harms et al. Citation2016).
In the case of pollination, a small-scale approach is of value because the provision of pollination services is reliant on the distribution of floral resources at fine resolutions not captured in typical remotely sensed imagery. Moreover, temporal granularity matters. Many bees, including honey bees, are active for the entire growing season; thus, temporal diversity in floral resources spanning across the entire growing season is required (Requier et al. Citation2015), a factor which may be difficult to capture with remotely sensed data. The fine scale of the biophysical underpinnings of pollination makes it an ideal ecosystem service to study using boots-on-the-ground field data collection. Results of this study indicate it is important to match the scale of data used to inform the modelling process, with the scale at which key biophysical processes occur (here flowering plants) to provide the service. Therefore, it is unlikely that pollination is the only ecosystem service in which the incorporation of fine resolution data is important. To map any ecosystem service which occurs at small scales, such as soil nutrient cycling and crop production, the use of fine resolution data is likely critical. This concept can also be applied to natural resource management more broadly, as it is always important to consider the scale of the phenomenon when you are mapping at the landscape level. In this regard, there may be a role for emergent digital data collection technologies using unmanned aerial vehicles that would, in theory, permit mapping of fine-scaled landscape features but at much higher rates than are possible through a strictly boots on the ground approach.
5. Conclusion
This study used both a field and a literature data-driven approach to model the potential for managed honey bees to persist on landscapes in Cumberland and Colchester counties as a result of floristic resources that provide forage. Results indicate that the ability to understand the system and predict potential abundance of honey bees across the study area was enhanced using field data. The disparities between the two models indicate the importance of the inclusion of field data in ecosystem services mapping studies and matching the scale of data collection to the scale of the biophysical processes driving the service.
TBSM_A_1417331_SupplementaryMaterial.pdf
Download PDF (315.7 KB)Acknowledgements
We are grateful for Wendy Margetts who provided invaluable assistance in the field and to the beekeepers and landowners who assisted in site identification and made field data collection possible.
Disclosure statement
No potential conflict of interest was reported by the authors.
Supplemental data
Supplemental data for this article can be accessed here.
Additional information
Funding
Related Research Data
References
- Alaux C, Ducloz F, Crauser D, Le Conte Y. 2010. Diet effects on honeybee immunocompetence. Biol Lett. 6:562–565.
- Beekman M, Ratnieks FLW. 2000. Long-range foraging by the honey-bee, Apis mellifera L. Funct Ecol. 14:490–496.
- Benjamin K, Domon G, Bouchard A. 2005. Vegetation composition and succession of abandoned farmland: effects of ecological, historical and spatial factors. Landsc Ecol. 20:627–647.
- Breeze TD, Bailey AP, Balcombe KG, Potts SG. 2011. Pollination services in the UK: how important are honeybees? Agric Ecosyst Environ. 142:137–143.
- Cho Y, Lee D, Bae S. 2017. Effects of vegetation structure and human impact on understory honey plant richness: implications for pollinator visitation. J Ecol Environ. 41:2–10.
- Collard SJ, Zammit C. 2006. Effects of landuse intensification on soil carbon and ecosystem services in Brigalow (Acacia harpophylla) landscapes of southeast Queensland, Australia. Agric Ecosyst Environ. 117:185–194.
- Cramer VA, Hobbs RJ, Standish RJ. 2008. What’s new about old fields? Land abandonment and ecosystem assembly. Trends Ecol Evol. 23:104–112.
- Daily G. 1997. Nature’s services. Washington (DC): Island Press.
- Daily GC. 2000. Management objectives for the protection of ecosystem services. Environ Sci Policy. 3:333–339.
- Daubenmire R. 1959. A canopy coverage method of vegetation analysis. Northwest Sci. 33:43–64.
- Di Pasquale G, Salignon M, Le Conte Y, Belzunces LP, Decourtye A, Kretzschmar A, Suchail S, Brunet J-L, Alaux C. 2013. Influence of pollen nutrition on honey bee health: do pollen quality and diversity matter? PLoS ONE. 8:e72016.
- Drinkwater MH. 1957. Field spruce in Nova Scotia. Department of Northern Affairs and Natural Resources, Forestry Branch. Forest Research Division Technical Note No. 65; 24 p, Ottawa, Canada.
- Garibaldi LA, Steffan-Dewenter I, Kremen C, Morales JM, Bommarco R, Cunningham SA, Carvalheiro LG, Chacoff NP, Dudenhöffer JH, Greenleaf SS, et al. 2004. Stability of pollination services decreases with isolation from natural areas despite honey bee visits. Ecol Lett. 14:1062–1072.
- Gilliam FS. 2007. The ecological significance of the herbaceous layer in temperate forest ecosystems. BioScience. 57:845–858.
- Hanley N, Breeze TD, Ellis C, Goulson D. 2015. Measuring the economic value of pollination services: principles, evidence and knowledge gaps. Ecosyst Serv. 14:124–132.
- Hines HM, Hendrix SD. 2005. Bumble bee (Hymenoptera: Apidae) diversity and abundance in tallgrass prairie patches: effects of local and landscape floral resources. Environ Entomol. 34:1477–1484.
- Hogg AR, Todd KW. 2007. Automated discrimination of upland and wetland using terrain derivatives. Can J Rem Sens. 33:S68–S83.
- Klein A-M, Vaissiere BE, Cane JH, Steffan-Dewenter I, Cunningham SA, Kremen C, Tscharntke T. 2007. Importance of pollinators in changing landscapes for world crops. Proc R Soc Biol Sci. 274:303–313.
- Knoche S, Lupi F. 2007. Valuing deer hunting ecosystem services from farm landscapes. Ecol Econ. 64:313–320.
- Kremen C. 2005. Managing ecosystem services: what do we need to know about their ecology? Ecol Lett. 8:468–479.
- Kremen C, Ostfeld RS. 2005. A call to ecologists: measuring, analyzing, and managing ecosystem services. Front Ecol Evol. 3:540–548.
- Kremen C, Williams NM, Aizen MA, Gemmill-Herren B, LeBuhn G, Minckley R, Packer L, Potts SG, Roulston T, Steffan-Dewenter I, et al. 2007. Pollination and other ecosystem services produced by mobile organisms: a conceptual framework for the effects of land-use change. Ecol Lett. 10:299–314.
- Kremen C, Williams NM, Bugg RL, Fay JP, Thorp RW. 2004. The area requirements of an ecosystem service: crop pollination by native bee communities in California. Ecol Lett. 7:1109–1119.
- Latif ZA, Blackburn GA. 2010. The effects of gap size on some microclimate variables during late summer and autumn in a temperate broadleaved deciduous forest. Int J Biometeorol. 54:119–129.
- Lázaro A, Hegland SJ, Totland Ø. 2008. The relationships between floral traits and specificity of pollination systems in three Scandinavian plant communities. Oecologia. 157:249–257.
- Lefrançois M-L, Beaudet M, Messier C. 2008. Crown openness as influenced by tree and site characteristics for yellow birch, sugar maple and eastern hemlock. Can J For Res. 38:488–497.
- Lonsdorf E, Kremen C, Ricketts T, Winfree R, Williams N, Greenleaf S. 2009. Modelling pollination services across agricultural landscapes. Ann Bot. 103:1589–1600.
- Martínez-Harms MJ, Balvanera P. 2012. Methods for mapping ecosystem service supply: a review. Int J Biodivers Sci Ecosyst Serv Manage. 8:17–25.
- Martínez-Harms MJ, Quijas S, Merenlender AM, Balvanera P. 2016. Enhancing ecosystem services maps combining field and environmental data. Ecosyst Serv. 22:32–40.
- Nova Scotia Department of Natural Resources. 2007. Forest ecosystem classification [accessed 2015 August 15]. https://novascotia.ca/natr/forestry/gis/forest-inventory.asp.
- NSERC-CANPOLIN. 2013. Honey and pollen plants for Canada’s beekeepers: an annotated electronic floral calendar [accessed 2015 July 21]. http://newsite.pollinator.ca/plant_canada/index.php.
- Potts SG, Biesmeijer JC, Kremen C, Neumann P, Schweiger O, Kunin WE. 2010. Global pollinator declines: trends, impacts and drivers. Trends Ecol Evol. 25:345–353.
- Potts SG, Vulliamy B, Dafni A, Ne’eman G, Willmer P. 2003. Linking bees and flowers: how do floral communities structure pollinator communities? Ecology. 84:2628–2642.
- Potts SG, Vulliamy B, Roberts S, O’Toole C, Dafni A, Ne’eman G, Willmer P. 2005. Role of nesting resources in organising diverse bee communities in a Mediterranean landscape. Ecol Entomol. 30:78–85.
- Proctor E, Nol E, Burke D, Crins WJ. 2012. Responses of insect pollinators and understory plants to silviculture in northern hardwood forests. Biodivers Conserv. 21:1703–1740.
- Requier F, Odoux J-F, Tamic T, Moreau N, Henry M, Decourtye A, Bretagnolle V. 2015. Honey bee diet in intensive farmland habitats reveals an unexpectedly high flower richness and a major role of weeds. Ecol Appl. 25:881–890.
- Ricketts TH, Regetz J, Steffan-Dewenter I, Cunningham SA, Kremen C, Bogdanski A, Gemmill-Herren B, Greenleaf SS, Klein AM, Mayfield MM, et al. 2008. Landscape effects on crop pollination services: are there general patterns? Ecol Lett. 11:499–515.
- Sader SA, Ahl D, Liou W. 1995. Accuracy of landsat-TM and GIS rule based methods for forest wetland classification in Maine. Rem Sens Environ. 53:133–144.
- Schröter M, Remme R, Sumarga E, Barton DN, Hein L. 2015. Lessons learned for spatial modelling of ecosystem services in support of ecosystem accounting. Ecosyst Serv. 13:64–69.
- Seppelt R, Dormann CF, Eppink FV, Lautenbach S, Schmidt S. 2011. A quantitative review of ecosystem service studies: approaches, shortcomings and the road ahead. J Appl Ecol. 48:630–636.
- Service Nova Scotia and Municipal Relations. 2009. Nova Scotia topographic database [accessed 2015 October 4]. https://nsgi.novascotia.ca/gdd/.
- Sharp R, Tallis HT, Ricketts T, Guerry AD, Wood SA, Chaplin-Kramer R, Nelson E, Ennaanay D, Wolny S, Olwero N, et al. 2016. InVEST 3.3.0 x86 user’s guide. The Natural Capital Project, Stanford University, University of Minnesota, The Nature Conservancy, and World Wildlife Fund.
- Smith BE, Marks PL, Gardescu S. 1993. Two hundred years of forest cover changes in Tompkins County, New York. Bull Torrey Bot Club. 120:229–247.
- Sponsler DB, Johnson RM. 2015. Honey bee success predicted by landscape composition in Ohio, USA. Peer J. 3:e838–e854.
- Steffan-Dewenter I, Kuhn A. 2003. Honey bee foraging in differentially structured landscapes. Proc R Soc Lond. 270:569–575.
- Steffan-Dewenter I, Münzenberg U, Bürger C, Thies C, Tscharntke T. 2002. Scale dependent effects of landscape context on three pollinator guilds. Ecology. 83:1421–1432.
- Tallis H, Polasky S. 2009. Mapping and valuing ecosystem services as an approach for conservation and natural resource management. Ann NY Acad Sci. 1162:265–283.
- Visscher PK, Seeley TD. 1982. Foraging strategy of honeybee colonies in a temperate deciduous forest. Ecology. 63:1790–1801.