
ABSTRACT
The value of peatlands as archives for vegetation, landscape, climate, and human history is well known, but often neglected in conservation planning. Archive value is the potential to satisfy future (yet unknown) demands for information about the past. This study aims at assessing the comparative archive value of a set of peatlands, to identify the most similar alternatives for three peatlands and to estimate the archive loss in case of their destruction. Representative cores from 49 peatlands in the region were assessed with respect to age, depth, resolution, (in)completeness, evenness, and diversity of substrates, peat accumulation status, and thickness of every single substrate type. After using cluster analysis to identify archive types and the relatedness among peatlands, the archive value of each peatland was expressed as a proportion of the total regional archive. We found candidates for compensating the three threatened peatlands, but also identified other archives of high conservation interest according to our criteria. The outcomes appeared rather robust but were determined by the criteria, resolution, and algorithms chosen. This work presents a first step towards developing an objective and consistent evaluation procedure of peatland archives, allowing the archive value to be considered in conservation and management decisions.
EDITED BY Graciela Rusch
1. Introduction
The value of peatlands as archives for vegetation, landscape, climate and human history is well known, but often neglected in land-use planning, conservation, and compensation assessment. An archive is a medium, where information is stored, ordered, and available for later use. The peatland archive down to the mineral bedrock includes the peat deposits and any underlying lake sediments (gyttja), which we together call peatland substrate types (Succow and Stegmann Citation2001; Stegmann et al. Citation2001b). Peatland archives contain a wide collection of information carriers, varying from plant macro- and microfossils, animal remains, archaeological artefacts, minerals, charcoal, volcanic ash, biochemicals, stable isotopes, and other natural or anthropogenic matter that has ended up in the peatland (Birks and Birks Citation1980; Berglund Citation1986). The stratigraphy of the deposits facilitates chronology (higher is younger) whereas the waterlogged conditions enable the preservation of organic matter. The peatland archive thus forms a multi-proxy record of the development of the peatland itself and its wide surroundings (Godwin Citation1981; Frenzel Citation1983; Barber Citation1993; Chambers et al. Citation2012), which is an important peatland ecosystem service (Millennium Ecosystem Assessment Citation2005; CICES Citation2013; Gearey and Fyfe Citation2016), and an aspect of ecosystem diversity (Joosten Citation2001). At the same time are palaeoecological archives of great importance for biodiversity conservation (Davies and Bunting Citation2010; Birks Citation2012).
Holocene climate and environmental change were first reconstructed from the stratigraphical arrangement of peat types (Rennie Citation1807; Von Chamisso Citation1824; Dau Citation1829; Steenstrup Citation1842), but since then many sophisticated methods have been developed to ‘decipher’ the information recorded in the peatland archive. It may be expected that analytical methods, information processing, international communication and cooperation, and the linking of study fields and sites will continue to progress rapidly, whereas also the questions asked about the past will change. Peatland conservation is thus challenged to select and conserve sites that will satisfy future demands for information about the past, without knowing the questions to be addressed nor the methodologies that will be available. This implies that a comparative evaluation (ranking) of peatlands with respect to their archive value must be based on (easily assessable) criteria that capture the widest possible potential information content. Ratcliffe (Citation1977) provided general criteria for assessing nature conservation value, including ‘diversity’, ‘naturalness’, ‘rarity’, ‘typicalness’ and ‘recorded history’. For archaeological sites, Deeben (Citation1999) suggested among others the criteria ‘degree of disturbance’, ‘rarity’ and ‘representativity’ Lantzsch (Citation2005) used the criteria ‘rarity’, ‘naturalness’, ‘age’, ‘type and specificity’ and ‘scientific documentation’ to arrive at a tripartition (not valuable, valuable, very valuable) in assessing the archive value of soils. Although some of these criteria may serve well for that purpose, a specific evaluation of peatland archives has not been done yet.
This study aims at assessing the comparative archive value of a set of peatlands, to identify the most similar alternatives for three threatened peatlands in the framework of a EU Habitat Directive compensation scheme and to estimate the archive loss in case of their destruction. Inherently the paper thereby addresses some issues with respect to evaluating archive value in nature conservation practice.
2. Materials and methods
Using Landgraf (Citation2007), we selected all (49) peatland basins without apparent surface in- and outflow within a 25 km radius of the three peatlands (M173, M174, M524) threatened by destruction by open cast lignite mining. The extent of the study area was based on practical considerations (accessibility, distance, political boundaries) and informed by pollen dispersal models (Theuerkauf et al. Citation2013). The landscape of the study area in the Lower Lusatia region, Northeast Germany (, Appendix A1) has been shaped by the Weichselian glaciation. The ice-sheet has upon retreat left ‘dead ice holes’ and other depressions in which peatlands have developed. The individual peatlands (mostly small and deep kettlehole mires) range in size from less than 1 ha to over 40 ha.
Figure 1. Study area: peatland region in NE-Germany. The 49 sampled peatlands are indicated as black dots.
Informed by surrounding relief, vegetation, and surface wetness we identified the deepest part of the 49 peatlands by manual coring along transects from the margin towards the centre. We collected the longest possible core (including the uppermost centimetres of the underlying sand) from each peatland using a 5 cm diameter, 50 cm long chamber corer. Each peatland was assigned a unique ID (‘Mxxx’).
The stratigraphy (vertical sequence of substrate layers) of each core was described following Stegmann et al. (Citation2001b), Succow and Stegmann (Citation2001) and Rydin and Jeglum (Citation2006). From every core the mineral soil – peat/gyttja interface was dated by pollen analysis. Sample preparation for pollen analysis included treatment with HCl and KOH, sieving (120 mm), treatment with HF, acetolysis (7 min), and mounting in silicone oil (2000 cS) (Faegri and Iversen Citation1989). Pollen was analysed with a Zeiss Axioskop light microscope with 400× magnification; larger magnifications were used for the identification of problematic grains. Pollen samples were ascribed to dated regional pollen assemblage zones (Strahl Citation2005), which allowed assignment to time spans. For further analysis, we used the youngest (minimum) age of the time span, to which each sample was ascribed.
The following peatland attributes were used to assess the information content of each single peatland/profile:
Age of the deepest (i.e. probably the oldest) organic deposit [cal BP]
Depth of peat and gyttja at the deepest point of the peatland [dm]
Resolution: depth divided by the age of the deepest organic deposit [dm ka−1]
Incompleteness: number of homogeneous, highly degraded peat layers with von Post humification score ≥ H8 [n]
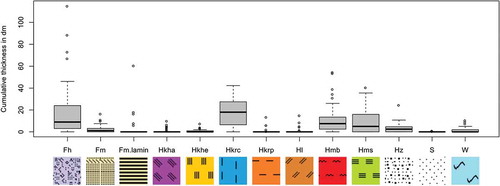
Cumulative thickness of each substrate (peat or sediment) type [dm]
Evenness: depth [dm] divided by the number of transitions from one substrate type to the next [dm trans−1]
Diversity: number of different substrate types excl. water and anthropogenic sand [n]
Recent peatland accumulation (yes or no). Peatlands were considered accumulating if they had at the coring point sufficient wetness, potentially peat forming vegetation, and no degraded peat surface layer.
As a first step each attribute was analysed separately, whereas in a further step attributes were combined. To classify peatlands according to their depth and substrate composition, we created a distance matrix (Euclidean distance) and fused the profiles step-by-step in order of smallest (most similar) to largest distance using Ward’s minimum variance method (agglomerative hierarchical clustering, Ward Citation1963; McCune et al. Citation2002). The sum of distances (dissimilarities taken from distance matrix) from one peatland to all other peatlands was taken as the measure of dissimilarity (i.e. ‘uniqueness’) of each peatland. The clustering and dissimilarity ranking were performed for total depth and all raw data of all substrate types.
After transforming the attributes to positive attributes (the more, the better), all scores for each attribute from each peatland were summed up to an overall regional score and the proportional contribution of each individual peatland to the total score for that attribute was calculated. Incompleteness was transformed to the positive attribute ‘completeness’ by subtracting the number of degraded layers from 10. The loss of regional archive value, in case one peatland is lost, was determined by summing up the 17 ‘sub losses’ relating to the 17 different attributes.
Statistical analyses were carried out in R, version 3.4.3 (R Core Team Citation2017) using package cluster (Maechler et al. Citation2018).
3. Results
The minimum age of more than 75% of the peatlands was found to be over 11 000 cal BP, more than a quarter were more than 13,670 cal BP old (). Depths ranged from 12 dm (M351) up to 161 dm (M131), with half of the peatlands being over 60 dm and 25% even over 90 dm deep. The average resolution of all profiles ranged from 1.6 to 20 dm ka−1, with a median of 5.4 dm ka−1 ().
Figure 2. Frequency distribution of (a) minimum age (n = 48), (b) depth (n = 49), (c) resolution (n = 48), (d) incompleteness (n = 49), (e) evenness (n = 49), and (f) substrate diversity (n = 49).
Figure 3. Cumulative thickness of each substrate type per profile displayed in box-and-whisker plots including colour signature used in the following figures. Fh = organic gyttja, Fm = silicate gyttja, Fm.lamin = laminated sediments, Hkha = Scheuchzeria peat, Hkhe = Eriophorum peat, Hkrc = sedge peat, Hkrp = Phragmites peat, Hl = woodpeat, Hmb = brown-moss peat, Hms = Sphagnum peat Hz = degraded peat, S = sand, W = water.
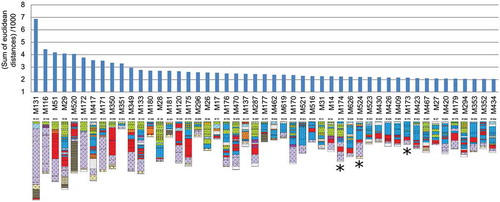
The cluster analysis divided the peatlands into deep and shallow peatlands (‘cut 1ʹ, ), and peatlands that share the same dominant substrate type (e.g. Sphagnum-peat – cluster C.A.2, sedge peat – C.A.3, and organic gyttja – C.A.4). The closest relatives (i.e. most similar peatlands) to the three threatened peatlands M173, M174 and M524 are M516, M287 and M170, respectively. The dissimilarity ranking () showed that the threatened peatlands M174, M524, and M173 (on position 33, 35, and 40, respectively) were not particularly unique. M131 at the first position had an exceptionally high dissimilarity score compared to the rest of the population.
Figure 4. Ward hierarchical clustering using cumulative thickness of 11 substrate types and peatland depth as attributes. Data not standardized. *threatened peatlands.
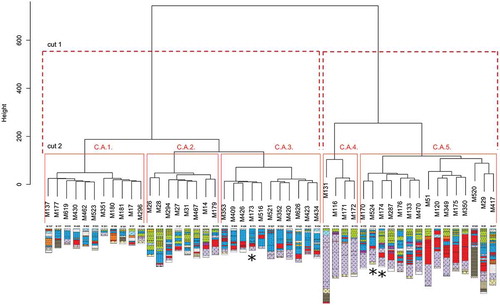
Figure 5. Dissimilarities (sum of Euclidean distances) from one peatland to all other peatlands using cumulative thicknesses of 11 substrate types and depth as attributes. *threatened peatlands.
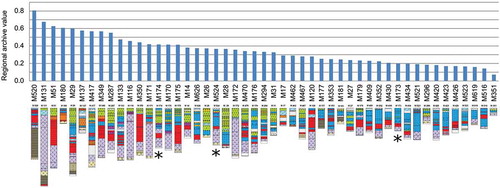
The effect of removal of each peatland from the regional archive population was presented in radar charts (). The comparative archive value was expressed as one number for each peatland by summing up the percentages of all attributes, and all peatlands were ranked according to that value in . This score is also an estimate of the regional archive loss in case of destruction of one single peatland. Here M174 ranked highest (14th position), while M524 and M173 scored rank 20 and 39, respectively.
Figure 6. Radar charts visualizing the archive loss in case the peatlands M137, M131, and the three threatened peatlands (M173, M174, M524) are removed from the total regional peatland population. Each ray represents the sum of all scores from all peatlands for that particular attribute (=100 %). Removal of M173, M174, and M524 would, for example, have no effect on the regional amount of laminated sediments (Fm.lamin), Phragmites peat (Hkrp), or wood peat (Hl), but would cause a loss of 15.48 % of Scheuchzeria peat (Hkha) and 11.45 % of Eriophorum peat (Hkhe). Divers = diversity of substrates; complete = completeness; even = evenness; resolut = resolution; min.age = minimum age; accum = accumulation status. Other abbreviations are defined in caption of . Mind the exaggerated display of scores.
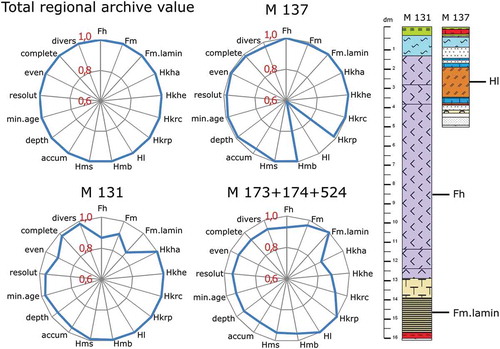
Figure 7. The archive value ranking of the 49 peatland archives (in %). Archive value (y-axis) of each peatland was determined by summing up all proportional contributions to the regional archive for 17 criteria: age, depth, resolution, accumulation status, completeness, evenness, diversity, and cumulative thickness of 10 individual substrate types. *Threatened peatlands.
4. Discussion
This is the first time that the archive value of a large population of individual peatlands is assessed based on generalised and objective criteria, independent of any research question. The exercise shows that it is possible to express the archive value of peatlands on an ordinal (A < B < C) and even on a ratio (linear) scale (e.g. C = 2B = 4A). As, however, the outcome strongly depends on the criteria, resolution, and algorithms chosen, these elements have to be critically discussed.
4.1. Single criteria
Age. Age is probably the single most important criterion to assess archive value. The more ‘time’ an archive comprises, the larger is generally the amount of information stored. Most peatlands in Lower Lusatia originated in dead ice holes in the Late Glacial, when the ice-sheet had retracted from the area (Litt et al. Citation2007). Some peatlands are, however, younger (early to mid-Holocene) and rank lower according to the age-criterion. The applied pollen dating method was sufficient for a rough temporal distinction of the peatlands. More detailed differentiation would require more datings (e.g. of transitions between substrate types).
Depth. Deeper archives contain more material, i.e. more potential information carriers. When reliable datings are not available, ‘deep’ can mean either ‘old’ or ‘well resolved’ and thus indicates quantity or quality of information. In our data set, depth correlated stronger with resolution than with age (Pearson r = 0.50, p < 0.001 and r = 0.35, p = 0.02, respectively), because the range in depth was larger than the range in age. Deeper also implies better protected, as the largest threats to the peatland archive come from the surface (drought, drainage, peat cutting, cultivation, etc.). Also resilience for water table fluctuations (‘mire oscillation’, Stegmann et al. Citation2001a) may be better in deeper peatlands (Fritz et al., Citation2008), resulting in better protection of the archive and better perspectives of mire recovery after disturbance.
Resolution. High-resolution deposits may reveal short-time dynamics. In a low-resolution profile such dynamics are masked when material from several decades, or even centuries is densely packed. Even thin layer sampling (e.g. Joosten and De Klerk Citation2007) has its limits, when signals are mixed over time or when methods require a minimum volume of material. High-resolution potential is reflected by laminated sediments (‘varves’, cf. M520, M177, and M181), which may allow absolute dating and assessing the exact duration of short term events (Birks and Birks Citation1980). However, our methodology has some restrictions: Firstly, the minimum age conservatively used results in the most optimistic score for resolution. A second problem relates to the presence of layers of water (no material in the peat corer, e.g. M17, M434) and (anthropogenic) sand. These layers without organic fossils increase the resolution score without necessarily increasing the information content. Resolution of such profiles might be better calculated from only fossil containing substrates. The presumed linear age-depth model (cf. Clymo et al. Citation1998) is disputable, when different substrate types had different accumulation rates (Couwenberg et al. Citation2001) and highly degraded layers reflect phases without peat accumulation. Moreover, as many peatlands seem not to accumulate at present, the assumption that the uppermost layers are recent may not hold. More datings will improve the resolution picture, especially when rapidly and slowly accumulated substrates occur in one profile, like in M181 where half of the profile consists of early Late Glacial laminated sediments followed by 1.5 m of strongly decomposed and compacted peat.
Cumulative substrate thickness: The peatlands were ranked according to the cumulative thickness of each of the 13 substrate types, thus revealing their regional importance for any of these types. Our substrate classification follows established groupings for field identification (Göttlich Citation1980; Succow & Joosten Citation2001). A coarser differentiation (e.g. simply as peat or gyttja) would obscure important information, whereas a more detailed one might result in a confusingly large number of types. It must, however, be clear that substrate classification strongly affects other criteria, like diversity and evenness. Among substrate types the identifiability of material and hence the amount of information differs (Göttlich Citation1980; Rydin and Jeglum Citation2006; Mauquoy and Van Geel Citation2007): single brown-moss leaves allow identification to the species level (Michaelis Citation2001), whereas sedge roots can often not be determined further (Grosse-Brauckmann Citation1972; Mauquoy and Van Geel Citation2007).
Incompleteness. Layers of highly decomposed peat may reflect little or no peat accumulation or even erosion by water or oxidation. Also the disturbance associated with layers of anthropogenic sand, as found in M524, may have caused a gap (‘hiatus’) in the palaeo-record. With improving methodologies, information from one fossil type (e.g. non-pollen palynomorphs) could to some degree fill the gaps in the record of another type (e.g. pollen, Barthelmes et al. Citation2006). Lake sediments may also be subject to erosion and re-deposition, but these processes are hard to detect in the field, whereas high-resolution pollen analysis or detailed dating to reveal hiatuses require too much effort for rapid assessment. As the thickness of strongly decomposed layers and the amount of time missing were ignored, peat profiles that differ substantially with respect to these variables may score similarly. In the end, a depositional hiatus itself is also a piece of information, a phenomenon to be addressed in further studies.
Evenness. Evenness was expressed as total depth (dm) of the profile divided by the number of transitions from one homogeneous layer to the next. Different layers constitute different archive types concerning substrate type, accumulation rate, taphonomic environment, and fossil assemblage. An even profile suggests that fossils were deposited in a constant environment, reducing the degrees of freedom for interpretation, whereas a rapidly changing stratigraphy indicates that the fossil record may have been modified by frequently changing depositional processes. Furthermore, an even profile (cf. M131, M51, M172, and M349) may allow constructing a more realistic age‒depth curve with less dating points.
Diversity. Counting the number of substrate types in each profile resulted in six categories of increasing diversity with seven profiles having nine substrate types. Whereas an even stratigraphy is better suited to study regional and extra-regional developments, uneven (heterogeneous) and diverse profiles say more about the peatland’s own history (also as a function of overarching developments). Evenness does not correlate with diversity: A profile with a low substrate diversity may be even or uneven, the latter because of repetitive alteration of a few substrate types, whereas a more uneven profile might consist of a few or of many substrate types. In our low-effort approach, the substrate types were only counted (analogue to species richness) and not processed in any biodiversity index (cf. Begon et al., Citation2006). Future approaches could test more sophisticated indices that also include the abundance (= thickness) of each substrate type and their distribution over the profile.
Recent peat accumulation. Only with the right water regime and vegetation can a peatland form peat, otherwise the archive will degrade by oxidation from the surface downwards. Therefore, we value an accumulating peatland (e.g. M173 and M174) higher than one that is continuously losing palaeo-information (e.g. M524). An accumulating peatland can be regarded as an ‘active’ archive, which continuously adds information. Although more sophisticated methods exist (e.g. gas flux measurements, Minke et al. Citation2011), vegetation and peat can function as simple, quick, and low effort proxies for assessing active peat accumulation (Couwenberg et al. Citation2011; Urbanová et al. Citation2012). However, also the conservation of peatlands that are insufficiently wet to prevent peat oxidation should not be ignored. M520, for example, is a deep, old peatland with several decimetres of laminated sediments, but dry at the surface and with deep drainage channels. In case of degrading peatlands, restoration measures should be implemented to make the gap in the palaeo-record as short as possible.
Next to the criteria discussed, size, shape and location may be important for assessing archive value of a peatland. Size and shape determine what kind of information carriers (and in which proportions) the basin receives (cf. Jacobson and Bradshaw Citation1981), and therefore optimal archive conservation should encompass a range of basin sizes and shapes. Furthermore, every location experiences a unique input of fossils (e.g. atmospheric pollen rain, Theuerkauf and Couwenberg Citation2017) meaning that the destruction of one peatland archive can only partly be compensated by other archives. Whereas cosmic or climatic phenomena can be traced in distant basins (e.g. Van Geel and Renssen Citation1998; Van Geel et al. Citation1998), information on more local phenomena can only be derived from nearby archive sources (De Klerk et al. Citation1997; Mrotzek et al. Citation2017), e.g. the local settlement history of the village of Grabko (land use etc.) will best be recorded by the peatland closest nearby, i.e. M524, Grabkoer Seewiesen.
4.2. Combined criteria
Different archives store different (types of) information. Therefore we will now take a closer look at (dis)similarities between assemblages of attributes (i.e., distances between individual peat profiles expressed as a function of cumulative thicknesses of all substrate types, and depth) and compound attributes (diversity and rarity), and their bearing on evaluation and exchangeability.
Nature conservation generally does not aim to conserve individual objects, but focuses on classes, like species or habitat types (cf. Habitats Directive, Council Citation1992). Similarly in palaeoecology every peatland differs from all others () and archive diversity is endless unless a cut-off level of discrimination is determined to arrive at more space effective conservation than ‘conserving everything’. A very simple classification would, for example, distinguish between ‘deep’ and ‘shallow’ peatlands (see above). The destruction of a protected deep peatland would then call for conserving another, hitherto not protected deep peatland. A subdivision into five clusters (‘C.A.1 – 5ʹ, i.e. cut 2) produced some clusters (e.g. C.A.1 and C.A.2) which are quite heterogeneous and could conveniently be partitioned further. Classification thus produces conceptual ‘archive types’ – analogue to ‘habitat types’ or ‘species’. The number of archive types and of individual peatlands in every type allows estimating regional peat archive diversity. A proper distinction of classes facilitates identifying high-priority archives, for example on the basis of rarity because rare types disproportionally contribute to overall diversity (cf. Ratcliffe Citation1977). Rarity is proportional to the number of members in a cluster/archive type. Cluster C.A.4 (Gyttja-type), for example, has four, cluster C.A.3 (Sedge peat-type) 11 members, making the individual peat archives in Cluster C.A.4 ‘rarer’ and more valuable. Other attributes (e.g. evenness, resolution, or age) can help deciding which peat archives within one type/group must get highest conservation priority, for example in group C.A.4 peatlands M131 and M172 because they are older than the other two members M171 and M116.
4.3. Application for compensation
In case a loss of peat archives demands equivalent compensation, clarity must be reached which traits and services must be compensated. Hierarchical cluster analysis helps to identify the next ‘relatives’, which may act as a compensation (e.g. by restoration or placing under protection) for a destroyed peatland. According to , the threatened mire M524 is rather similar to M170, the next closest relatives being M174 (another threatened mire!), M287, M176, M133, and M470. The ‘sibling’ to M173 is M516, while M174 is closest related to M287. It goes without saying, that this is only a first step to finding adequate compensation, as also other criteria may apply, e.g. distance to the destroyed peatland.
shows the peatlands in order of decreasing dissimilarity, starting with the most special peatlands on the left and ending up with the peatlands that are closest to average to the right. M131 differs most from all others in the population – because it has the largest depth, the thickest organic gyttja deposits, and laminated sediment layers (rare substrate type) – followed by other deep peatlands with extraordinary amounts of organic gyttja (M131, M116, and M172), brown-moss peat (M51), or laminated sediments (M520). Remarkably M351 made it to the 10th position, most probably because of being – as the shallowest peatland lacking many substrate types – at the outermost edge of many attribute scales. This highlights the fact, that dissimilarity scores only tell something about the degree, but not about the quality of difference. Noticeable is the rapid decrease of dissimilarity scores over the first 11 peatlands and slower changes for the rest of the population. These 11 peat archives differ strongly from all others and might therefore be of highest conservational interest. The three threatened peatlands (M173, M174, and M524) are not particularly special and closer to the population average.
4.4. Other clustering and dissimilarity approaches
In the presented results ( and ), we used depth and substrate composition as the minimum set of variables for classifying the peatland archives. Depth and substrate composition are easily accessible and necessary for assessing composite variables such as resolution, completeness, evenness and diversity. In the absence of dating, depth is furthermore an integrative indicator for age and/or resolution. The latter value would be lost by data standardisation, which is why we – as a first step – refrained from standardisation. We used Euclidean distance because other distances are not better for this particular case and because they are less ‘intuitive’, which might weaken the political argument by lack of comprehensibility for lay persons. Using Euclidean distance is, however, sensitive to zero scores (‘Double-zero-problem’, Legendre and Legendre Citation2012). Peatlands that only have the absence of substrate types in common, consequently end up closer together in a cluster dendrogram (see Cluster C.A.1). Other distance measurements avoid this deficiency, for example any ‘asymmetrical’ association coefficient (Legendre and Legendre Citation2012). The Bray-Curtis distance (Bray and Curtis Citation1957) and Gower’s coefficient (Gower Citation1971) tested as two alternatives resulted in similar but not identical clusters (results not shown).
We used hierarchical clustering to assess the relatedness of peat archives on different levels in order to identify the closest sibling to each threatened peatland and to classify archives in a way that allows estimating rarity and representativity. The results of hierarchical clustering are easy to interpret, and allow users to choose the cut-off level of discrimination (and therewith the number of clusters) a posteriori. The concrete outcome is, however, strongly determined by the choice for either a divisive (top-down) or an agglomerative (bottom-up; applied here) hierarchy as well by the method, how single sites are linked to an already existing cluster. Here we applied Ward’s method, which finds minimum-variance spherical clusters (McCune et al. Citation2002). Nevertheless, some clusters seem rather artificial and it is up to the researcher to decide on further partitioning of a cluster, which in turn has a substantial effect on regional diversity and rarity assessment.
Also the choice of attributes strongly determines the outcome of classification. In , total depth and the cumulative thicknesses of each substrate type were entered as attributes with depth having an overarching effect on differentiation. Removal of depth (not shown) and choosing a cut-off height delivering also five clusters led to (slightly) different clusters, with M173 being assigned to a cluster with 15 instead of 11 members and thus becoming ‘less rare’, whereas M524 remained similarly rare and M174 becoming rarer.
The processing of raw data opposed to using standardized data (cf. Legendre and Legendre Citation2012) results in an implicit weighting of attributes. Depth, for example, had the widest range and was therefore the dominant defining factor in . Organic gyttja, brown-moss- and sedge peat differentiated more than rare and less abundant types like Scheuchzeria-, Eriophorum-, Phragmites- and wood peat. This becomes visible in the ‘rest’-groups (C.A.1 and C.B.4), where peatlands with rare substrate types that at the same time lack more abundant types (e.g. peatmoss or brown-moss peat) group together. Weighting attributes would increase their influence on the distance matrix. Laminated gyttja could, for example, be weighted higher because of its inherent high resolution, and peatmoss peat higher than sedge peat because it grows upwards and does not mix older with younger material. For regional pollen analysis, gyttja would be the preferred substrate type, because local pollen influx in a lake is rather low (Theuerkauf and Joosten Citation2012; Theuerkauf et al., Citation2013). Substrates that occur in only a few profiles might be attributed a higher score because of inherent rarity, e.g. Scheuchzeria peat, which occurs in only ten peatlands. However, as different criteria for ranking substrate types are mutually exclusive, and we do not know the research questions of the future, we assumed equal importance of each substrate type, while allowing their range and distribution to control the clustering.
We tried various cluster algorithms including hierarchical (Ward) and non-hierarchical methods (partitioning around medoids, (Borcard et al. Citation2011), with three different predefined number of clusters suggested by three different methods) on standardized and non-standardized data using Euclidean, Bray Curtis and Gower’s distance (results not shown). In general, the non-hierarchical clustering performed least satisfying by failing to identify homogeneous clusters. Almost all hierarchical clusterings identified the same ´siblings’ to the three threatened peatlands, demonstrating the robustness of the results. Further, the analyses revealed profiles that were always clustered together and thus may represent robust archive types, e.g. the ‘deep gyttja type’ (M 131, M116, M171, and M172) or the ‘brown-moss peat type’ (M51, M120, M349, M175, and M350), but not all profiles could unambiguously be assigned to a well-defined type. The failure of a cluster algorithm to find clearly separated groups can be ascribed to the heterogeneity of the population and the absence of true discontinuities. A more satisfying allocation of indistinct profiles (which end up in ‘rest groups’) could possibly be achieved by manually reordering these profiles, but this would always involve subjectivity. Many questions thus remain open, how to arrive at an objective and repeatable classification and evaluation.
4.5. Regional archive loss
The radar charts combine all applied criteria after having standardized them to a scale from 0 to 1. Such charts present a transparent and integrated illustration of a peatland’s contribution to the regional archive (e.g. the disproportional contribution of M131 to organic gyttja, depth, and evenness or M520 for laminated sediments). The charts help visualizing what happens with each attribute in the regional population, when one or more peatlands are removed.
Many attributes were rather heterogeneously distributed. With respect to substrate types, for example, only a few peatlands had unusually high scores and thus constituted the main proportion of the regional population of that substrate type. Other attributes were more evenly distributed, i.e. the scores did not differ much from peatland to peatland (e.g. evenness, completeness, resolution, and age). Hence, not much difference is noticeable on the radar charts for these criteria, which consequently hardly determine the regional archive value of an individual peatland. The effect of rare and heterogeneous attributes becomes visible in archive loss ranking (), where peatlands with exceptional regional importance for laminated sediments (M520, M131), depth and gyttja (M131), brown-moss and Phragmites peat (M51), and/or wood peat (M137, M417) made it to the front, often regardless of their age (e.g. M137). Since age and resolution have no substantial effect on the total archive value, the score for M177 (no age data available) was set to zero in order to be able to include this peatland in the analysis.
An alternative to overcome discrepancies between attributes would be to use a non-linear (e.g. logarithmic) scale for data with few very high scores, or transforming the scores of variables that are rather similar, e.g. by squaring, which would give higher scores an even higher importance. This would also meet the intuitive concern, that two ‘half good’ peatlands are in terms of information value not the same as one ‘entirely good’, e.g. two 5 m deep or two 5000 years old peatlands not equal to one 10 m deep or one 10,000 years old peatland. The resolution and range of data must therefore be treated with utmost care and should be a focus of attention when further developing this method.
Whereas all criteria were considered of equal importance, scores of different criteria could also be weighted differently. The age of an old peatland, for example, seems more important than the amount of wood peat (because the age criterion is more neutral/independent of the research question). Future studies should address this unequal appreciation of archive attributes, its backgrounds, and its consequences for the overall archive value. An alternative way for aggregation would be the step-by-step evaluation (decision tree), as suggested by Deeben (Citation1999).
Some criteria that seem relevant for assessing archive value lack suitable measures and easy assessment methods, e.g. for the detection of hiatuses to estimate completeness. Furthermore, the attributes considered have been treated as independent which in reality they may not be, e.g. organic gyttja is highly correlating with depth (Pearson correlation coefficient 0.72) and evenness (0.78), whereas correlations between all other attributes were weak (<0.70). Assessing correlations between attributes would allow for a more time- and cost-effective assessment of archive value. Continuous variables may be transformed into discrete classes, which would allow handling uneven, non-normally distributed data (e.g. depth, substrate types, and age, cf. Deeben (Citation1999)), but would introduce extra subjectivity in the analysis.
As the archive value of each peatland was measured relative to the regional population, the nature of the latter has a substantial effect: What would happen to the archive value of the remaining peatlands if one, two, or more peatlands were removed? A loss of the first of 18 peatlands of the oldest age class does clearly not equal the loss of the last one of this class. On the other hand, as all 49 peatlands are to some degree alike (with respect to location, stratigraphy, or age) they are likely to store overlapping information. Thus the total regional peat archive contains redundant data, which in principle could be removed without reducing the total regional information content (cf. ‘data compression’ in information theory, MacKay Citation2003). Assuming redundancy in the regional peat archive, a loss of 10% of the regional archive (destruction of a few peat archives) would not necessarily imply the loss of 10% of the regional palaeo-information. Nevertheless it reduces the number of back-ups and increases the risk of information loss. Hence cumulating the archive value of 49 peatlands to a total regional archive seems tolerable, though the applied linearity is disputable, because with every replicate the added value decreases. Proving redundancy is in fact impossible, because perceived redundancy is strongly related to our present-day knowledge. What seems a mere replicate today might reveal its essential function tomorrow, as the example of ‘junk’ DNA (another natural information storage) of which the functions are slowly being discovered shows (Biémont and Vieira Citation2006; Carey Citation2015).
Thus, as future demands for information are unknown a precautionary approach to archive conservation implies the conservation of as many archives as reasonably possible (cf. Joosten and Clarke Citation2002). This principle is supported by the consideration that extracting palaeoecological information from a peatland often implies the partial destruction of the archive. Whereas the development and application of non-destructive research methods are increasing (cf. Grosjean et al. Citation2014; Dommain et al. Citation2015) palaeoecology is still – like archaeology (Reich Citation1987) – in essence a ‘destructive science’. Diminishing the number of research sites furthermore concentrates field research on the remaining sites where it will increase disturbance frequency. Another argument for conserving as many archives as possible is that some research questions can only be answered by investigating a phenomenon simultaneously from many viewpoints, for example the migration of plant taxa after deglaciation. The availability of several sites with synchronous layers facilitates synopsis and abstraction (e.g. in Theuerkauf and Joosten Citation2009, Citation2012; Theuerkauf et al. Citation2014).
The applied procedure to extract and analyse one core at the deepest part of the peatland implies a severe reduction and abstraction as the stratigraphy (and hence attributes like evenness, diversity, peat and gyttja depths) within one and the same peatland may vary strongly, e.g. in terrestrialization mires with a rest lake (M171, M116, and M131). As a result a peat core at the peatland centre may not be representative for the entire peatland (cf. for kettlehole mires: Timmermann and Succow Citation2001).
4.6. Conclusions
This study assessed the comparative archive value of 49 peatlands in a region by applying cluster and dissimilarity analysis on a variety of simply and rapidly measurable criteria. The results indicate that, also when using a selection of criteria and various algorithms, rather robust results can be obtained. The choice of criteria (and their scores, resolution, class limits, and weights), however, does affect the outcome (ranking of peatlands), sometimes even substantially. The combination of criteria chosen appeared to give results that correspond more with intuitive preferences than those using individual criteria, although some criteria seem more important than others (cf. age vs. wood peat). Such perceived inequalities should be further analysed and must – if justifiable – be addressed, e.g. by differential weighting of the relevant attributes.
The question whether an archive contains valuable or redundant information cannot be separated from the research topic, the available methods, and the capability to interpret data in a meaningful way. Hence the peat archive only contains potential information, which makes archive evaluation even more challenging.
The radar charts make clear, that the destruction of every individual peatland reduces the overall regional peat archive and results in a loss of potential information, no matter how shallow, young, or degraded the peatland is. The loss of some peatland archives, however, creates a larger ‘gap’ than that of others. But here again the ranking of archive loss must be approached with critical awareness, since its degree is highly sensitive to the (subjectively chosen) attributes, resolution, and algorithms, as the three threatened peatlands M173, M174, and M524 illustrate. The question to what extent a loss of archive implies a loss of information must urgently be addressed in future theoretical analysis.
This work contributes to the assessment of damage and loss associated with peatland degradation and destruction. It presents a first step towards a sound methodology for comparing the hitherto neglected archive value of peatlands and facilitates considering this value in conservation and compensation practice. We tested a number of attributes as evaluation criteria, most of which are already appreciated in palaeoecology and conservation, e.g. age, resolution and rarity. We demonstrated thereby the possibility to assess a peatland archive objectively and independent of a research question. We also showed different approaches to assess rarity and regional archive diversity (cluster analysis), ‘uniqueness’ (dissimilarity ranking) and to combine criteria to estimate and visualize a total value (regional archive value, radar charts). But it is clear that our approaches need further improvement, e.g. by better addressing selection and sensitivity of criteria, resolution, and algorithms as well as the theoretical basis of valuing information.
Data accessibility
Detailed peatland stratigraphies of the 49 coring points are stored at PANGAEA https://doi.org/10.1594/PANGAEA.894585 (Greiser & Joosten, 2018).
Supplementary Material
Download PDF (1.3 MB)Supplementary Material
Download PDF (792.3 KB)Acknowledgments
The authors thank the members of the Greifswald Peatland and Palaeoecology team, and especially Martin Theuerkauf, John Couwenberg, Almut Mrotzek, Annie Wojatschke, and Andreas Olsson for valuable comments and ideas, Pim de Klerk for support in interpreting the pollen data, and all assistants, which enabled the extensive field work. Comments from two anonymous reviewers have improved the manuscript.
Disclosure statement
No potential conflict of interest was reported by the authors.
Related Research Data
References
- Barber KE. 1993. Peatlands as scientific archives of past biodiversity. Biodivers Conserv. 2(5):474–489.
- Barthelmes A, Prager A, Joosten H. 2006. Palaeoecological analysis of Alnus wood peats with special attention to non-pollen palynomorphs. Rev Palaeobot Palynol. 141(1–2):33–51.
- Begon M, Townsend CR, Harper JL. 2006. Ecology: From individuals to ecosystems. 4th ed. Oxford: Wiley-Blackwell.
- Berglund BE, editor. 1986. Handbook of Holocene palaeoecology and palaeohydrology. New York (NY): Wiley.
- Biémont C, Vieira C. 2006. Junk DNA as an evolutionary force. Nature. 443:521–524.
- Birks HJB. 2012. Ecological palaeoecology and conservation biology: controversies, challenges, and compromises. Int J Biodivers Sci Ecosyst Serv Manag. 8(4):292–304.
- Birks HJB, Birks HH. 1980. Quaternary palaeoecology. London: Edward Arnold.
- Borcard D, Gillet F, Legendre P. 2011. Numerical Ecology with R (Use R!). In: Gentleman R, Hornik K, Parmigiani GG, editors. New York (NY): Springer.
- Bray JR, Curtis JT. 1957. An ordination of the upland forest communities of southern Wisconsin. Ecol Monogr. 27(4):325–349.
- Carey N. 2015. Junk DNA: a journey through the dark matter of the genome. London: Icon Books Ltd.
- Chambers FM, Booth RK, De Vleeschouwer F, Lamentowicz M, Le Roux G, Mauquoy D, Nichols JE, van Geel B. 2012. Development and refinement of proxy-climate indicators from peats. Quat Int. 268:21–33.
- CICES. 2013. CICES-V4-3 ecosystem service classification [accessed 2017 Jul 25]. http://cices.eu/
- Clymo RS, Turunen J, Tolonen K. 1998. Carbon accumulation in peatland. Oikos. 81(2):368–388.
- Council. 1992. Council Directive 92/43/EEC on the Conservation of natural habitats and of wild fauna and flora. [accessed 2017 Jul 25]. http://eur-lex.europa.eu/LexUriServ/LexUriServ.do?uri=OJ:L:1992:206:0007:0050:EN:PDF
- Couwenberg J, De Klerk P, Endtmann E, Joosten H, Michaelis D. 2001. Hydrogenetische Moortypen in der Zeit – eine Zusammenschau. In: Succow M, Joosten H, editors. Landschaftsökologische Moorkunde. Stuttgart: Schweizerbart; p. 399–403.
- Couwenberg J, Thiele A, Tanneberger F, Augustin J, Bärisch S, Dubovik D, Liashchynskaya N, Michaelis D, Minke M, Skuratovich A, et al. 2011. Assessing greenhouse gas emissions from peatlands using vegetation as a proxy. Hydrobiologia. 674(1):67–89.
- Dau JHC. 1829. Die Torfmoore Seelands. Kopenhagen (Leipzig): Gyhlendahl und Hinrichs; p. 1–316. German
- Davies AL, Bunting MJ. 2010. Applications of palaeoecology in conservation. Open Ecol J. 3(2):54–67.
- De Klerk P, Janssen CR, Joosten H. 1997. Patterns and processes in natural wetland vegetation in the Dutch fluvial area: a paleoecological study. Acta Bot Neerl. 46(2):147–159.
- Deeben J. 1999. Proposals for a practical system of significance evaluation in archaeological heritage management. Eur J Archaeol. 2(2):177–199.
- Dommain R, Cobb AR, Joosten H, Glaser PH, Chua AFL, Gandois L, Kay F-M, Noren A, Salim KA, Su’ut NS, et al. 2015. Forest dynamics and tip-up pools drive pulses of high carbon accumulation rates in a tropical peat dome in Borneo (Southeast Asia). J Geophys Res Biogeosciences. 120(4):617–640.
- Faegri K, Iversen J. 1989. Textbook of pollen analysis. revised by Faegri, K., Kaland, P.E., Krzywinski, K. New York: Wiley.
- Frenzel B. 1983. Mires - repositories of climatic information or self-perpetuating ecosystems? In: Gore AJ, editor. Ecosystems of the World 4A. Mires: swamp, bog, fen an moor. Amsterdam: Elsevier; p. 35–65.
- Fritz C, Campbell DI, Schipper LA. 2008. Oscillating peat surface levels in a restiad peatland, New zealand - magnitude and spatiotemporal variability. Hydrol Process. 22(17):3264–3274.
- Gearey B, Fyfe R. 2016. Peatlands as knowledge archives. In: Bonn A, Allott T, Evans M, Joosten H, Stoneman R, editors. Peatland restoration and ecosystem services. Science, policy and practice. Cambridge: Cambridge University Press; p. 95–113.
- Godwin H. 1981. The archives of peat bogs. Cambridge: Cambridge University Press.
- Göttlich K. 1980. Moor- und Torfkunde. Stuttgart: Schweizerbart.
- Gower JC. 1971. A general coefficient of similarity and some of its properties. Biometrics. 27(4):857–871.
- Grosjean M, Amann B, Butz C, Rein B, Tylmann W. 2014. Hyperspectral imaging: a novel, nondestructive method for investigating subannual sediment structures and composition. Past Glob Chang. 22(1):10–11.
- Grosse-Brauckmann G. 1972. Über pflanzliche Makrofossilien mitteleuropäischer Torfe. 1. Gewebereste krautiger Pflanzen und ihre Merkmale. Telma. 2(2):29–55.
- Jacobson GL, Bradshaw RHW. 1981. The selection of sites for palaeovegetational studies. Quat Res. 16(1):80–96.
- Joosten H 2001. Identifying peatlands of international biodiversity importance [accessed 2013 Apr 10] http://www.imcg.net/pages/publications/papers/identifying-peatlands-of-international-biodiversity-importance.php?lang=EN.
- Joosten H, Clarke D. 2002. Wise use of mires and peatlands. Saarijärvi: International Mire Conservation Group and International Peat Society.
- Joosten H, De Klerk P. 2007. DAMOCLES: a DAshing MOnolith Cutter for fine sectioning of peats and sediments into LargE Slices. Boreas. 36(1):76–81.
- Landgraf L. 2007. Zustand und Zukunft der Arm- und Zwischenmoore in Brandenburg. Bewertung und Bilanz. Naturschutz und Landschaftspfl Brand. 16(4):104–115.
- Lantzsch P 2005. Böden als Archive der Natur-und Kulturgeschichte. Ein Beitrag zur Darstellung der Archivfunktionen von Böden in Brandenburg. Fachbeiträge des Landesumweltamtes. 99.
- Legendre P, Legendre L. 2012. Numerical ecology. 3rd ed. Amsterdam: Elsevier.
- Litt T, Behre K-E, Meyer K-D, Stephan H-J, Wansa S. 2007. Stratigraphische Begriffe für das Quartär des norddeutschen Vereisungsgebietes. Eiszeitalter und Gegenwart (Quaternary Sci Journal). 56(1–2):7–65.
- MacKay DJC. 2003. Information theory, inference and learning algorithms. Cambridge: Cambridge University Press.
- Maechler M, Rousseeuw P, Struyf A, Hubert M, Hornik K 2018. cluster: cluster analysis basics and extensions. R package version 2.0.7-1.
- Mauquoy D, Van Geel B. 2007. Plant macrofossil methods and studies: mire and peat macros. In: Elias SA, editor. Encyclopedia of quaternary science. Amsterdam: Elsevier; p. 2315–2336.
- McCune B, Grace JB, Urban DL. 2002. Analysis of ecological communities (Vol. 28). Gleneden Beach (OR): MjM software design.
- Michaelis D. 2001. Schlüssel zur Bestimmung von Braunmoosen aus Torfen anhand einzelner Blättchen [Key for the identification of brown mosses from peat based on single leaves]. Telma. 31(31):79–104.
- Millennium Ecosystem Assessment. 2005. Ecosystems and human well-being : current state and trends, Vol 1. Washington DC: Island Press.
- Minke M, Chuvashova H, Burlo A, Yarmashuk T, Augustin J. 2011. Measuring GHG emissions from peatlands. In: Tanneberger F, Wichtmann W, editors. Carbon Credits from Peatland rewetting: climate-biodiversity-land use. Stuttgart: Schweizerbart; p. 30–36.
- Mrotzek A, Couwenberg J, Theuerkauf M, Joosten H. 2017. MARCO POLO – A new and simple tool for pollen-based stand-scale vegetation reconstruction. Holocene. 27(3):321–330.
- R Core Team. 2017. R: A language and environment for statistical computing. Vienna: R Foundation for Statistical Computing.
- Ratcliffe DA, editor. 1977. A nature conservation review. Cambridge: Cambridge University Press.
- Reich R 1987. The archaeologist’s dilemma: on some aspects of achaeology as a “destructive” scientific discipline. Symposium Paper. Washington DC: International Council on Monuments and Sites (ICOMOS), 8th General assembly and International Symposium “Old Cultures in New Worlds”; p. 1009–1015.
- Rennie R. 1807. Essays on the natural history and origin of peat moss. Edinburgh: Archibald Constable.
- Rydin H, Jeglum J. 2006. The biology of peatlands. Oxford: Oxford University Press.
- Steenstrup JJS. 1842. Geognostisk-geologisk undersögelse af skovmoserne Vidnesdam- og Lillemose i det nordlige Sjelland. Det K Danske Vidensk Selsk Naturvidenskablige og Math Afh. 9:17–120.
- Stegmann H, Edom F, Koska I. 2001a. Bodenkundliche Betrachtung von Mooren. In: Succow M, Joosten H, editors. Landschaftsökologische Moorkunde. Stuttgart: Schweizerbart; p. 41–47.
- Stegmann H, Succow M, Zeitz J. 2001b. Muddearten. In: Succow M, Joosten H, editors. Landschaftsökologische Moorkunde. Stuttgart: Schweizerbart; p. 62–65.
- Strahl J. 2005. Zur Pollenstratigraphie des Weichselspätglazials von Berlin-Brandenburg [On the palynostratigraphy of the Late Weichselian in Berlin-Brandenburg]. Brand Geowissenschaftliche Beiträge. 12(1–2):87–112.
- Succow M, Stegmann H. 2001. Torfarten. In: Succow M, Joosten H, editors. Landschaftsökologische Moorkunde. 2nd ed. Stuttgart: Schweizerbart; p. 58–62.
- Theuerkauf M, Bos JAA, Jahns S, Janke W, Kuparinen A, Stebich M, Joosten H. 2014. Corylus expansion and persistent openness in the early Holocene vegetation of northern central Europe. Quat Sci Rev. 90:183–198.
- Theuerkauf M, Couwenberg J. 2017. The extended downscaling approach: A new R-tool for pollen-based reconstruction of vegetation patterns. Holocene. 27(8):1252–1258.
- Theuerkauf M, Joosten H. 2009. Substrate dependency of Lateglacial forests in north-east Germany : untangling vegetation patterns, ecological amplitudes and pollen dispersal in the past by downscaling regional pollen. J Biogeogr. 36(5):942–953.
- Theuerkauf M, Joosten H. 2012. Younger Dryas cold stage vegetation patterns of central Europe - climate, soil and relief controls. Boreas. 41(3):391–407.
- Theuerkauf M, Kuparinen A, Joosten H. 2013. Pollen productivity estimates strongly depend on assumed pollen dispersal. The Holocene. 23(1):14–24.
- Timmermann T, Succow M. 2001. Kesselmoore. In: Succow M, Joosten H, editors. Landschaftsökologische Moorkunde. 2nd ed. Stuttgart: Schweizerbart; p. 379–390.
- Urbanová Z, Picek T, Hájek T, Bufková I, Tuittila ES. 2012. Vegetation and carbon gas dynamics under a changed hydrological regime in central European peatlands. Plant Ecol Divers. 5(1):89–103.
- Van Geel B, Renssen H. 1998. Abrupt climate change around 2650 BP in North-West Europe: evidence for climatic teleconnections and a tentative explanation. In: Issar A, Brown N, editors. Water, environment and society in times of climatic change. Dordrecht: Kluwer; p. 21–41.
- Van Geel B, Van Der Plicht J, Kilian MR, Klaver ER, Kouwenberg JHM, Renssen H, Reynaud-Farrera I, Waterbolk HT. 1998. The sharp rise of Delta C-14 ca. 800 cal BC: possible causes, related climatic teleconnections and the impact on human environments. Radiocarbon. 40(1):535–550.
- Von Chamisso A. 1824. Untersuchung eines Torfmoors bei Greifswald und ein Blick auf die Insel Rügen. Karsten Archiv für Bergbau und Hüttenwesen. 8(1):129–139.
- Ward JH. 1963. Hierarchical grouping to optimize an objective function. J Am Stat Assoc. 58(301):236–244.