
Abstract
The aim of this study was to screen and optimize γ-aminobutyric acid (GABA) production from Monascus sanguineus. Different agro-waste residues were screened for GABA production. The GABA yield was confirmed by thin-layer chromatography and mass spectrometry. GABA was quantified using the simple ninhydrin protocol. Plackett–Burman and response surface methodology (RSM) as statistical tools were applied for screening and optimization of GABA yield. The accuracy of the RSM model was demonstrated by generating a non-statistical model using artificial neural network methodology. Coconut oil cake was the best substrate for GABA yield of all the tested substrates. Monosodium glutamate (MSG), pH and incubation period were found to favour GABA production. Maximum yield predicted from the RSM model was 15.53 mg/gds with an MSG concentration of 0.05 g at pH 7.5 and an incubation period of 20 days. This study considered an unexplored Monascus sp., M. sanguineus, which has primarily been used for pigment production. The capability of producing GABA from M. sanguineus using coconut oil cake as a substrate is an economical method with potential industrial use. The convincing results from this work could be considered as a benchmark for exploiting the Monascus strain to obtain GABA-enriched functional food for human consumption.
Introduction
Gamma-aminobutyric acid (GABA), a non-protein amino acid, has a major role as an inhibitory neurotransmitter in mammalian nervous systems. GABA also has several other physiological functions, such as anti-epilepsy and hypotensive effects, tranquilizing excitation, enhancing memory and regulating hormone secretion (Lu et al. Citation2009). Because it has properties that are beneficial to health, the current focus of research is on enhancing GABA production. Demand for GABA-enriched foods has increased and several attempts have been made to develop functional foods with a high GABA content. These include fermented food products made from lactic acid bacteria, such as cheese (Nomura et al. Citation1998), tempeh-type fermented soya beans, Korean kimchi and yogurt (Aoki et al. Citation2003). GABA is also widely distributed in nature, including in beansprouts, soya bean seedlings, tea leaves, grain germs and microorganisms (Panatda et al. Citation2010). Many microorganisms have been isolated and screened for GABA production, such as Monascus, Rhizopus, Lactobacillus paracasei, Lactobacillus brevis, Lactococcus lactis and Streptococcus thermophilus (Qian Citation2013). Monascus strains are known to produce secondary metabolites that are beneficial to health, along with a red pigment. Traditionally, three strains, Monascus purpureus, Monascus ruber and Monascus pilosus, have been used for centuries in fermentation and the food industry in East Asia (Sun et al. Citation2008).
Biosynthesis methods for GABA production can be more encouraging than chemical synthesis methods since they have a simple reaction procedure, high catalytic efficiency, mild reaction conditions and good environmental compatibility (Huang et al. Citation2007). They involve the bioconversion of decarboxylating glutamate to GABA, catalysed by the enzyme glutamate decarboxylase (GAD). Various techniques such as immobilized cell technology, sourdough fermentation and batch fermentation methods have been used for GABA production from microbial sources, and fermentation factors such as pH, temperature, cultivation time and media additives in the culture are considered to be of key importance for optimizing the GABA yield (Dhakal et al. Citation2012).
Plackett–Burman combined with response surface methodology (RSM) is a very effective statistical tool for screening and optimizing the process for biological yield. RSM can be articulated in terms of a mathematical function using experimental design, deduction of algorithm and system analysis (Sun et al. Citation2008). The most commonly used approximating functions in the model-building stage of RSM are quadratic polynomials, which are sometimes unable to represent a given relationship to the desired degree of accuracy. A non-statistical, machine-learning based model, such as an artificial neural network (ANN), can be used to attain the desired level of accuracy by training it on experimental data (Chhatpar et al. Citation2003). This is an information processing concept inspired by biological nervous systems, similar to the brain. An ANN is an interconnected structure consisting of many simple processing elements capable of performing parallel computation for data processing. The fundamental processing element of an ANN (the artificial neuron, unit or nodes) simulates the basic functions of biological neurons (Basri et al. Citation2007).
The present study was planned to explore Monascus sanguineus for the production of GABA. The presence of GABA as a secondary metabolite was confirmed by thin-layer chromatography (TLC) and mass spectrometry (MS). Solid substrates of agro-waste residues were screened for GABA production and GABA content was estimated with the simple ninhydrin method. The best substrate, i.e. coconut oil cake, which produced the largest quantity of GABA, was chosen for further study. For optimization of the GABA yield, statistical as well as computational models were developed. Plackett–Burman design and RSM were applied for statistical modelling. The results were authenticated by a computational model developed using ANN methodology.
Materials and methods
Culture
Monascus sanguineus was isolated from spoiled pomegranate. Potato dextrose agar medium was used to maintain the isolated strain and the strain was incubated at room temperature (30°C) for 1 week (Dikshit & Tallapragada Citation2013).
Inoculum preparation
The spores from 5-day-old sporulated culture were scraped off and appropriately diluted in 90% saline water to prepare a suspension.
Solid-state fermentation for GABA production
Screening of substrates for GABA synthesis was done with different agro-waste residues, i.e. wheat bran, tamarind seed, coconut oil cake and jack fruit seed. Five grams of each substrate was taken separately and placed in a 250 ml conical flask to which 30 ml of basal medium was added. The basal medium comprised 100 g dextrose, 2 g KNO3, 10 g peptone, 2 g NH4 H2PO4, 0.5 g MgSO4.7H2O and 0.1 g CaCl2.2H2O in 1000 ml distilled water. The medium was adjusted to pH 6.0 (Dikshit & Tallapragada Citation2013).
Thin-layer chromatography and mass spectrometry for confirmation of GABA
Confirmation of the presence of GABA from M. sanguineus extracts was done by TLC. Ten microlitres of extract along with GABA standard (Sigma Aldrich, Bengaluru, India) was spotted on silica gel 60F254 aluminium sheets (Merck, Darmstadt, Germany). n-Butanol:acetic acid:water (5:3:2, v/v) was used as the mobile phase (Ting et al. Citation2010). MS analysis was carried using a 250 × 4.6 mm ID Lichrosper® 100 C18 column with particle size 5 μm, loop injector of 20 μl and Shimadzu CLASS-VP version 5.032 software. The mobile phase was acetonitrile/water (65:35 v/v and pH 3.5). The flow rate was set to 1.0 ml/min and detection was carried out using a wavelength of 235 nm by an ultraviolet detector (SPD10A VP) (Panatda et al. Citation2010).
Extraction and calorimetric estimation of GABA
Extraction of GABA was carried out as per the protocol described by Su et al. (Citation2003), with minor modifications. Fermented substrate (1 g) was placed in 10 ml of 60% ethanol and kept in a shaker incubator for 24 h at 180 rpm and 30°C. Whatman filter paper was used to filter the content and filtrate was centrifuged at 3000 × g for 5 min. The concentration of filtrate was increased at reduced pressure and the sample was applied on a TLC sheet. Purified spots from TLC were scraped and placed into glass tubes, to which 3 ml of borate buffer (pH 7) and 0.5 ml of ninhydrin solution (2% w/v prepared in acetone) were added. The solution was then allowed to heat in a water bath at 85 ± 5°C for 20 min. After cooling, 2 ml of 50% ethanol was added to the tubes. The absorbance was measured at 570 nm against a blank prepared simultaneously without ninhydrin solution. Different concentrations of standard GABA were prepared and estimated by the above-mentioned protocol (Hosseinimehr et al. Citation2010).
Plackett–Burman design for screening of parameters
The Plackett–Burman design was incorporated in the study to screen physical and nutritional parameters for GABA synthesis. Since coconut oil cake was found to be the most suitable substrate for GABA production, it was used as a substrate for screening other parameters to improve GABA yield. Seven factors were assessed, i.e. pH, incubation period and inoculum size as physical parameters, and dextrose, malt extract, monosodium glutamate (MSG) and ammonium sulphate as nutritional parameters. All parameters were taken at two levels: either positive or negative ().
Table 1. Parameters and their levels with significance levels.
The Plackett–Burman technique (Plackett & Burman Citation1946) allows the assessment of N variables in N + 1 experiments, with the assumption that there are no interaction effects between the media components (Kammoun et al. Citation2008). Taking advantage of this fact, the Plackett–Burman design was applied for the screening of these seven parameters and only eight runs were carried out. According to the design constraints, the interaction effects of the media components were ignored and only the linear effects were considered. The design is represented by the following first order polynomial equation:
(1)
where α0 is the model coefficient, βi are the linear coefficients, xi are the variables, and n is the number of media components (seven media components for this study). Each of the media components was represented at two levels, one high (represented by a positive sign in ) and one low (represented by a negative sign in ).
The effect of each of the media components was calculated by the following equation:
(2)
where the first term of the numerator denotes the summation of the response values at a positive (high) level, the second term is the summation of the response values at a negative (low) level, and N is the number of runs carried out.
Experimental design (response surface methodology)
A set of 20 experiments was planned, with each variable at five levels (). The relations between the coded values and actual values, independent variable and response were calculated according to the second order quadratic model (). The relative effects of two variables on the response were examined from three-dimensional (3D) contour plots. MATLAB® software was used for the regression and graphical analysis of the experimental data and to analyse the response surface and contour plots. Analysis of variance (ANOVA) was used to estimate the statistical parameters (Dikshit & Tallapragada Citation2014).
Table 2. Experimental range and levels of the independent variables.
Table 3. Central composite design of factors in coded value for γ-aminobutyric acid (GABA) yield (mg/gds).
Computational model (artificial neural network)
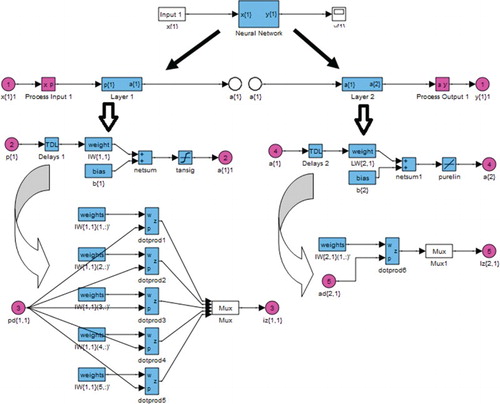
The most common architecture of ANNs, i.e. the multilayer feedforward network, was chosen to build a predictive network model, with an elementary neuron having three variables as an input (as in the RSM model) and GABA yield as the output of the model. In this set-up the data always flow in the forward direction, i.e. from the input layer to the output layer. A real number, known as a weight, is an adjustable parameter of the network and is associated with the connection of two neurons. The elementary neuron layer introduces the input data to the hidden layer via weights. Based on their performance, five neurons were selected for this layer. The neurons in the middle hidden layer perform two tasks. First, they sum up the inputs to neurons, multiplied by their weights, with bias as shown in the following equation:
(3)
where xi are the inputs, wi are the weights, n is the number of inputs, and b is the added bias.
The summed output is then passed through an activation function. The space in the non-linearity of the input data is shifted by this activation function. The hyperbolic tangent sigmoid transfer function is used in this network, expressed by the following equation:
(4)
The output produced by this hidden layer becomes an input to the second (output) layer. The neurons in that layer then produce the final output using the same procedure as explained above. To find the error between the experimental output and the calculated output, an error function is formulated. The mean squared error function is used for this model. This prespecified error function is minimized by adjusting the weights appropriately by an iterative process known as training the network. This uses the back-propagation rule, where the error between the results of the output neurons and the actual outputs is calculated and propagated backwards through the network. The flow diagram in the Simulink® toolbox of the MATLAB software package used for developing the network is shown in . Twelve randomly selected experiments out of the 20 experiments listed in were used to train the network, four experiments were used to test the network and the remaining four were used to validate the network (Desai et al. Citation2008).
Figure 1. Flow diagram of the developed Simulink model for the feedforward back-propagation artificial neural network.
Results and discussion
Screening of substrates
The use of synthetic media on an industrial scale for the production of bioactive compounds from microbial sources is not economical as far as the cost is concerned. Therefore, the development of low-cost processes is necessary. Keeping this in mind, various agro-waste residues were screened; among these, coconut oil cake gave the maximum yield (7.74 mg/gds), followed by jack fruit seed (6.96 mg/gds) and wheat bran (6 mg/gds), while the yield obtained from tamarind seeds was low (2.12 mg/gds).
Confirmation of GABA production with thin-layer chromatography and mass spectrometry
GABA production from M. sanguineus was confirmed by TLC. All fermented substrates along with the GABA standard had the same retention factor (0.54). Maximum yield samples were analysed by MS. GABA has an elemental composition of C4H9NO2 (parent ion M+ 103, calculated 103.12) and this was corroborated by the liquid chromatography–MS results, which revealed the m/z for GABA to be 104. The calculated value of mass by charge for GABA (M+ + H+) was 104.80 ().
Figure 2. Chromatogram of mass spectra (m/z) for confirmation of γ-aminobutyric acid (GABA).
Calorimetric estimation of GABA
The ninhydrin reaction is one of the most important procedures used to detect amino acids in a sample. Amino acids with a free α-amino group can react with excess ninhydrin and develop a Ruhemann's purple coloured compound. Absorbance of this compound is observed at 570 nm. GABA is a free-moving amino acid, which is mostly found in zwitterions with a deprotonated carboxyl group and protonated amino group. The proposed reaction is presented in . Among the protocols available in the literature, estimation of the GABA concentration in the sample by high-performance liquid chromatography (Sun et al. Citation2008; Donghua et al. Citation2011) is quite cumbersome and expensive. Ninhydrin-based estimation of GABA is a very cost-effective, simple and precise protocol. Hosseinimehr et al. (Citation2010) reported a similar ninhydrin procedure for the estimation of baclofen, which is an analogue of GABA. The same protocol was applied by Bali and Gaur (Citation2011) for the estimation of pregabalin, another analogue of GABA.
Figure 3. Proposed reaction of γ-aminobutyric acid (GABA) utilizing the ninhydrin protocol: (1) ninhydrin; (2) ninhydrin hydrate; (3) 1,2,3-indantrione; (4) ketimine; (5) 2-amino-1,3-indandione; (6) chromophore (Ruhemann's purple).
Identification of significant variables by Plackett–Burman design
The Plackett–Burman design was used for screening the parameters (physical and nutritional) to find the significant one. The significance of the variables on GABA synthesis was analysed with the help of t values. The results revealed that only incubation period, MSG and pH had positive effects on the GABA yield, whereas the other variables had negative effects ().
The α-decarboxylation of L-glutamic acid is a primary step in GABA synthesis and this reaction is catalysed by GAD (Reed et al. Citation2002). The present findings suggest that an appropriate amount of MSG can stimulate GABA production. Some authors have also reported that GAD activity can be regulated through glutamate in the substrate (Scott-Taggart et al. Citation1999; Sun et al. Citation2008). Furthermore, ammonium sulphate, CaCl2, dextrose and inoculum size gave negative t values, which suggests that GAD activity can be increased by sulphate and Ca ions, but only at certain concentrations, otherwise they may act as inhibitors. GAD activity is rapidly stimulated by increasing the cytosolic Ca2+ (Bouche and Fromm Citation2004). It was also observed that the yield of GABA was reduced at higher inoculum volumes, since higher inoculum volumes can have a shorter lag phase, resulting in lower GABA production. Lower inoculum volumes have a longer lag phase and hence higher GABA production (Donghua et al. Citation2011). The above screened parameters which showed positive t values were selected for RSM study since a positive t value indicates that by increasing these values there will be an increase in product yield.
Optimization of GABA (response surface methodology)
The equation explaining the relationship of the three selected variables (pH, incubation period and MSG concentration) for GABA yield can be expressed as:
(5)
The values obtained from the model and the values observed during the experimentation for GABA yield obtained from the central composite design (CCD) in each run are shown in .
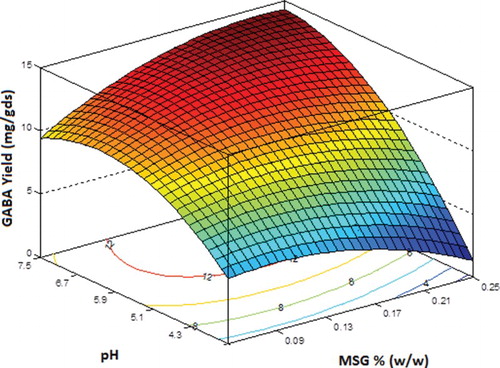
The interaction effects of the variables on GABA yield (mg/gds) were studied by plotting 3D surface curves against two independent variables and keeping the third variable at its central (0) level. shows the dependency of GABA yield on pH and MSG concentration, keeping incubation period at its central level of 14 days. The graph predicted a steep increase in GABA yield with pH at higher MSG concentrations. The yield with increased MSG concentration reduced at acidic pH but increased at basic pH values (higher pH). The maximum yield of around 14.4 mg/gds was predicted with an MSG concentration of 0.25 g at pH 7.5.
Figure 4. Three-dimensional response surface plot and contour plot showing the relative effect of pH and monosodium glutamate (MSG) on γ-aminobutyric acid (GABA) yield (mg/gds) while keeping incubation period at its central level.
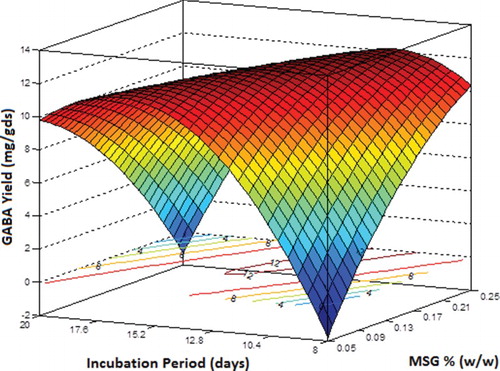
The 3D plot depicting the interaction effects of MSG concentration and incubation time, keeping pH at its central level of 5.5, had a characteristic parasol scarf shape, with its sharp knifepoint edges at extreme corners of the square base (). With the minimum concentration of MSG (0.05 g) and minimum incubation time of 8 days, the theoretical minimum yield of GABA is predicted to be below zero. The same is the case for the maximum concentration of MSG (0.25 g) and maximum incubation time of 20 days. The GABA yield increased with an increase in either of the variables and peaked at a value of 12.14 mg/gds for an MSG concentration of 0.22 g and incubation period of 12.13 days.
Figure 5. Three-dimensional response surface plot and contour plot showing the effect of monosodium glutamate (MSG) and incubation period on γ-aminobutyric acid (GABA) yield (mg/gds) while keeping pH at its central level.
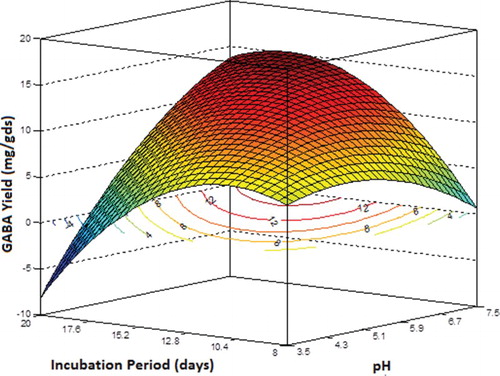
shows the variation in GABA yield with pH and incubation period, keeping the concentration of MSG at its central level of 0.15 g. The graph predicted a theoretical below-zero value of GABA yield at the lowest experimental pH and the longest incubation period. The effect of pH in a short incubation period was not so dominant. The maximum yield of around 15.2 mg/gds was predicted with an incubation period of 17.1 days at pH 7.5.
Figure 6. Three-dimensional response surface plot and contour plot showing the effect of pH and incubation period on γ-aminobutyric acid (GABA) yield (mg/gds) while keeping monosodium glutamate (MSG) concentration at its central level.
shows the regression results from the data of the CCD experiments. The greater the magnitude of the t value and the lower the p value, the more significant the corresponding coefficient (Subhagar et al. Citation2010). This indicates that the variable with the most significant effect was the quadratic effect of incubation period. Even the linear effect was significant compared to the linear effect of the other two variables. Furthermore, the interactive effect of incubation period with pH, as well as the concentration of MSG, was highly significant. This was followed by the quadratic effect of pH, although the implication was adverse, as seen from the negative t value. In summary, the incubation period plays an important role in determining the GABA yield.
Table 4. Regression coefficient results from the data of central composite design experiments for γ-aminobutyric acid (GABA) yield.
From the ANOVA, the model for GABA yield was highly significant, with a p value of 9.9 × 10⁻⁶ (p < 0.001). Also, the R2 (determination coefficient) value, which is a measure of the goodness of fit for the model, was 0.9579, which showed that 95.79% of the total variation in the observed response value could be explained by the model or by experimental parameters and their interactions. The small remainder (4.21%) of the total variation was not explained by the model (). The coefficient estimates in the regression model for red pigment synthesis are presented in . After the treatment combination, all linear terms of the independent variables, the quadratic term and the interaction term were taken for estimation of the coefficient.
Table 5. Analysis of variance (ANOVA) for response surface quadratic model for γ-aminobutyric acid (GABA) yield.
The accuracy of the RSM model was authenticated by comparing it with the ANN model. The feedforward back-propagation neural network model illustrated in was used to substantiate the results obtained by the RSM model. The ANN model was trained, tested and validated. The regression plot of output versus target was obtained and a regression value of 0.9754 was reached (). This validates the ANN model. The comparison was made on the basis of correlation coefficients and root mean square error. The values predicted by the ANN and the RSM model for all three phases of ANN modelling are tabulated in . shows the comparative plot for ANN and RSM predictions. The closeness of the RSM prediction to the ANN substantiates the accuracy of the RSM model. Since the ANN model has the universal ability to approximate any form of non-linearity of the system, the close match with the results of the second order polynomial of the RSM authenticates the correctness of the RSM model for this experiment (Desai et al. Citation2008). Desai et al. (Citation2008) compared ANN and RSM models for the optimization of scleroglucan and found the ANN model to be accurate than RSM. RSM and ANN were compared for the optimization of polyhydroxybutyrate by Azohydromonas lata MTCC and the results showed that predicted values of the hybrid ANN–genetic algorithm (GA) were much closer to the experimentally validated results than the predictions from the RSM-GA approach (Zafar et al. Citation2012).
Figure 7. Linear fit for the results from the artificial neural network model.
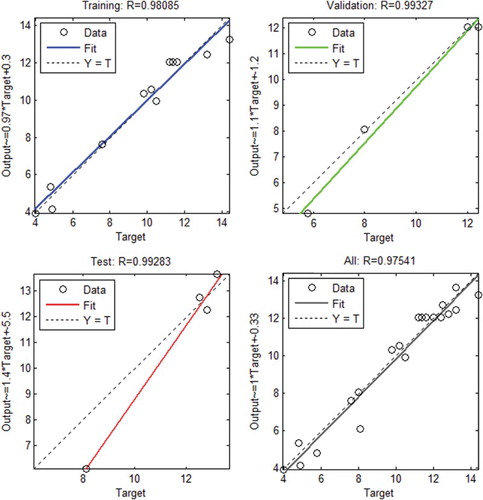
Figure 8. Comparison of γ-aminobutyric acid (GABA) yield obtained from the response surface methodology (RSM) and artificial neural network (ANN) models.
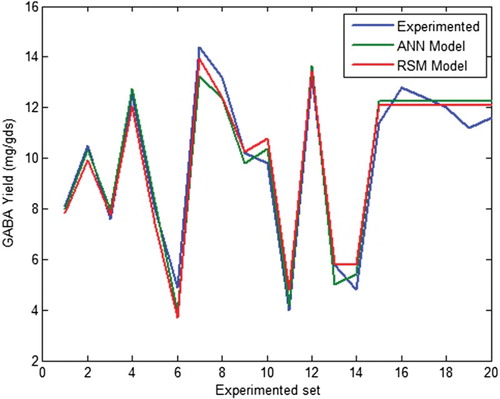
Table 6. Comparison of accuracy of response surface methodology (RSM) and artificial neural network (ANN) models.
Regulation of pH has the most pronounced effect in the fermentation process for GABA biosynthesis. GAD activity varies among different microorganisms; therefore, the actual pH value for the maximum GABA yield is species dependent. The optimized yield of GABA is dependent not only on activating the GAD activity but also on inhibiting the activities of GABA-decomposing enzymes (Yang et al. Citation2008). Most plants and microorganisms have one pathway for GABA decomposition. Both factors are pH dependent (Dhakal et al. Citation2012). Lactococcus lactis produced the highest amount of GABA (7.2 g/l) at pH ranging from 7.5 to 8.0, but GABA production was reduced at pH above 8.0 (Lu et al. Citation2009). The fermentation period also plays a crucial role in GABA synthesis and optimization of the GABA yield. Black raspberry juice fermented with Lb. brevis GABA 100 achieved the highest production of GABA (25.4 mg/ml and 26.5 mg/ml) on the 15th day of fermentation (Kim et al. Citation2009).
The addition of glutamate to the fermentation substrate catalyzed by GAD is a major factor influencing the production of GABA. Glutamate addition increased GABA production in Lb. paracasei and Lb. brevis (Dhakal et al. Citation2012). Monascus pilosus produced a 2.8 times higher GABA yield (502.39 mg/kg) with the addition of 1.0% MSG to sterilized rice compared with rice without MSG (Sun et al. Citation2008). The strain M. ruber showed the highest GABA production (3.657 g/l) in potato dextrose with 0.5% MSG (Donghua et al. Citation2011). Donghua et al. (Citation2011) screened different agro-wastes such as Indian meal, potato dextrose, rice meal, soya bean powder, sweet potato starch and wheat powder for GABA production in submerged fermentation, and found that wheat powder was the best substrate, with an optimum yield of 13.174 g/l. Panatda et al. (Citation2010) used rice as a substrate for comparing germination and fermentation methods for GABA yield. Monascus-fermented rice gave the maximum yield (28.37 mg/gds). In the present work, an extremely economical agricultural residue, i.e. coconut oil cake, was used. From the model developed in this study, the optimum GABA yield was estimated to be 15.53 mg/gds with an MSG concentration of 0.05 g, a pH of 7.5 and an incubation period of 20 days. To validate the results predicted by the model, a test was run under these conditions and the GABA yield was found to be 15.31 mg/gds, which is very close to the predicted yield. This substantiated the model. Comparing the GABA yield per unit substrate invested in terms of monetary as well as utility value, the results of the present study are encouraging. This can be deemed a good use of coconut oil cake, which is produced in large amounts and may otherwise go to waste.
Conclusions
Monascus species have primarily been exploited for pigment production and there are only a few reports on their use in the production of GABA. To the authors' knowledge, this is the first report on GABA production from M. sanguineus using coconut oil cake as a substrate. The estimation of GABA using the ninhydrin method in the present work can be considered a novel application of known principles. Since the statistical approach using RSM for the optimization of industrial products is not well known for its accuracy, a computational approach using an ANN was applied to authenticate the results. The encouraging outcome of this study indicates that this method can be applied to the development of efficient processes to maximize the yield of GABA from experimental strains for use in the pharmaceutical and food industries.
Disclosure statement
No potential conflict of interest was reported by the authors.
References
- Aoki H, Uda I, Tagami K, Furuya Y, Endo Y, Fujimoto K. 2003. Production of a new Tempeh-like fermented soybean containing a high level of gamma-aminobutyric acid by anaerobic incubation with Rhizopus. Biosci Biotechnol Biochem. 67:1018–1023. doi: 10.1271/bbb.67.1018
- Bali A, Gaur P. 2011. A novel method for spectrophotometric determination of pregabalin in pure form and in capsules. Chem Cent J. 5:59–66. doi: 10.1186/1752-153X-5-59
- Basri MR, Noor ZR, Rahman A, Ebrahimpour A, Salleh AB, Gunawan ER, Basyaruddin MAR. 2007. Comparison of estimation capabilities of response surface methodology (RSM) with artificial neural network (ANN) in lipase-catalyzed synthesis of palm-based wax ester. BMC Biotechnol. 7:53–67. doi: 10.1186/1472-6750-7-53
- Bouché N, Fromm H. 2004. GABA in plants: just a metabolite? Trends Plant Sci. 9(3):110–115. doi: 10.1016/j.tplants.2004.01.006
- Chhatpar HS, Vaidya R, Vayas P. 2003. Statistical optimization of medium components for the production of chitinase by Alcaligenes xylosoxydans. J Enz Microb Technol. 33:92–96. doi: 10.1016/S0141-0229(03)00100-5
- Desai KM, Shrikant A, Survase P, Saudagar SS, Lele S, Singhal RS. 2008. Comparison of artificial neural network (ANN) and response surface methodology (RSM) in fermentation media optimization: case study of fermentative production of scleroglucan. Biochem Eng J. 41:266–273. doi: 10.1016/j.bej.2008.05.009
- Dhakal R, Bajpai VK, Kwang-Hyun B. 2012. Production of GABA (γ-aminobutyric acid) by microorganisms: a review. Braz J Microbiol. 43(4):1230–1241. doi: 10.1590/S1517-83822012000400001
- Dikshit R, Tallapragada P. 2013. Exploring Monascus sanguineus as a potential natural source for pigment production. Int Res J Biol Sci. 2(5):59–67.
- Dikshit R, Tallapragada P. 2014. Statistical optimization of pigment production by Monascus sanguineus under stress condition. Prep Biochem Biotech. 44(1):68–79. doi: 10.1080/10826068.2013.792097
- Donghua J, Hao J, Yan Y, Jiaheng H. 2011. Studies on screening of higher γ-aminobutyric acid-producing Monascus and optimization of fermentative parameters. Eur Food Res Technol. 232:541–547. doi: 10.1007/s00217-010-1413-5
- Hosseinimehr SJ, Fereshteh P, Ehsan M, Mohsen A. 2010. Colorimetric determination of baclofen with ninhydrin reagent and compare with HPLC method in tablet. Asian J Chem. 22(1):522–526.
- Huang J, Mei L, Wu H, Lin D. 2007. Biosynthesis of γ-aminobutyric acid (GABA) using immobilized whole cells of Lactobacillus brevis. World J Microbiol Biotechnol. 23:865–871. doi: 10.1007/s11274-006-9311-5
- Kammoun R, Naili B, Bejar S. 2008. Application of a statistical design to the optimization of parameters and culture medium for α-amylase production by Aspergillus oryzae CBS 819.72 grown on gruel (wheat grinding by-product). Bioresour Technol. 99(13):5602–5609. doi: 10.1016/j.biortech.2007.10.045
- Kim JY, Lee MY, Ji GE, Lee YS, Hwang KT. 2009. Production of γ-aminobutyric acid in black raspberry juice during fermentation by Lactobacillus brevis GABA 100. Int J Food Microbiol. 130:12–16. doi: 10.1016/j.ijfoodmicro.2008.12.028
- Lu X, Xie C, Gu Z. 2009. Optimisation of fermentative parameters for GABA enrichment by Lactococcus lactis. Czech J Food Sci. 27(6):433–442.
- Nomura M, Kimoto T, Someya Y, Furukava S, Suzuki I. 1998. Production of gamma-aminobutyric acid by cheese starters during cheese ripening. J Dairy Sci. 81:1486–1491. doi: 10.3168/jds.S0022-0302(98)75714-5
- Panatda J, Hataichanoke N, Saisamorn L, Toshisada S, Takeshi K, Griangsak C. 2010. Comparison of gamma-aminobutyric acid production in Thai rice grains. World J Microbiol Biotechnol. 26:257–263. doi: 10.1007/s11274-009-0168-2
- Plackett RL, Burman JP. 1946. The design of optimum multifactorial experiments. Biometrika. 33:305–325. doi: 10.1093/biomet/33.4.305
- Qian L. 2013. Submerged fermentation of Lactobacillus rhamnosus YS9 for γ-aminobutyric acid (GABA) production. Braz J Microbiol. 44(1):183–187. doi: 10.1590/S1517-83822013000100028
- Reed KL, Maclntyre JK, Tobet SA, Trudeau VL, Maceachern L, Rubin BS, Sower SA. 2002. The spatial relationship of γ-aminobutyric acid (GABA) neurons and gonadotropin-releasing hormone (GnRH) neurons in larval and adult sea lamprey, Petromyzon marinus. Brain Behav Evol. 60(1):1–12. doi: 10.1159/000064117
- Scott-Taggart CP, Cauwenberghe ORV, Mclean MD, Shelp BJ. 1999. Regulation of γ-aminobutyric acid synthesis in situ by glutamate availability. Physiol Plant. 106(4):363–369. doi: 10.1034/j.1399-3054.1999.106402.x
- Su YC, Wang JJ, Lin TT, Pan TT. 2003. Production of the secondary metabolites γ-aminobutyric acid and monacolin K by Monascus. J Ind Microbiol Biotechnol. 30:41–46. doi: 10.1007/s10295-002-0001-5
- Subhagar S, Aravindan R, Viruthagiri T. 2010. Statistical optimization of anticholesterolemic drug lovastatin production by the red mold Monascus purpureus. Food Bioprod Process. 88:266–276. doi: 10.1016/j.fbp.2010.01.006
- Sun BS, Zhou Li-P, Xiao-Qin J, Chang-Keun S. 2008. Response surface modeling for γ-aminobutyric acid production by Monascus pilosus GM100 under solid-state fermentation. Afr J Biotechnol. 7(24):4544–4550.
- Ting Q, Haixing L, Yusheng C. 2010. Pre-staining thin layer chromatography method for amino acid detection. Afr J Biotechnol. 9(50):8679–8681.
- Yang S-Y, Lu F-X, Lu Z-X, Bie X-M, Jiao Y, Sun L-J, Yu B. 2008. Production of gamma-aminobutyric acid by Streptococcus salivarius sub sp thermophilus Y2 under submerged fermentation. Amino Acids. 34:473–478. doi: 10.1007/s00726-007-0544-x
- Zafar M, Shashi K, Surendra K, Dhiman AK. 2012. Optimization of polyhydroxybutyrate (PHB) production by Azohydromonas lata MTCC 2311 by using genetic algorithm based on artificial neural network and response surface methodology. Biocatal Agric Biotechnol. 1:70–79.