
Abstract
Aims
The ability of a patient to receive anti-cancer treatment depends on a variety of factors, including performance status (PS), which is typically measured using the Eastern Cooperative Oncology Group (ECOG) scale. This study hypothesized that there would be a strong and positive correlation between ECOG PS values and healthcare resource utilization (HCRU) and a strong and negative correlation with the use of anti-cancer therapy.
Materials and methods
Patients with colorectal, lung or gastric cancer were included in this retrospective analysis of administrative claims data linked to electronic medical records (EMR). All-cause HCRU (hospitalization/inpatient care, emergency room visits, systemic anti-cancer therapy, radiation therapy, outpatient physician visits, hospice, home health care and key supportive care treatments such as anti-emetics, hematopoietic treatments, transfusions, and durable medical equipment) was evaluated by baseline ECOG PS value and PS over time. Adjusted multivariable regression analysis was used to assess the relationship between baseline ECOG PS and HCRU. Regression analyses were conducted to explore the relationship between other baseline variables and HCRU.
Results
There were 1311 patients included in this study. There was low correlation between PS and any HCRU variable or receipt of anti-cancer therapy (correlation coefficients all <0.10). In regression analyses, the proportion of patients with poor PS (PS = 2+) who were hospitalized was not significantly different from those with good PS (PS = 0/1) (28.9% versus 19.3%, p = .07).
Limitations
The low rate of reporting of PS and the small sample size of patient groups in this study.
Conclusions
There is very little evidence of a relationship between ECOG PS and HCRU, ECOG PS, or anti-cancer therapy in this study, in part due to low rates of and lack of variability in reported PS. There is some evidence that baseline comorbidities were significantly associated with HCRU and should be accounted for in future research evaluating HCRU.
Introduction
An estimated 1,762,450 new cases of cancer are diagnosed annually in the USACitation1. The primary therapeutic approach for most cancers remains surgical resection, radiation therapy, with or without targeted/biologic therapy and/or chemotherapy. For patients with advanced or metastatic cancer, systemic anti-cancer therapy is the primary modality.
The choice of systemic therapy is based on multiple factors, such as tumor burden and biomarker status, concomitant conditions, and performance status (PS). In oncology, PS is a measure of functional ability and is typically measured by the Eastern Cooperative Oncology Group (ECOG) scale; a higher value reflects a lower PS.Citation2–4 For example, an ECOG PS of 0 indicates that the patient is fully active, a value of 1 indicates that the patient is restricted in strenuous activity but ambulatory, a value of 2 indicates that the patient is ambulatory at least 50% of the time but unable to work, a value of 3 indicates that the patient is confined to bed or chair for more than 50% of the time with only limited self-care, a value of 4 indicates that the patient is disabled and bedridden, and 5 represents deathCitation4. The ECOG PS scale may be referred to as the World Health Organization or Zubrod scaleCitation5. The Karnofsky scale also measures patient PS, and is evaluated in 10-point increments from 0 to 100 with a lower value reflecting a lower PSCitation3. A Karnofsky PS value may be converted to the ECOG scale as follows: ECOG 0 = Karnofsky 90/100; ECOG 1 = Karnofsky 70/80; ECOG 2 = Karnofsky 50/60; ECOG 3 = Karnofsky 30/40; ECOG 4 = Karnofsky 10/20; and ECOG 5 = Karnofsky 0.Citation4,Citation6 The majority of clinical trials limit enrollment to the healthiest patients who have an ECOG PS value of 0 or 1; however, a practicing clinician may often care for patients with poor PS. Limited data exist to support evidence-based decision making or to aid in the management of treatment expectations.
The role of PS to direct or inform patient care is not consistent across various cancers. For patients with metastatic non-small cell lung cancer (NSCLC), National Comprehensive Cancer Network (NCCN) oncology treatment guidelines have changed considerably since 2018 with the incorporation of multiple novel biomarker-driven therapies, many of which have more favorable toxicity profiles and are recommended for the treatment of patients with ECOG PS of 0–4; however, for patients without actionable biomarkers, recommendations for systemic treatment are limited to patients with an ECOG PS ≤2 (with fewer recommendations for PS of 2), and supportive care only for those with PS 3 or 4Citation7. The NCCN colon cancer treatment guidelines recommend specific regimens for those with excellent PS, and refer to a pan-tumor guidance for older adults in the case of an elderly patient.Citation8,Citation9 The clinical treatment guidelines for gastric cancer state that patients with unresectable advanced, recurrent or metastatic disease with Karnofsky PS ≤60 or ECOG PS ≥3 should receive supportive careCitation10. The evidence for the benefit of systemic therapy is limited to the care of patients with better PS based on the patients enrolled to clinical trials, but this relationship varies considerably, as demonstrated by the heterogeneity of NSCLC, colorectal cancer and gastric cancer guidelines with regard to PS.
It was hypothesized that patients who receive systemic therapy whose ECOG PS is ≥2 may require additional health care resources such as hospitalizations, emergency room (ER) visits, supportive care, and physician office visits during anti-cancer treatment. It was also hypothesized that patients with lower PS may receive less systemic therapy. Given the gap in evidence of the relationship between PS and healthcare resource utilization (HCRU), this study was designed to evaluate this in the setting of colorectal, lung and gastric cancers.
Methods
A retrospective analysis was conducted of linked healthcare claims and electronic medical record (EMR) data from the MarketScanFootnotei Oncology EMR-Claims Dataset. This dataset links records from the MarketScan Commercial and Medicare Supplemental Claims Databases and Oncology EMR Database using a deterministic methodology. The resulting dataset contains data for over 50,000 unique patients who have undergone cancer treatment in U.S. community oncology practices over a 3-year period. All variables present in either the claims or EMR databases are available in the linked dataset, including person-level clinical HCRU, expenditures, and enrollment across inpatient, outpatient, prescription drug, and carve-out services. Records in the linked dataset are de-identified to comply with U.S. patient confidentiality requirements.
Three tumor types were selected for study to represent different approaches to PS and treatment decision making as demonstrated in NCCN treatment guidelines. Colorectal cancer guidelines include recommendation for those with excellent PS and the choice of systemic anti-cancer therapy versus supportive care and guidelines for NSCLC recommend supportive care for those with PS >2.Citation11,Citation12 Supportive care is recommended for patients with small cell lung cancer with PS ≥2, but small cell cancers represent <15% of all lung cancers. Gastric cancer guidelines recommend supportive care for those with a PS ≥2Citation10. Therefore, eligible patients were those with a documented diagnosis of colorectal, lung, or gastric cancer (ICD-9-CM codes, 153.0x-154.1x, 162.2x-162.9x or 151.x, respectively) on two separate dates. Patients were required to be age 18 years or older at the time of the initial (index) diagnosis, have recorded at least one PS value from 45 days prior to the index diagnosis through any time after the index diagnosis, must have made at least two visits to the oncologist practice collecting the EMR between July 1, 2011 and September 30, 2014, and could not have other malignant conditions, other than non-melanoma skin cancer. In addition, patients in each cancer cohort were required to have linked EMR and claims data during the 6-month pre-index period to ensure baseline data were captured.
Since PS can change dynamically throughout the treatment and follow-up periods, PS periods were developed for this study to capture the time during which patients had consistent PS values. The baseline PS period began with the first recorded PS value (baseline PS value) no greater than 45 days prior to the index diagnosis through the earliest of the following: the end of continuous enrollment in the database; end of the study period; death; or a change (increase/decrease) in PS. For patients with a subsequent increase or decrease in score, subsequent PS periods were created similarly, until all available follow-up data for each patient had been considered for inclusion in a PS period. These were subsequently numbered (e.g. PS Period II, PS Period III) until the last observed period as defined above.
All-cause resource utilization measures (binary indicators, frequency counts, and continuous variables) were based on inpatient, outpatient and outpatient pharmacy claims with dates of service during the follow up period. Procedure codes, National Drug Codes (NDCs), place of service codes, and provider type codes were used to identify relevant claims. The frequency of resources was standardized to counts per month by dividing each patient’s total number of services by the number of months in their PS period. This standardization was necessary because the length of follow up varied. Categories of HCRU included hospitalization/inpatient care, ER visits, systemic anti-cancer therapy, radiation therapy, outpatient physician visits, hospice, home health care and key supportive care such as anti-emetics, hematopoietic treatments, transfusions, and durable medical equipment.
Statistical analysis plan
Descriptive analyses summarized HCRU by PS value as well as by tumor type and PS period. For these analyses, the PS periods were combined based on the ECOG PS values of 0/1, 2, 3, and 4. To account for differences in duration of time patients were in each PS period, HCRU was reported as a percentage of time during the period (e.g. for duration of time with inpatient stays), or as the proportion of PS periods for the values of 0/1, 2, 3 or 4, during which the HCRU occurred.
Partial Spearman’s rank correlations were calculated to evaluate the strength of the relationships between PS values in the PS period with HCRU, adjusting for patient age, sex, payer and baseline Charlson Comorbidity Index (CCI) score. All available PS periods were included. For all analyses, a pre-determined value of correlation coefficient of r ≥ 0.40 was considered evidence for a moderate to strong correlation. This value approximately matches a published “rule-of-thumb” that a correlation less than 0.25 represents a weak correlation; 0.25–0.5 a weak one; 0.5–0.75 a moderate one; and greater than 0.75 is considered strongCitation13. A correlation of as low as 0.20 could be detected with greater than 90% power (alpha = 0.05) with a sample as small as 400. In the case of smaller sample sizes (less than 400), analyses were considered exploratory as the identification of very small correlations (such as 0.20) were not possible. No subgroup analysis was conducted in any subgroup with a sample less than 30.
Multivariable regression-based analyses were also used to assess the relationships between PS values and HCRU adjusting for demographics and baseline clinical characteristics. Generalized linear model (GLM) specifications varied depending on the resource outcome variable as follows: binary indicator of any utilization – GLM with logit link and scaled binomial error distribution; count of services – GLM with log link and negative binomial error distribution; and for continuous variables – GLM with identity link and normal error distribution, and their extension to repeated measures data i.e. generalized estimating equations (GEE) was considered. These are parametric methods which, although they require assumptions about the distributions of the variables, offer greatly more power to detect effects than non-parametric (distribution-free) methods such as rank correlations particularly when small numbers are involved.
The small sample size and the small numbers of patients with more than one PS period and with a PS value greater than 2 caused a calculation break-down when GEE analyses were attempted, particularly for binary variables such as inpatient admission. Given the data limitations and GEE calculation break-down, non-repeated measures GLMs of the baseline PS period were considered the best approach. Consequently the final analyses used collapsed PS score categories (0, 1, 2+), as well as terms for the tumor type interaction with the collapsed PS score, which somewhat negated the consequences of the small patient numbers while retaining an ability to compare between tumor types.
Results
Study cohort
A total of 1311 patients met eligibility criteria and were included in this study; these included 783 colorectal, 485 lung and 43 gastric cancer patients. A summary of the demographic and clinical characteristics of the study cohort is provided in . Colorectal cancer patients were a mean of 65.4 years of age and more than half were male. The mean age of lung cancer patients was 69.3 years and approximately half of these patients were female. Of the 43 gastric cancer patients, the average age was 66.1 years and approximately two-thirds were male. At initial (index) diagnosis, the majority of patients had an ECOG PS score of 0 or 1.
Table 1. Demographic and clinical characteristics of eligible study population (N = 1311).
Amongst colorectal, lung and gastric cancers, only one assessment of PS was reported in the EMR after the index date for 75.7%, 67.2% and 69.8% of patients, respectively (). The mean length of follow-up among the 783 colorectal cancer patients was 493.5 days and consisted of only 1216 PS periods. Approximately half of colorectal cancer periods had PS = 0 (50.6%), 34.8% of periods had PS = 1, 11.3% had PS = 2, and 2.9% had PS = 3. Less than 1% of PS periods had PS = 4. Lung cancer patients (N = 485) had a mean length of follow-up of 377.2 days, consisting of 785 PS periods. 34.4% of lung cancer PS periods had PS = 0, 38.6% had PS = 1, 20.2% had PS = 2, and 6.5% had PS = 3. Less than 1% of PS periods had PS = 4. Among the 43 gastric cancer patients, the mean length of follow-up was 429.7 days and consisted of 77 PS periods. 39.6% of gastric cancer PS periods had PS = 0, 40.7% had PS = 1, 15.4% had PS = 2, 3.3% had PS = 3 and 1.1% had PS = 4.
Table 2. Performance status (PS) periods observed in the data.
Resource utilization
Only 39, 54 and 3 (colorectal, lung, and gastric cancer, respectively) periods had a PS value of 3, while only 6, 2 and 1 (colorectal, lung, and gastric cancer, respectively) periods had a PS value of 4, limiting the ability to statistically generalize the HCRU for patients with these PS categories ( and ). Therefore, results were described for the periods with PS scores of 0, 1 and 2+.
Figure 1. Health care resource utilization by performance status (PS) periods for patients with colorectal, lung or gastric cancer.
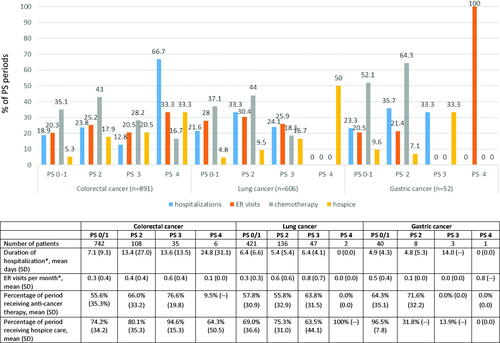
Table 3. Descriptive health care resource utilization results by cancer site and Eastern Cooperative Oncology Group (ECOG) across performance status (PS) score periods.
Hospitalizations and emergency room visits
Hospitalization occurred in 18.9%, 21.6% and 23.3% of all periods with PS 0/1 (baseline or subsequent periods) for patients with colorectal, lung and gastric cancer, respectively (). Hospitalizations occurred in 23.8%, 33.3%, and 35.7% of all PS periods with values of PS 2 for colorectal, lung and gastric cancer patients, respectively. Hospitalizations involving surgery occurred in 13.4%, 11.7% and 12.3% of all PS periods with values of 0/1, and in 13.2%, 10.7%, and 28.6% of periods with PS 2 for patients with colorectal, lung and gastric cancer, respectively. ER visits occurred in 20.3%, 28.0% and 20.5% of all PS periods with values of 0/1 and in 25.2%, 30.4%, and 21.4% of all periods with PS 2 for colorectal, lung and gastric cancer, respectively. Notably, the numbers for the different tumors can be small when stratified by PS, as seen with the example of ER visits where the numbers for colorectal, lung and gastric cancer were 38, 51 and 3, respectively.
Systemic anti-cancer and radiation therapy
Systemic anti-cancer therapy use was present in 35.1%, 37.1% and 52.1% of all PS 0/1 periods and for all PS 2 periods was 43.0%, 44.0% and 64.3% for patients with colorectal, lung and gastric cancer, respectively. Radiation was less commonly present, with 3.4%, 15.7% and 6.8% of all PS periods with values of 0/1 and 4.0%, 19.6% and 21.4% of all PS periods with a value of 2 receiving radiation therapy among patients with colorectal, lung and gastric cancer, respectively.
Hospice, home health care and other supportive care
Hospice use was low for all PS 0/1 periods: 5.3%, 4.8% and 9.6% for colorectal, lung and gastric cancer patients, respectively, but hospice use was reported in 17.9%, 9.5%, and 7.1% of all PS 2 periods and 20.5%, 16.7% and 33.3% of all PS 3 periods, although the numbers were very small. Home health care utilization was not common across any of the cancers at any PS time period. Durable medical equipment was used by patients in 39.8%, 35.1% and 31.5% of all PS 0/1 periods and 40.4%, 41.7%, and 35.7% of all PS 2 periods for colorectal, lung and gastric cancer patients, respectively. Anti-emetic use in all PS 0/1 periods was 40.0%, 45.3%, and 43.8%, and was 42.4%, 50.0%, and 64.3% for all PS 2 periods for patients with colorectal, lung and gastric cancer, respectively. Among these patient groups, hematopoietic agents were used in 13.5%, 16.1% and 23.3% of all PS 0/1 periods in 29.1%, 19.0%, and 28.6% of all PS 2 periods, respectively. Transfusions were also patterned similarly with 1.4%, 4.3% and 1.4% in all PS 0/1 periods and 2.6%, 7.7%, and 7.1% in all PS 2 periods for colorectal, lung and gastric cancer, respectively. To be noted is the small number of patients in the PS stratifications; particularly for the PS 2 group.
Association between baseline PS score and resource utilization
None of the partial Spearman’s rank correlation coefficients calculated from all the periods’ data attained a strongly correlated value of ≥0.40 between PS period and HRCU variables; all correlation coefficients were positive, but low (). While HCRU was found not to be strongly correlated with PS in these lowly powered rank correlations, the more powerful regression analyses using the baseline period only suggested that increasing PS could lead to increased odds for an outpatient physician visit for colorectal cancer patients as compared to lung and gastric cancer patients. There was also an indication for a similar increase but only for a PS score of 1 for radiation therapy (Supplementary Table 1). Of note, CCI was the only covariate that demonstrated a significant relationship across all categories of HCRU.
Table 4. Partial Spearman correlations of performance status (PS) period with health care resource utilizationa.
Supplementary Table 2 provides results tabulated by PS score from the regression analyses that are summarized in Supplementary Table 1 using the baseline PS period only with PS 0 as the reference group i.e. the results for PS scores of 1 and 2+ are with respect to PS 0. The PS 0 and PS 1 results were relatively similar with regards to HCRU, except for physician visits, hospice care and nutritional supplementation, where PS 0 was higher. Patients with a PS value of 2 spent a significantly higher proportion of the baseline PS period hospitalized and used more durable medical equipment but had significantly fewer ER visits and physician visits (all p < .01).
Discussion
This study provides no evidence that patients with poor PS use greater health care resources than patients with more favorable PS values. Given the relatively low numbers of both patients and PS periods in the data used in this analysis, as well as a lack of recorded changes in PS over time, resulting in a lack of power to identify any effects other than very large ones, this is not surprising. The inability to reject the null hypotheses concerning PS scores and their relationship to HCRU and cancer therapy suggests that if such relationships exist they are weak ones below the threshold of those that can be picked up with the sample sizes of this study. One of the challenges in making a conclusive finding from these data is perhaps the most important finding itself, as is the case with many null studies as new knowledge is uncovered versus confirmedCitation14. Despite the importance of PS in oncology clinical assessment and treatment selection as defined in national treatment guidelines, this study identified that about 40% of eligible patients had only one such assessment documented in their medical record (data not shown). These data bring to question the clinical relevance of decision making related to PS in routine practice, the limitations of which have been noted by othersCitation15,Citation16.
When evaluating the study according to the primary objective, the inability to detect a strong relationship between PS and HCRU could suggest that patients with declining PS would appear to be unlikely to create major additional burdens on the health care system, but in fact the findings support the important role of comorbidities. These data suggest that the underlying health of the patient, and perhaps not PS, is an important factor associated with resource use for all patients included in this study, as the result was consistent among those with colorectal, lung or gastric cancer. Underlying health conditions may play an important role in the relationship between PS and HCRU; a relationship was observed only among those with survival outcomes of less than 1 year in melanoma; unfortunately no data were presented related to comorbid conditions in this study, which may have helped to explain this relationshipCitation17.
There were no strong correlations identified that might suggest decreased HCRU for patients whose PS is improved. However, due to the small number of patients particularly in the gastric cancer cohort, subsequent lack power, and lack of recordings of varying in PS score within patients over time, the possibility that this relationship exists cannot be ruled out. The limited ECOG PS data recorded in the patient record created challenges in evaluating the relationship between PS and HCRU over time. Other solutions may include estimating PS from claims data, but this would not be directly translatable to the point of delivery of clinical careCitation18. This is a gap in observational data that should be addressed to investigate this relationship. In this study, even among patients with ECOG PS recorded in the medical record, most had only one PS value recorded. The lack of variation in PS scores limited the ability to evaluate changes over time. Additionally, the sample size for the gastric cancer cohort (n = 43) was very low, limiting the ability to detect strong relationships, thus all gastric cancer analyses can be considered exploratory. As with all studies that obtain data from secondary data sources, the data are not collected for research purposes, and key variables (such as PS scores over time) may not be available. Patients could have changed PS, but the data may not necessarily reflect those changes. Additionally, other variables used as covariates (such as cancer stage) are not always present for each patient record and cannot easily be imputed. Importantly, this study was based on a subset of patients in the overall database that had PS scores recorded in the EMR and may not be representative of all colorectal, lung or gastric cancer patients.
While we did not find evidence of the relationship between PS and HCRU, there are considerable aspects to be learned from this study. This study was able to investigate some aspects of the relationship between PS and HCRU for patients with colorectal, lung or gastric cancer during the course of care. The results do suggest the possible existence of some relationships between recorded covariates and HCRU at the patient baseline of oncology care, although weaker than was detectable with the available data. Other possible explanations for the lack of evidence observed for PS and HCRU are that patients with Medicare plans have greater odds for ER visits than those with Commercial plans, as well as that colorectal cancer patients have lower odds for such visits. It is also possible that the odds of systemic anti-cancer therapy increase with increasing stage of cancer and that patients with colorectal cancer have a lower odds for radiation therapy than patients with lung cancer. Comorbidities as measured by the CCI, which records a broader burden of underlying diseases and can be easily derived from claims datasets, may be associated with HCRU. The strength of the CCI relationship brings into question the role of PS in HCRU and in clinical care. Further work should evaluate this in the real-world setting of clinical practice where reliance on PS may not be practical or feasible in the metastatic setting.
Conclusions
This study emphasizes the importance and difficulties of measuring and accounting for performance status and reinforces the importance of including comorbidity evaluation in any HCRU research study. It additionally suggests that performance status, despite being a common criterion for clinical trial participation and a factor included in treatment guidelines, may not be a critical factor in the evaluation of resources used for patient care in routine practice, though interpretation is limited by sample size.
Transparency
Declaration of funding
This study was supported by Eli Lilly and Company.
Declaration of financial/other relationships
LMH, ZLC, LB, AML and WS are employees of Eli Lilly and Company. DS and LM are employees of IBM Watson Health. (At the time of the analysis, they were employees of Truven Health Analytics, now part of IBM Watson Health.)
A reviewer on this manuscript has disclosed that they are the Chief Scientist for Matrix45, LLC, which provides scientific consulting services to the life sciences industry on a non-exclusivity basis. Per company policy, I cannot receive compensation nor provide services independently to (potential) sponsor organizations. Matrix45 and its predecessor companies have served most of the PharmExec top 20 companies, as well other companies. They also have the role of Deputy Editor-in-Chief for Journal of Medical Economics and is the Quantitative Methods Editor for JAMA Dermatology. The other peer reviewers on this manuscript have no other relevant financial relationships or otherwise to disclose.
Author contributions
The study was conceptualized by LMH and LB and designed by all coauthors. The data were analyzed by DS and were evaluated and interpreted by all coauthors. The draft manuscript was written by LMH and was critically reviewed for important intellectual content by ZLC, LB, AML, WS, DS and LM. All authors reviewed and approved the final version of the manuscript.
Supplemental Material
Download MS Word (24.9 KB)Acknowledgements
None stated.
Data availability statement
The data that support the findings of this study were obtained from Truven Health Analytics (now part of IBM Watson Health). Restrictions apply to the availability of these data, which were used under license for this study.
Note
Notes
i MarketScan is a registered trademark of IBM Corporation, USA.
References
- Siegel RL, Miller KD, Jemal A. Cancer statistics, 2019. CA A Cancer J Clin. 2019; 69:7–34.
- ESMO. Performance scales: Karnofsky and ECOG Scores. 2008 [accessed 2016 Feb 4]. Available from: oncologypro.esmo.org/Guidelines-Practice/Practice-Tools/Performance-Scores
- Karnofsky DA, Burchenal JH. The clinical evluation of chemotherapeutic agents in cancer. In: McLeod CM, Editor. Evaluation of chemotherapeutic agents in cancer. New York: Columbia University Press; 1949. p. 191–205.
- Oken MM, Creech RH, Tormey DC, et al. Toxicity and response criteria of the Eastern Cooperative Oncology Group. Am J Clin Oncol. 1982;5:649–655.
- Zubrod CG, Schneiderman M, Frei E, et al. Appraisal of methods for the study of chemotherapy in man: comparative therapeutic trials of nitrogen mustard and triethylene thiophosphoramide. J Chronic Dis. 1960;11:7–33.
- West HJ, Jin JO. JAMA Oncology Patient Page. Performance Status in Patients With Cancer. JAMA Oncol. 2015;1:998–998.
- Aier I, Semwal R, Sharma A, et al. A systematic assessment of statistics, risk factors, and underlying features involved in pancreatic cancer. Cancer Epidemiol. 2019; 58:104–110.
- NCCN. NCCN Clinical Practice Guidelines in Oncology: Rectal cancer. Version 6.2020. 2020 [accessed 2020 Oct 14]. Available from: www.nccn.org
- NCCN. NCCN Clinical Practice Guidelines in Oncology: Older adult oncology. Version 1.2020. 2020 [accessed 2020 Oct 14]. Available from: www.nccn.org
- NCCN. NCCN Clinical Practice Guidelines in Oncology: Gastric cancer. Version 3.2020. 2020 [accessed 2020 Oct 14]. Available from: www.nccn.org
- NCCN. NCCN Clinical Practice Guidelines in Oncology: Non-small cell lung cancer. Version 8.2020. 2020 [accessed 2020 Oct 14]. Available from: www.nccn.org
- NCCN. NCCN Clinical Practice Guidelines in Oncology: Colon cancer. Version 4.2020. 2020 [accessed 2020 Oct 14]. Available from: www.nccn.org
- Zach. What is a strong correlation? 2020 [accessed 2020 Oct 14]. Available from: https://www.statology.org/what-is-a-strong-correlation/
- Bones AK. We knew the future all along: scientific hypothesizing is much more accurate than other forms of precognition – a satire in one part. Perspect Psychol Sci. 2012;7:307–309.
- Kelly CM, Shahrokni A. Moving beyond Karnofsky and ECOG performance status assessments with new technologies. J Oncol. 2016;2016:6186543.
- Taylor AE, Olver IN, Sivanthan T, et al. Observer error in grading performance status in cancer patients. Support Care Cancer. 1999;7:332–335.
- Tarhini A, Rao AS, Corman S, et al. Healthcare Resource Utilization (HCRU) in patients receiving ipilimumab for advanced melanoma: impact of survival and Eastern Cooperative Oncology Group (ECOG) Status. Ann Oncol. 2014;25:iv381.
- Sheffield KM, Bowman L, Smith DM, et al. Development and validation of a claims-based approach to proxy ECOG performance status across ten tumor groups. J Comp Eff Res. 2018;7:193–208.