
ABSTRACT
A basic premise underlying this article is that the social surroundings of individuals as they gradually age are not homogeneous and have influence on their well-being. Furthermore, if significant variation on the social context are found, they should also affect and be taking into account on the provision of different kinds of public welfare support.
This paper analyses two particularly relevant variables influencing this context, location and family availability. We ask if a focus on head count demographics hide important aspects of the challenges posed upon welfare agencies when preparing for and undertaking social work in practice.
In order to illustrate the magnitude of those differences we study the population composition in three regions in Norway: The municipality of Oslo, Akershus county and Helgeland. We combine population registers with a parent child identifier, which enables us to map the older person’s spousal situation, presence and location of children (and grandchildren), what we term life links adjusted shares.
The results revealed that the female surplus in the older population is far stronger in Oslo than in the two other regions considered. Moreover, the combination of a higher prevalence of older people not residing together with a spouse, older people without children, and older peoples with fewer children, place Oslo’s older residents in a relatively more vulnerable position in terms of spouse and kinship availability. Hence, we will claim that there is a need for an increased attention to not only head count demographics, but also to the uneven geographic distribution of life links.
Introduction
Robert Putnam’s (Citation2001) best seller’s title created an indelible picture of loneliness in many of his readers’ minds. Presence of social networks and life links feeds into wellbeing and welfare of everybody. By alluding to Putnam in the title, we want to target the reader’s attention towards the gendered and spatial variations in one particular type of life links, i.e. those of kinship.
This paper is knit around three pillars. The first is the well-known fact of population ageing across both Norway and most other countries. Second, population ageing is played out very differently in different parts of the country. This is due to both coincidental historical legacies and also mechanisms that generated specific city demographic patterns (see, e.g. Edlund Citation2005; Juvkam, Sørlie, and Texmon Citation2010). Moreover, there is an emerging strand of literature that addresses the uneven geography of ageing and consider how it is shaped by the interplay between immobility and mobility (Atkins Citation2018). Finally, at the individual level we regard ageing very much as a social phenomenon; individuals are not atomistic entities, they live linked lives (Dykstra and Hagestad Citation2016; Herlofson and Hagestad Citation2011) – or to term it different they are individuals in relation(s) (Nelson Citation1994). The access to kinship and spousal links is obviously part of the life. In older years it is reasonable to assume that they affect both the need for different types of care and support – and it affects the division of work between family and welfare agencies in the provision of this.
While the first pillar is an undeniable fact, the other two highlights the idea that age and old age are relational processes among people and places (Cole, Ray, and Kastenbaum Citation2010, 19). Our article have an empirical approach and ambition, and we anchor the empirical analyses and mappings theoretically in the traditions of critical gerontology and in the life course approach to studies of social interactions and welfare. Particular emphasize is put on the importance of life links (Bernard and Scharf Citation2007, 13, Dykstra and Hagestad Citation2016).
There has been quite a lot of attention to the fact that care and housing policy need to address population ageing (e.g. Aanesen, Lotherington, and Olsen Citation2011; Abramsson and Andersson Citation2016; Mandič Citation2016). There is also an increasing awareness of the need for what is termed gerontological social work. By this we think of … methods of social work to enhance the quality of life of older adults and their families, to support older adults capabilities and to solve their social problems (Rossi, Seppänen, and Outila Citation2018, 134). There is also claimed that acknowledging gerontological social work as a particular field enables learning and accumulation of experiences (Damron Rodriguez and Corley Citation2003; Söderberg Citation2018).
Our paper can in part be read as a paper on special characteristics of the Oslo demographics and how that may feed into need for preparedness for population ageing. In order to illuminate this question we compare both traditional head count demographics and what we term life links adjusted shares of older people in three rather different regions: Oslo, Akershus and Helgeland. Life links adjustments account for presence and age of a spouse and presence and spatial proximity of children.
In short our research question is: Does a focus on head count demographics hide important aspects of the challenges posed upon welfare agencies when preparing for and undertaking social work in practise? Are one underestimating the challenges ageing poses upon major cities if one only use head count demographics as a tool?
In order to illuminate our research questions we start out with a description of the specifics of the simple head count demographics of the three regions studied and a very brief overview of literature that demonstrate drivers behind divergent demographic trajectories in larger cities and elsewhere. Then we continue with a discussion of mechanisms behind the reliance of need for giving attention to the sets of links older persons possess. As a part of this we also refer to some prior empirical and theoretical studies that underpins our claims of the importance of the set of links.
Background
Patterns of population ageing differ across the Norwegian geography. In order to illustrate the magnitude of these differences we study population composition in three regions: The municipality of Oslo, Akershus county and Helgeland. The analyses in our article relies on our access to high quality register data with complete coverage of the population. From population registers we are able to identify both age and the municipal in which anyone resides. To this we merge information on spousal and kinship ties through the use of unique parent-child and family identifiers. Data compiled from these sort of registers is particular valuable when studying vulnerable groups where non-random selection is likely to bias, e.g. in survey based studies.
Information on geographical location of any parent-child pair enables us categorize them as to whether they live in the proximity of each other. Proximity is in our analyses defined as living in the same region. Obviously, also other definitions would yield insight.
Oslo and Akershus taken together are often referred to as Greater Oslo or Oslo Metropolitan area. Oslo is the capital of Norway and consists of a single municipality; in 2014 the total population of Oslo was 634,000. Akershus is the county surrounding Oslo, a quite high share of the population of Akershus has their work place in Oslo. A total population of 576,000 inhabitants was distributed over 22 municipalities.
Helgeland is the southernmost region in North-Norway, spanning the region between Trøndelag and the polar circle. It is the smallest of the three regions considered, with 18 municipalities and 78,250 inhabitants. Note that while the population of both Oslo and Akershus grew by around 33% over the 20 years from 1994 to 2014, it declined by 2.1% in Helgeland. While the first two locations were selected for its importance as capital and metropolitan area, Helgeland was selected as it has a demographic history that deviates strongly from the capital region. As in many other countries, Norway is experiencing a long lasting trend of agglomeration around metropolitan areas, with less central location left behind with a greater share of the older population on the total population.
A prime ambition of our paper is to add to the empirical based understanding of population ageing in Metropolitan regions. In order to do that we obviously need to study patterns within the region. The reason why we study also the Helgeland region is that we will use this as a contrast which helps us illustrating the particularities of the Metropolitan region.
The differences in the age structure can be illustrated by a kind of cross-sectional equivalent to a set of (Kaplan-Meier) survival curves:
Figure 1. Population composition 2014, by age and region.
We call them cross-sectional equivalents to survival curves, as they are not following the same set of individuals over time. At, e.g. age t the ‘survival’ curves give the share of the total population who is t years of age – or older, at the start of 2014. The curves as given in is raw population shares, not smoothed in any parametric manner; therefore, we call them Kaplan-Meier (equivalence of) survival curves.
These rather large differences in the share of the 70+ population are not driven by regional differences in life expectancy.Footnote1 The main drivers are historical fertility rates and even more important, accumulated consequences of mobility patterns over the post WW2 period.
It is well known and documented that population ageing is a gendered phenomenon (e.g. Herlofson and Hagestad Citation2011). Older women are still disproportionally living in poverty or at risk of poverty in most parts of the world (United Nations, Department of Economic and Social Affairs, Population Division, ‘World Population Ageing Citation2015’). Historical and structural differences impacting women’s opportunities does not simply disappear when they grow old. Males and females age differently, they have different life expectancy and males and females age in (very) different social contexts. This latter aspect is central for our arguments. Hence, it is of interest how the older persons population is composed according to gender, and whether this differs between the regions considered. In we illustrate this by reporting the female shares in the group of individuals aged t or more, for all t equal to 70 and onwards.
Figure 2. Share of females in the population above age t, by region and age – percent.
The figure above shows us two tendencies. The first, and well-known one, is that females dominates (in numbers) more and more as we move up the age ladder. Second, we see that the female surplus differs between regions. At all age cut-offs there is a higher share of females in the older people population in Oslo than it is in the other regions. Comparing, e.g. Oslo and Akershus we find that the shares of females are about 5 percentage points higher in Oslo.
The specificities of the demographics of Nordic capitals explains part of the patterns of the figures above, while the specificities of the urban regions more generally explain part of it. To start with the former, it has been observed that there is a high share of youths moving in to the capital by the age of say 20–25 and stay for a while; after a say 10–15 year-long period have elapsed we observe that 60% of the in-movers have moved on (Juvkam, Sørlie, and Texmon Citation2010). A large group of the out-movers move back to the regions where they (or their spouse) resided when adolescent (Løken, Lommerud, and Lundberg Citation2013). This pattern of in- and out-mobility have prevailed for at least half a century, and it has accumulated into the present demographic pattern of Oslo and other Nordic capitals. An advertisement in the window of a funeral agency in Helsinki provides a striking illustration: we bring dead corpses home to the countryside. Some of us spend our lives in the capital, but damn, when we die we want to go home.
An important aspect of the flows into and out of Oslo (as in other Nordic capitals) is that especially the outflows are not in any way random; rather, out-movers are systematically selected. An enduring process where a number of young persons are moving in and staying for some years, and after 10–20 years a large share of them move out leaves Oslo with a population that is permanently younger than the national population. Moreover, the propensity to move out is higher for those forming a family (either alone with a partner or with a partner and children) and for those who are in-movers. In short, an enduring process of selection yields an outcome in terms of population composition in Oslo that differs from that in other parts of the country along many dimensions. Moreover, the selective mobility is mostly taking place in the early phases of the adult life course; still, as it has been going on for a considerable period, we find clear traces of it also in the composition of the older people population. This is evident from the figures above.
In a large number of cities across the world, one observes a surplus of females. Starting from this observation, Edlund (Citation2005) hypothesize that this may be due to urban-rural differences in the monetary pay-off to skills and male-female differences in preferences for prospective spouses. Her argument is that both high-skilled males and females are attracted to the city. If there in addition is so that males have preferences for, e.g. fecundity and females have preferences for income and social position when choosing a spouse, this may generate a female surplus in cities. The simple arguments is that while own skills attract males to the city, both own skills and high-skill (and earner) males will attract females to the city. If these mechanisms exist, we would expect a female surplus in urban regions – just as empirically observed. Admittedly, the observed patterns may also have been generated by other mechanisms.
Linked lives and support in late adulthood
Along kinship lines and across generations people care for each other. We care for each other in terms of love, obligation and by our own well-being being tied to the well-being of relevant others. Moreover, we care for each other in terms of taking care of each other. Family ties may provide sources of care due to filial norms and obligations (Daatland and Herlofson Citation2003). No matter what is the causes of it, it is an established fact that support, in many different forms, flows along kinship lines (e.g. Albertini, Kohli, and Vogel Citation2007; Daatland and Lowenstein Citation2005).
Income sharing is perhaps the most tangible form of support. In this sense, the gender differences are also noted. In the United States, for example, the single greatest risk of falling into poverty in old age is related to the death of a spouse. The gender pay gap and women’s’ longevity, nearly three times as likely as older men to be widowed, makes this groups disproportionately affected (Burkhauser and Smeeding Citation1994).
Some attribute the existence of support across generations to what is termed a demonstration effect. The mechanism yielding the demonstration effect is a presumption that adults supports their parents as a way to teach their own children to do the same when pertinent; hence, support is a way to invest in future receivership of support (Cox and Stark Citation2005). As a consequence, if you have grandchildren you are expected to receive more support from your own children. If the demonstration effect is at work, grandparents are in a more favourable position when in need of support, even if grandchildren does not contribute by anything in excess of existence. We are inclined to think that care that flows up and down in grandparent-parent-child-dyads, do so primarily because we care for each other; not as an investment in future receivership. Having said that, the quoted study of Cox and Stark, gives empirical indications of relevance and existence of a demonstration effect.
Anecdotal evidence, casual observation and our intuition see adult children as a source of practical help and being ‘taken care of’, when needs arise because of decline capacity during the later segments of the life course. Prior to the birth of the (modern) welfare states this was (and in some non-western societies is) the dominant form of care for older persons. In some countries in the southern family oriented welfare regime there still exist a legal filial obligation to provide for older relatives in need (Daatland and Lowenstein Citation2005).
In Norway there is no legal obligation to provide or care for older parents who need support of different sorts. There do however exist empirical studies that clearly demonstrate the role of kinship. A study shows that in a sample of grandparents aged around 60+, 28% had parents still alive. Out of these, about one in four provided care and support to the parents on a regular basis (Herlofson Citation2015). Moreover, the study demonstrates that the in-kind support given by 60–65 year olds to parents still alive, is not negatively related to presence of grandchildren or to the amount of practical support provided to child care.
There also exist studies that demonstrate that parents’ care needs feed negatively into female labour force participation (Kotsadam Citation2011) and positively into sickness absence (Ugreninov Citation2012). A mirror image of this is of course that some older parents receive this support. Hence, there is empirical support for claims of offsprings to play a role for care provision of older parents in need. Even in Norway where there are no filial obligations to support parents in need, empirical studies demonstrate that care managers do actually consider presence and proximity of kin when allocating care services (Jakobsson et al. Citation2016).
Off-springs and a spouse are possible sources of social, emotional and practical support and even care. It is not, however, obvious that the probability of being ‘taken care of’ is proportional in the number of relevant others. If there are many possible providers of care the feeling of obligation of each of the, e.g. off-springs may be lowered (Herlofson and Hagestad Citation2011). It might even emerge a waiting game between siblings where one manoeuvre so that burdens are shifted towards other than oneself; Rainer and Siedler (Citation2009) demonstrate how older siblings have a first-mover advantage in so far as they can move away from parents who are not left alone because the younger siblings are still nearby. This opportunity is not present for younger siblings.Footnote2 Still, empirical studies tend to find that having more prospective providers of kin-support increases the probability and expected amount of support, but far less than proportionally (Herlofson and Hagestad Citation2011).
Cognitive decline may be the cause of care need, and care need may arise for physical reasons in a phase of life when agency and decision making competence is not completely intact (Thurow Citation1974). This together with the heterogeneity of care interventions and the problems of signalling needs perfectly, imply that needs are not always easily observed and communicated. Even if you are entitled to adequate care and support, it is not always obvious what adequate care and support is. Hence, in order to obtain sufficient and adequate care and services one might need someone to stand up for you and to negotiate and monitor the services given (Eika Citation2009; Eika and Kjølsrød. Citation2013). There is a real concern for inequalities arising between older people with well-articulated strong agents and those who do not have such agents (Townsend Citation1981). It is pertinent to mention that when Daatland and Herlofson (Citation2003) discuss the role of kin for frail older people, they point towards the roles as both care providers and as care managers.
As demonstrated by Antonucci, Akiyama, and Takahashi (Citation2004), the convoys of close relationships becomes more and more concentrated to kin as we age. This may imply that older people with less kinship links in life run a higher risk of loneliness, less day-to-day contact with others and less sense of purpose by engagement in the life course of relevant others. It may therefore be reason to fear that older persons with small or no kinship links are more vulnerable both in terms of reduced well-being and declining cognitive capacity (Hansen and Slagsvold Citation2016; Nordvik Citation2018), as such it is important also for welfare service providing agency.
So what is the purpose of this section on Linked lives and support in late adulthood? It should be seen as a kind of (incomplete) catalogue of important arguments and channels through which kinship links may affect our situations and well-being as we grow older and our capacity and health may deteriorate. Hence life links matter, both for individuals as they age. In a society where health and social services are a common (i.e. public) responsibility it also matter for health and welfare providing agencies.
Linked lives: some partial descriptions
As argued earlier on, the social surroundings of individuals as they gradually age is important for well-being and for the need for different kinds of support from (public) welfare agencies. Individuals live linked lives; the social surroundings can be called (the set of) individuals links in life. Here we will describe the older population in terms of three different types of links. First and foremost, we will consider presence of a spouse, then we will consider whether individuals have children and whether they live close by or not. Finally, we map the existence of grandchildren; here we have chosen to report the existence of grandchildren aged 15 years or more. Finally we turn to a mapping of those who lack more than one type of life links.
Spouse
The share who resides together with his/her spouse varies considerably by age and between males and females. A bit less intuitively, it also varies between the three regions we consider here. These patterns are evident from . Note that the categories: With spouse, Widow(er) and Divorced are mutually exclusive and defined according to the situation as it was at the start of 2014. Hence, an individual who was divorced or widowed in say 2010, will be counted as a divorcee/widow(er) in 2014 if (s)he has not been registered as residing with a spouse between 2010 and 2014. If, however, (s)he has repartnered, (s)he is classified as living with a spouse.
Table 1. Spousal situation 2014, by age and gender
The most striking feature about the spousal situation of older inhabitants in the three regions is the low shares residing with a spouse among females in Oslo. Among the young older females, the share residing with a spouse is approximately similar in Helgeland and Akershus (about 80%); while it is close to 20 percentage points lower in Oslo. Also among the oldest old, the females in Oslo stands out with a lower share residing with a spouse. It is worth noting that not only do Oslo stand out with a very much lower share among older females who lives without a spouse, females constitutes a larger share of the older population in Oslo than it does in the other regions considered. Hence, in a comparative perspective we can conclude that the older population of Oslo has an over-proportional share of older females. Note that also among males, Oslo stands out with lower shares residing with a spouse.
We also see that divorces play a significant role for spousal situations, and more so for the younger old persons. Moreover, we observe that far more females are divorced. This probably is related to gender differences in re-coupling probabilities, differences in life expectancies and maybe gender differences in how mortality is affected by a divorce. The same set of possible explanations apply to the observation that fewer in the oldest group of old persons are divorced than in in the younger group. Cohort differences in divorce propensities may also have contributed to the latter observation.
For our analyses of regional differences in vulnerability among older people, the most striking feature is the fact while 20% of females 70–79 in Oslo is divorced only a bit more than one-third of this share is found in Helgeland. At a lower level, the same pattern is found among the oldest – and among males.
The relative incidence of widowhood among older persons in the three region does not exhibit any marked geographical pattern. Due to the traditional age differences between spouses and the shorter life expectancy of males we do however, find far more widows than widowers. As a matter of act we find that in the three regions taken together, 88% of those aged above 70 that are widowed are a widow (as opposed to a widower). This share do not vary much between regions. Note also that a study reported an almost identical share for the 65+ population in the United States in the beginning of the 1980’s (Hagestad Citation1988). However, similar widowhood-rates among females across regions means that there is a higher share of widows in the elderly population in Oslo as females constitute a higher share of the females in the elder population there.
A spouse is a source of love, affection, burdens, constraints, support, practical help, purpose, monetary provision, belonging, insurance, irritation etc … A spouse is all this and for better and worse, a lot more. The point is that a spouse most often is not one single of these characteristics, but everything simultaneously. What is important in our context is that the balance of these characteristics probably varies over the life course – it varies both with one’s own age and that of the spouse. Consequently, the capacity of a spouse to ease any problems that may arise as one ages, depend on the age of the spouse. Taking the view of public welfare and health care providers one can also say that the need of services and support does not only depend on presence of a spouse but also of his/her age.
The use of so broad age categories as 70–79 and 80+ may mask some age patterns. In , we therefore map age differences between spouses in Oslo according to age, separately for males and females. The boxes ranges from the lower to the upper quartile, while the midpoint is the median.
Figure 3. Age difference spouses, Oslo 2014, by age and gender.
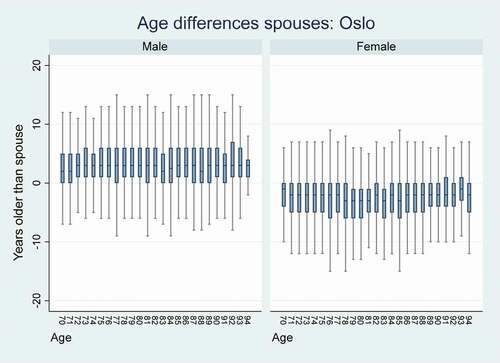
The figure reveals two distinct patterns. First, the figure provides a striking illustration of the well-known fact that females tend to be a couple of years younger than their spouse and male a couple of years older – at least in the cohorts considered here. Second, that there is virtually no difference in age differences between spouses across ages. Differences are so persistent across ages that it is surprising, considering the gender differences in mortality.
Next, we ask whether there are any differences between the distributions of age difference between spouses in the three regions considered. Here we restrict ourselves to illustration of age differences between males and their spouses.
Figure 4. Age differences between spouses, males, by age and region.
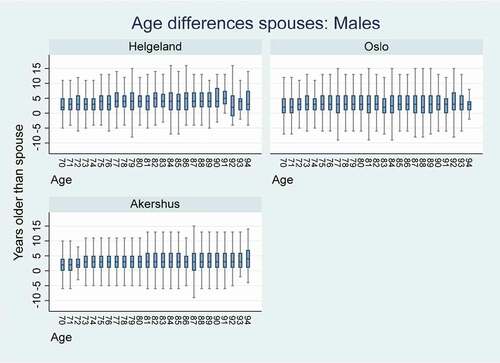
Inspection of the patterns in the figure of age differences between males and their spouse in Helgeland, Oslo and Akershus () do not reveal any geographical patterns. The same holds true when inspecting female patterns (not reported here).
Children: existence and proximity
In the age groups we consider, most children have been adults for a long time. Hence, we obviously use the term children to describe position in kinship relations, not to describe the age of a person. Children may play an important role in the lives of older people. As for spouses, this role is many-facetted and there are obviously huge individual variations in these roles.
In , we report the shares who has no children and the shares who does not have any children in the same region. Distance (in geographical terms) between parents and children forms an opportunity structure for support between generations. Support between generations is not any single thing, but consists of many different dimensions. Some aspects such as monetary and emotional support may be independent of the geographical distance between parents and children. In the context of ageing, one might also speculate that the capacity to act on behalf of parents in crucial situation, e.g. in the contact with health and care agencies also is present, even over longer distances. Other types of support, such as, e.g. popping in and shop milk and bread, distance is crucial. With the category ‘No children in the same region’ we aim to capture differences in the opportunities to receive and give support. For Helgeland, Helgeland is defined as the same region; for Oslo and Akershus, both Oslo and Akershus is defined as being the same region.Footnote3
Table 2. Older persons according to existence and proximity of children, by gender, age and region
Most older people in our three regions have children; a clear majority also have children residing in the same region. Moreover, one can say that the table reveals that existence and proximity to children varies both according to gender and region and, to a lesser degree, age. The variations are rather complex and we highlight only some selected patterns in them.
Among females, childlessness is clearly lowest in the Helgeland region. However, there has been a tendency of out-migration of young people from the less central parts of Norway over the last 50 years (Juvkam, Sørlie, and Texmon Citation2010; Nordvik and Gulbrandsen Citation2009). A result of this is that the difference between the share with no children and the share with no children in the same region is marked higher in Helgeland than in the two more central regions, both in relative and absolute terms. Despite of the high out-migration of the children of the Helgeland females, the incidence of a situation where females do not have any children in the same region is a bit more than five percentage points higher in Oslo than in Helgeland.
The lowest shares who do not have any children in the same region is found in Akershus. This applies both to males and females and in both age groups. A bit sweeping, one can say that males in Helgeland and females in Oslo fare worst in terms of having children in the proximity as they age. This is probably due to selection.
Obviously, the incidence of childlessness and no children in the geographical proximity informs quite a bit about access to support in practical and emotional terms. However, there is a difference between having one child and having more children. Without going into depth of the character of differences one can say that there is differences in terms of risk (the risk of being ignored by one child is probably higher than the risk of being ignored by twoFootnote4), of the total amount of available support and probably also in terms of heterogeneity of types of support. We therefore continue our investigations of family ties of older people in the three regions by comparing mean number of children ().
Table 3. Average number of children and children in same region. Older persons, by gender, age and region
When it comes to number of children, very much of the same geographical patterns we saw in the incidence of childlessness, emerge. Individuals in Helgeland have on average more children than those in Akershus, who again have more children than those residing in Oslo. When we compare the average number of children to the number of children residing in the same region we also see a clear geographical patterns. The older in Oslo and Akershus have ‘lost’ 22–24% of their children to migration out of the region, in Helgeland the corresponding ‘loss’ due to out-migration is larger with average shares of 36–40%. However, due to the higher overall number of children the ranking where older persons in Helgeland have the highest number of children nearby, followed by Akershus, still prevails for females, even when controlling for out-migration. The pattern is less clear for the males.
Grand children
Family ties extends, of course, across generations. There is a vast literature on the role grandparents play when it comes to support and practical help in care for children of their children (i.e. of the grandchildren) when they are in need of care. Our focus here is that as time passes by both grandchildren and grandparents become older, and the roles changes. Grandchildren aged 15 years or more might be a source of both some kinds of practical help and valuable social contact. Our hypothesis is that the existence of grandchildren in the proximity (i.e. in the same region) and elsewhere is a valuable addition to the set of links of individuals as they age.Footnote5
Again we see on that the older in Helgeland is better positioned when it comes to the set of family links in the form of grandchildren nearby or elsewhere than in the two other regions considered, and that the group of older in Oslo is worst positioned. The demonstration of this is complementing the picture we saw for children, and we do not enter into any closer analysis here.
Table 4. Average number of grandchildren and grandchildren (15 years+) in same region. Older persons, by gender, age and region
Some vulnerable positions and their prevalence and regional variation
Up to now we have considered one and one element in the set of links. For individual lives, close relations (elements in the set of linked lives) complements and substitutes for each other. For example the importance of having a child in the proximity may be lesser for older people with a fit spouse than for a single or a person with a spouse also in need of some kind of support. Our focus here is on prevalence of the most vulnerable positions and its geographical variation. As argued earlier, it is these most vulnerable positions that warrant most attention from welfare agencies.
The sets of links considered here (and even more in real life) are diverse and complex, we simplify by considering two simple and rather similar, but still different, positions.
Not having a spouse aged 80 years or less and not having any children.
Not having a spouse aged 80 years or less and not having any children residing in the same region as yourself.
We start out demonstrating how these positions are distributed according to age in the older population in the three regions. For brevity we will sometimes use the phrase life links adjusted shares of older when referring to the prevalence of the positions (i) and (ii), described above.
Composition of the older population
In some instances the mere existence of children matters for well-being and need for support from different types of welfare agencies. This can be due to the role of children as agents when needed, and it can be due to emotional support and to a feeling of purpose and direction in the life. All these functions of a parent-adult child relation can be at work, even over long geographical distances. Hence, lack of both children and a spouse can generate a lacuna in the life of older people.
Figure 5. – Share of older adults without spouse aged 80 years or less, nor with any children.
confirms the picture seen earlier when these two indicators were considered in isolation. The incidence of no close family ties are far higher in Oslo than it is in the two other regions. At all age steps, the share without a spouse aged 80 or less nor any children is about 10 percentage points higher in Oslo than in the other two regions – or to put it differently it is around twice as high in Oslo. Moreover, this vulnerable position is increasing in age. The latter observation is of course not very surprising, albeit a bit discouraging. The access to kinship ties is lower the higher the likelihood of needing them is.
Some types of support warrants spatial proximity, while other types do not. In terms of support and usefulness it differs whether you have a son living close by or a daughter residing far away. Therefore we next consider the incidence of not having a spouse aged 80 years or less nor any children residing in the same region.
Figure 6. – Share of older adults without spouse aged 80 years or less, nor with any children residing in the same region.
Also when it comes to shares of the older people, at each age-step, who do not live with a relatively ‘young’ spouse and do not have children residing in the same region, Oslo stands out with high prevalence. We see from , however, that when taking account of whether children reside in the same region we see that among the oldest old in the rural region, Helgeland, resembles Oslo. Moreover, the differences between Oslo and Helgeland is smaller in this case, at the younger segments of what we have defined as the life course as ‘older person’. This ‘convergence’ of course is due to the fact that even if older people in the Helgeland region have more children than their counterparts in Oslo, more older persons in Helgeland have experienced that all children have left the region as adults. The differences between Akershus and Oslo remains high.
Our main thesis in this article is that older people with limited kinship ties warrant more attention from different health and welfare agencies. Continuing from this point of departure our investigations of kinship ties the results shown in the two figures above demonstrate that a random older person in Oslo (on average) warrants more attention from welfare providers than older person in the two other regions do. This is a concrete finding with a great potential to improve social work practices in Norway. By adopting a critical approach focused on family links and spatial variations, gerontological social work can better understand the possible hidden vulnerabilities and challenges posed to specific communities of older persons.
Older people in vulnerable positions as compared to the total population
Obviously, older persons are not burdens to the society, they are (part of) the society. However, it is as self-evident that under a welfare regime (or under a social contract) where health, care and well-being in a wider sense of the inhabitants, is a collectively shared responsibility, the total amount of needs binds resources – resources with alternative uses. As we hypothesize that needs of this kind (at the population level) are increasing in age and somewhat decreasing in the existence of ‘life links’, it follows that resource constraints and opportunity sets are affected by our measures of the share of individuals at different ages without close kinship or spousal ties. Moreover, services are by necessity locally provided and in Norway also partly locally funded. From this it follows that local/regional variations in share of individuals at different ages without close kinship or spousal ties feed into variations in opportunity sets and necessary attention.
From the arguments above we would claim that it follows that local health and welfare providers need to utilize information on not only head count demographics when assessing need for resources allocated to the wider elder care sector. There is also a need for information on the extent of vulnerable positions among the older persons. More specifically, there is a need for a preparedness and an awareness of special needs for social work interventions that might arise in a population of older people.
We propose the equivalence of the Kaplan-Meier curves used earlier in the paper as a tool for this preparedness and awareness. The equivalence of the Kaplan-Meier curves combine three crucial pieces of information: the total population in a region, the number of older people at each age and the share of them who have neither a spouse aged 80 years or less and no children (at all or residing in the same region). That is at, e.g. the age 76, the Kaplan-Meier equivalent curve give the number of older persons aged 76 or more, who has no ‘young’ spouse nor any children, as a share of the total population.
Figure 7. Kaplan-Meier equivalent, neither spouse 80 years of age or younger nor any children.
The most fascinating pattern revealed in is the contrast to the Kaplan-Meier equivalents based on the pure head count demographic approach (cfr. ). While Helgeland had the highest incidence of older persons as a share of the population at every age step when counting heads and Oslo had the lowest share. The picture is turned completely upside down when we consider what we could term our linked lives adjusted measures of needs for attention from welfare agencies arising from vulnerability in the older population.
Another aspect that is evident from is that the life link adjusted share of older people in the population is by far lowest in Akershus. And it is far lower than in Oslo, even though Oslo had a lower head count prevalence of older persons. As discussed earlier, this later finding is the combined effect of sorting of family-oriented individuals out of Oslo to Akershus, and a rather low head count prevalence of older people in Akershus.
For many purposes an adult child residing close by plays a more significant role in the life of older parents, than a child residing 1,000 km away. In order to capture this we also present life link adjusted Kaplan-Meier equivalent survival curves for older people who do not have a relative young spouse nor any children residing in the same region ().
Figure 8. Kaplan-Meier equivalent, neither spouse 80 years of age or younger nor any children residing in the same region.
From the partial descriptions we saw that older persons in Helgeland to a larger degree than those in Oslo lived with a spouse, had more children and even though a higher share of the children had left the Helgeland region they had more children left in the same region than the older people Oslo had. Moreover, we saw in the partial descriptions that among females (who constitute a majority of the older population, especially in Oslo) the incidence of not having any children in the same region was lower in Helgeland than in Oslo. Despite of all this, the Kaplan-Meier equivalence of Helgeland lies well above Oslo up to the age 89; the reason for this is simply that older people over all constitutes a larger share of the population in Helgeland than in Oslo. This underscores the importance of considering all aspects of head count demographics and life link adjusted demographics.
Very much of the same mechanisms contribute to the pattern where Akershus have rather low (as compared to both Oslo and Helgeland) shares of life link adjusted older persons.
We do not claim that head count demographics are irrelevant and that our linked lives adjusted measures are the relevant measure. It is more that we claim that population ageing and the societal challenges it poses should be addressed in a multidimensional way, and that the geographical variations in the sets of life links are so large that planners and welfare providers who ignore them may make misinformed decisions, and may run into surprises in the total demand for (or need of) welfare services.
In the partial descriptions we showed that there is clear differences between the three regions when it comes to both the number grandchildren above 15 years of age and of the number of grandchildren above 15 residing in the same region. This information is not utilized in the links of lives adjusted shares presented above. The reason for this simplification is simply that there are so few observations of older people without a spouse aged below 80, no children and who have grandchildren above 15 years of age. This is true either we restrict ourselves to children/grandchildren in the same region or not.
Some caveats
We have considered potential life links originating in descending kinship lines and in spousal relationships. Moreover we have used register data to map the sets of such links, without any attrition (apart from deaths). What we have not done is considering actual links, and the impact of important contemporary developments of family patterns. In a context of increased re-partnering, due to widowhood or divorce for example, what happens to the kinship links? Does a father capitalize as much on the links to his off-spring(s) if he has divorced their mother, does it matter whether he or the mother initiated the divorce, and does remarriage play a role? A quote hints that the answer to these questions are not necessarily straight-forward … family relationships become highly complex and characterized by a great deal of ambiguity (Hagestad Citation1988, 408).
Obviously, some older persons have important and valuable actual links that are neither rooted in descending kinship lines nor in spousal relationships. This can typically be brothers and sisters, or it can be close friendships. Important links and attachments do tend to persist, some term these persistent links as convoys of attachment over the life course (Antonucci, Akiyama, and Takahashi Citation2004). We note that the quoted study of Antonucci and collaborators find that the inner circle of the convoys in an increasing degree consists of spouse and off-springs as individuals reach the ages we are considering in our analyses.
Moreover, not all potential links are actualized. For example having off-spring(s) does not ensure practical help, care and emotional support when you need it, even if the off-spring resides next door to you; we expect it to be huge variations in the extent and form of involvement in the lives of each other across families and family dyads. Some of the same may be said about the quality of spousal relations. There is variation between spouses with regard to quantity and quality of the support received when in need, e.g. due to frailty.
Concluding remarks
As previously discussed, a basic premise of the critical gerontological approach is that age and old age are not uniform and are strongly shaped by relations. We started out the paper questioning whether the impression, based on head count demographics, of smaller challenges due to population ageing in Oslo as opposed to other parts of Norway holds true when also taking the social context into consideration. Interpreting social context as set of (spousal and kinship) life links we find that older persons in Oslo are more vulnerable. Older people in Oslo have fewer children, childlessness is more prevalent – and they do to a lesser degree reside together with a spouse. This may have implications for the need for support both in terms of care and social policies. Moreover, we demonstrate that the female surplus in the older population is far stronger in Oslo than in the two other regions considered (Akershus and Helgeland).
Moreover, we demonstrate that the differences in linked lives are more due to persistent geographic-demographic forces than it is to random historic legacies. Hence, we will claim that there is a need for an increased attention to not only head count demographics, but also to the uneven geographic distribution of life links.
The type of analyses and mappings we have undertaken in this paper should be complemented by analyses of how differences in access to sets of links actually feed into need for support from public welfare and care agencies, and how it feed into variations in wellbeing among older people. This task could be undertaken by survey-based investigations or by systematic collections of experiences from professionals in the fields of care and social support – preferably from both these sources.
Disclosure statement
No potential conflict of interest was reported by the authors.
Additional information
Funding
Notes
1. Information from Statbank, Statistics Norway, https://www.ssb.no/en/statbank/table/05797/?rxid=e106197b-ce88-45b9-9f3e-eff712958824, accessed 8.5.2018.
2. Note also that this argument demonstrate that geographical distance is not something that happens (in any exogenous manner) in family dyads.
3. Admittedly, any specific definition of what constitutes the same region is a bit arbitrary.
4. Admittedly it is possible that two or more off-springs can play a waiting game against each other, in order to push any burdens over to his/her sibling. A child without any siblings (nearby) does not have this opportunity.
5. Also here one can say that the exact age cut-off of 15 years of age is arbitrary – as any specific cut-off will be.
References
- Aanesen, M., A. T. Lotherington, and F. Olsen. 2011. “Smarter Elder Care? A Cost-effectiveness Analysis of Implementing Technology in Elder Care.” Health Informatics Journal 17 (3): 161–172. doi:https://doi.org/10.1177/1460458211409716.
- Abramsson, M., and E. Andersson. 2016. “Changing Preferences with Ageing–Housing Choices and Housing Plans of Older People.” Housing, Theory and Society 33 (2): 217–241. doi:https://doi.org/10.1080/14036096.2015.1104385.
- Albertini, M., M. Kohli, and C. Vogel. 2007. “Intergenerational Transfers of Time and Money in European Families: Common Patterns—different Regimes?” Journal of European Social Policy 17 (4): 319–334. doi:https://doi.org/10.1177/0958928707081068.
- Antonucci, T., H. Akiyama, and K. Takahashi. 2004. “Attachment and Close Relationships across the Life Span.” Attachment & Human Development 6 (4): 353–370. doi:https://doi.org/10.1080/1461673042000303136.
- Atkins, M. T. 2018. “‘On the Move, or Staying Put?’ an Analysis of Intrametropolitan Residential Mobility and Ageing in Place.” Population, Space and Place 24 (3): e2096. doi:https://doi.org/10.1002/psp.2096.
- Bernard, M., and T. Scharf, (Eds). 2007. Critical Perspectives on Ageing Societies. Ageing and the Lifecourse. Bristol, UK: Policy
- Burkhauser, R. V., and T. M. Smeeding. 1994. “Social Security Reform: A Budget Neutral Approach to Reducing Older Women’s Disproportional Risk of Poverty.” SSRN Scholarly Paper. Rochester, NY: Social Science Research Network. https://papers.ssrn.com/abstract=1824592
- Cole, T. R., R. E. Ray, and R. Kastenbaum. 2010. A Guide to Humanistic Studies in Aging: What Does It Mean to Grow Old? Baltimore, MD: Johns Hopkins University Press.
- Cox, D., and O. Stark. 2005. “On the Demand for Grandchildren: Tied Transfers and the Demonstration Effect.” Journal of Public Economics 89 (9): 1665–1697. doi:https://doi.org/10.1016/j.jpubeco.2004.04.005.
- Daatland, S. O., and A. Lowenstein. 2005. “Intergenerational Solidarity and the Family–welfare State Balance.” European Journal of Ageing 2 (3): 174–182. doi:https://doi.org/10.1007/s10433-005-0001-1.
- Daatland, S. O., and K. Herlofson. 2003. “‘Lost Solidarity’ or ‘Changed Solidarity’: A Comparative European View of Normative Family Solidarity.” Ageing and Society 23 (5): 537–560. doi:https://doi.org/10.1017/S0144686X03001272.
- Damron Rodriguez, J., and C. S. Corley. 2003. “Social Work Education for Interdisciplinary Practice with Older Adults and Their Families.” Journal of Gerontological Social Work 39 (1–2): 37–55. doi:https://doi.org/10.1300/J083v39n01_05.
- Dykstra, P. A., and G. O. Hagestad. 2016. “How Demographic Patterns and Social Policies Shape Interdependence among Lives in the Family Realm.” Population Horizons 13 (2): 54–62. doi:https://doi.org/10.1515/pophzn-2016-0004.
- Edlund, L. 2005. “Sex and the City.” The Scandinavian Journal of Economics 107 (1): 25–44. doi:https://doi.org/10.1111/j.1467-9442.2005.00393.x.
- Eika, K. H. 2009. “The Challenge of Obtaining Quality Care: Limited Consumer Sovereignty in Human Services.” Feminist Economics 15 (1): 113–137. doi:https://doi.org/10.1080/13545700802446658.
- Eika, K. H., and L. Kjølsrød. 2013. “The Difference in Principle between the Poorly Informed and the Powerless: A Call for Contestable Authority.” Nordic Social Work Research 3 (1): 78–93. doi:https://doi.org/10.1080/2156857X.2013.776992.
- Hagestad, G. O. 1988. “Demographic Change and the Life Course: Some Emerging Trends in the Family Realm.” Family Relations 37 (4): 405–410. doi:https://doi.org/10.2307/584111.
- Hansen, T., and B. Slagsvold. 2016. “Late-life Loneliness in 11 European Countries: Results from the Generations and Gender Survey.” Social Indicators Research 129 (1): 445–464. doi:https://doi.org/10.1007/s11205-015-1111-6.
- Herlofson, K. 2015. “Lengre liv, nye hjelpemønstre i familien” Sosiologi i dag 45 (3): 24-45.
- Herlofson, K., and G. O. Hagestad. 2011. “Challenges in Moving from Macro to Micro: Population and Family Structures in Ageing Societies.” Demographic Research 25: 337–370. doi:https://doi.org/10.4054/DemRes.2011.25.10.
- Jakobsson, N., A. Kotsadam, A. Syse, and Ø. Henning. 2016. “Gender Bias in Public Long-term Care? A Survey Experiment among Care Managers.” Journal of Economic Behavior & Organization 131: 126–138. doi:https://doi.org/10.1016/j.jebo.2015.09.004.
- Juvkam, D., K. Sørlie, and I. Texmon. 2010. Demographic Development in Five Cities (in Norwegian: Demografisk utvikling i fem storbyer). Oslo: NIBR report 2010: 16, Norsk institutt for by-og regionforskning.
- Kotsadam, A. 2011. “Does Informal Eldercare Impede Women’s Employment? The Case of European Welfare States.” Feminist Economics 17 (2): 121–144. doi:https://doi.org/10.1080/13545701.2010.543384.
- Løken, K. V., K. E. Lommerud, and S. Lundberg. 2013. “Your Place or Mine? On the Residence Choice of Young Couples in Norway.” Demography 50 (1): 285–310. doi:https://doi.org/10.1007/s13524-012-0142-8.
- Mandič, S. 2016. “Housing for Care: A Response to the Post-transitional Old-age Gap?” Journal of European Social Policy 26 (2): 155–167. doi:https://doi.org/10.1177/0958928716637140.
- Nelson, J. A. 1994. “I, Thou, and Them: Capabilities, Altruism, and Norms in the Economics of Marriage.” The American Economic Review 84 (2): 126–131.
- Nordvik, V. 2018. “En egen boligpolitikk for eldre? En normativ analyse.” Tidsskrift for boligforskning 1 (1): 27–44. doi:https://doi.org/10.18261/.2535-5988-2018-01-03.
- Nordvik, V., and L. Gulbrandsen. 2009. “Regional Patterns in Vacancies, Exits and Rental Housing.” European Urban and Regional Studies 16 (4): 397–408. doi:https://doi.org/10.1177/0969776409102191.
- Putnam, R. D. 2001. Bowling Alone: The Collapse and Revival of American Community. 1st ed. New York, NY: Touchstone Books by Simon & Schuster.
- Rainer, H., and T. Siedler. 2009. “O Brother, Where Art Thou? The Effects of Having a Sibling on Geographic Mobility and Labour Market Outcomes.” Economica 76 (303): 528–556. doi:https://doi.org/10.1111/j.1468-0335.2008.00696.x.
- Rossi, E., M. Seppänen, and M. Outila. 2018. “Assessment, Support and Care-taking: Gerontological Social Work Practices and Knowledge.” Nordic Social Work Research 8 (2): 133–145. doi:https://doi.org/10.1080/2156857X.2016.1269662.
- Söderberg, M. 2018. “A Part of Social Work and Apart from Social Work: Hospital Nurses in Hospital Discharges of Older People in Sweden.” Nordic Social Work Research 8 (2): 146–157. doi:https://doi.org/10.1080/2156857X.2017.1352533.
- Thurow, L. C. 1974. “Cash versus In-kind Transfers.” The American Economic Review 64 (2): 190–195.
- Townsend, P. 1981. “The Structured Dependency of the Elderly: A Creation of Social Policy in the Twentieth Century.” Ageing and Society 1 (1): 5–28. doi:https://doi.org/10.1017/S0144686X81000020.
- Ugreninov, E. 2012. “Fører kombinasjonen av yrkesaktivitet og omsorg for hjelpetrengende foreldre til høyt sykefravær.” Tidsskrift for velferdsforskning 15 (3): 192–206.
- United Nations, Department of Economic and Social Affairs, Population Division. 2015. “World Population Ageing 2015.” New York, NY. http://www.un.org/en/development/desa/population/publications/pdf/ageing/WPA2015_Report.pdf