
Abstract
This study was conducted to determine the effects of different thinning intensities on the DBH growth of Pinus koraiensis and Larix kaempferi trees. Permanent monitoring plots were installed in 26 P. koraiensis plantations and 36 L. kaempferi plantations in 2012 and 2014, respectively. To evaluate the effect of thinning intensity, each plot consisted of three square or rectangular plots; control or non-thinned, light thinning, in which 20% of the total basal area was removed, and heavy thinning, in which 40% of the total basal area was removed. The mean DBH increments for 3 years were computed and compared across thinning intensities. Other factors, such as slope, altitude, or stand density, were compared across thinning treatments to understand why DBH increment did not follow thinning intensity. Overall mean DBH increment for 3 years after thinning was affected by different thinning intensities: heavy thinning > light thinning > control. ANOVA showed that there was a significant difference in DBH increment among thinning intensities in both species. Also, Duncan’s multiple range test showed that all thinning treatments were significantly different from each other. Other factors that affect DBH besides thinning intensity were identified, such as residual basal area, slope gradient, and aspect.
Introduction
One of the major objectives of forest management is to improve stand productivity, for which sustainable and suitable silvicultural practices are required. Decision making for efficient forest management depends on evaluating the effect of silvicultural alternatives on stand development (Zhang et al. Citation1997; Daume and Robertson Citation2000). Controlling stand density by various thinning intensities has been the major tool to regulate tree growth and improve timber quality (Goff and Ottorini Citation1993; Zeide Citation2001, Citation2004; Pretzsch Citation2005; Mecherguit et al. Citation2017).
As thinning effects on stand or individual trees take a long time to occur, much work has been conducted on stand or tree responses to thinning intensities by establishing permanent plots and repeating periodic measurements (Makinen and Isomaki Citation2004a, Citation2004b, Citation2004c; Pfister et al. Citation2007; Cao et al. Citation2008, Citation2010; Nishizono et al. Citation2008; Pelletier and Pitt Citation2008; Wallentin and Nilsson Citation2011). While studies on biomass and carbon storage or tree growth were recently done (Ewane et al. Citation2016; Kim et al. Citation2016a; Kim and Lee Citation2017; Lee et al. Citation2017), few studies have been done on thinning intensities by establishing permanent plots and repeating periodic measurements in South Korea. Choi et al. (Citation2014) conducted growth changes of DBH, height, crown width, volume, stem biomass, and dead trees after thinning with different thinning intensities for a Korean white pine (Pinus koraiensis) plantation. Kim et al. (Citation2016b) examined the effect of thinning intensity on DBH and height growth of Japanese larch (Larix kaempferi) stands. Both studies found that thinning intensity had a significant positive effect on DBH growth, whereas there was no definite effect on height. These studies cannot be applied regionally or nationally because they were conducted on only one or two even aged sites.
Pinus koraiensis and L. kaempferi are two of the most important species in commercial timber plantations South Korea. About 440 thousand hectares and 700 thousand hectares of Korean white pine and Japanese larch have been planted since the 1970s (Korea Forest Research Institute, Citation2012a, Citation2012b). Presently, Korean white pine covers 170,000 ha and Japanese larch 273,000 ha (Korea Forest Service Citation2016). As these plantations mature, intermediate silvicultural practices are needed, especially thinning for producing larger and more valuable trees. Therefore, the objectives of this study were to determine: (1) the effects of thinning intensities on growth (measured as diameter at breast height (DBH)) and (2) other factors besides thinning treatments that affect the DBH increment.
Materials and methods
Study area and data collection
This study was conducted in P. koraiensis and L. kaempferi plantations in the national forests of Gangwon-do and Gyeongsanbuk-do, South Korea. For the study, permanent monitoring plots were installed in 26 sites of P. koraiensis plantations and 36 sites of L. kaempferi plantations in 2012 and 2014 respectively (). Each plantation was chosen for installation in homogeneous and even aged plantations (relative to height, diameter, and number of trees).
Figure 1. Study area location map of the permanent plots for Pinus koraiensis and Larix kaempferi and plot design.
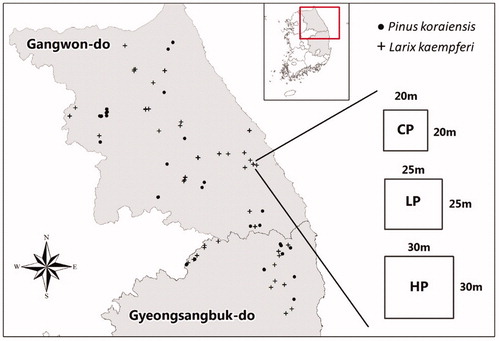
In order to evaluate the effect of thinning intensity on the growth of the two species, each site consisted of three square or rectangular plots; (1) control or non-thinned, (2) light thinning, in which 20% of the total basal area was removed, and (3) heavy thinning in which 40% of the total basal area was removed. Plot size varied, but typically was 0.04 ha (20 m × 20 m) for the control, 0.06 ha (25 m × 25 m) for the light, and 0.09 ha (30 m × 30 m) for the heavy thinning. All plots were surrounded by a 5 m buffer zone. The reason for different size plots by thinning intensity was to ensure each plot had a similar number of trees after thinning.
The principle for selecting trees for removal was based on the assumption that the objective of the residual stand was to produce commercial sawtimber. Therefore, thinning treatment was applied primarily to small, forked, damaged, swept, or trees otherwise unsuitable for sawtimber. Also, we considered spatial relationships between individual trees. DBHs of all trees greater than 6 cm in the plots were measured with 0.1 cm accuracy using D-tape and marked at a height of 1.2 m (with tree number) before thinning in 2012 and 2013. The plots were thinned after completing measurements in that year. DBHs of all trees were measured again in 2015 and 2016 (3 years after plot establishment) to evaluate the response of thinning intensity on DBH growth of P. koraiensis and L. kaempferi.
The summary statistics of the permanent sites for the two species before and after thinning are shown in . The average ages of P. koraiensis stands and L. kaempferi stands were 39 years (15–77 years) and 26 years (19–60 years) respectively. All the mean DBHs of thinned plots increased after thinning because the thinning was primarily from below. Because field work is complex, thinning operations could not be carried out as originally planned. In the control plot, all stands within the plot were supposed to be maintained as is, but some trees were removed from a few control sites because of unfavorable conditions. Most of the trees that were removed from the control plot were non-target species. Very light thinning may have no effect on DBH growth (Smith, Citation1986), so we still consider those plots to be control plots. Actual mean thinning rates based on basal area of P. koraiensis stands were 1% (0–6%) for the control, 21% (13–28%) for the light and 39% (30–45%) for the heavy. Also, actual mean thinning rates of L. kaempferi stands were 1% (0–6%) for the control, 20% (13–29%) for light thinning, and 41% (34–50%) for heavy thinning.
Table 1. Summary statistics of Pinus koraiensis stands and Larix kaempferi stands before and after thinning.
Analysis method
There were two questions of primary interest in this study: the first is whether there was any difference of diameter increment among different thinning intensities and stand densities caused by the thinning and the second was what accounts for differences or indifferences among thinning treatments. Arithmetic and statistical analyses were used to answer these questions. For the arithmetic analysis, the mean DBH increments for 3 years were computed and compared across thinning intensities and stand densities at each site.
For the statistical analysis the analysis of variance (ANOVA) was carried out to determine the effect of various treatments and stand densities on DBH growth and Duncan’s new multiple range test was used to analyze differences among the treatments and densities at each site (α = 0.05). Other factors such as slope, altitude, and stand density were compared across thinning treatments to explain why DBH increment did not follow thinning intensity.
Result and discussion
Overall thinning effect on DBH increment
Overall, the mean DBH increment for 3 years after thinning by thinning intensity was computed and compared across 26 sites of P. koraiensis and 36 sites of L. kaempferi. The results showed that DBH increment was affected by thinning; heavy thinning > light thinning > control as shown in . The increment was greater for P. koraiensis than L. kaempferi in the thinning plots as well as in the control plots. The mean DBH increment of P. koraiensis ranged from 1.66 cm (±0.60) for control, 1.87 cm (±0.67) for light thinning, and 2.26 cm (±0.68) for heavy thinning plots, while the mean DBH increment of L. kaempferi ranged from 1.09 cm (±0.55) for control, 1.32 cm (±0.52) for light thinning, and 1.48 cm (±0.56) for heavy thinning plots.
Table 2. Comparisons of total mean DBH increment by thinning intensity for 3 years.
ANOVA was used to determine the effect of thinning intensities on DBH increment and the results showed that there was a significant difference (p < .01) in DBH increment among thinning intensities in both species. Duncan’s multiple range test showed that each thinning treatment was significantly different from each other. Much other research on thinning intensity described similar results (Cutter et al. Citation1991, Zhang et al. Citation1997; Daume and Robertson Citation2000; Makinen and Isomaki Citation2004a, Citation2004b; Wallentin and Nilsson Citation2011). Kim et al. (Citation2016b) examined the effect of thinning intensity on DBH of Japanese larch (L. kaempferi) stands and found that DBH increment was greater in thinned plots than in control plots, while there was no significant difference among light, medium, and heavy thinning plots.
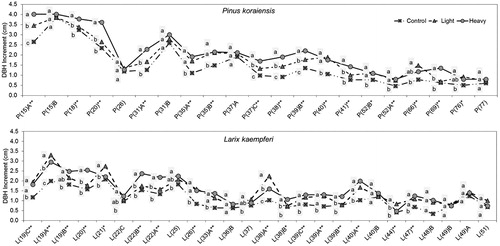
On the other hand, DBH growth was compared for each site in order to investigate the effect of thinning on DBH growth. In P. koraiensis thinned plots (heavy or light thinning) were found to be larger in DBH growth than control plots in 21 of 26 sites (). ANOVA showed that 16 sites were significantly different at the 1% or 5% level. L. kaempferi thinned plots (heavy or light thinning) were found to be larger in DBH growth than control plots in 26 of 36 sites. ANOVA showed that 17 sites were significantly different at the 1% or 5% level. However, a thinning effect was not found at other sites; DBH growth was larger in control plots than in thinned plots (light or heavy thinning) at 5 sites of P. koraiensis and 10 sites of L. kaempferi.
Figure 2. DBH increment by species showing thinning effect for 3 years; DBH increment of light or heavy thinning plot was larger than control plot; P and L on the x-axis stand for Pinus densiflora and Larix kaempferi respectively and the number in parenthesis followed by P or K means tree age.
Other factors to affect DBH increment besides thinning
As mentioned above, thinning effects were not shown at 5 sites of P. koraiensis and 10 sites of L. kaempferi. Those sites were classified into two types in general; (1) control > light thinning (), and (2) control ≥ heavy or light thinning (). To identify other factors besides thinning intensity that affect DBH growth, residual basal area, slope gradient, and aspect were compared among the plots. The steeper the slope gradient, the faster the moisture in soil runs out, which has a negative effect on DBH growth. North-east aspects have more moisture than south-west aspects, which has a positive effect on DBH growth (Barnes et al. Citation1998)
Figure 3. DBH increment by thinning intensity for 3 years showing that the increment is greater in control plots than the light thinning plots by species; P and L on the x-axis stand for Pinus densiflora and Larix kaempferi respectively and the number in parenthesis followed by P or K means tree age.
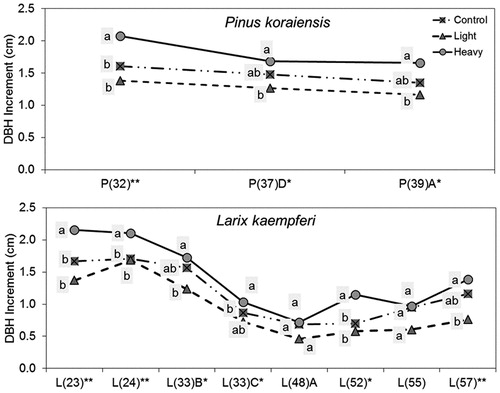
Figure 4. DBH increment by thinning intensity for 3 years showing that the increment is greater in control plots light or heavy thinning plots by species; P and L on the x-axis stand for Pinus densiflora and Larix kaempferi respectively and the number in parenthesis followed by P or K means tree age.
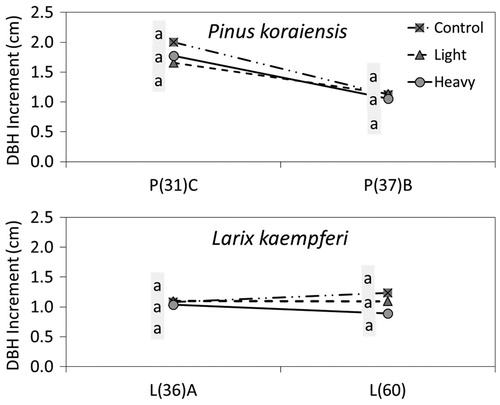
As a result, residual basal area was found to have an effect on DBH increment at two sites of P. koraiensis; DBH increment of the light thinning plots was smaller than that of the control plots in P(37)D and P(39)A, while residual basal area of the light thinning plots was larger than that of the control plots. Also, similar residual basal area resulted in similar DBH increments between the control and the light plots of L(24) and L(33)C sites, and between the light and the heavy plots of P(37)B and L(36)A sites ().
Table 3. Site condition of the sites in which DBH increment was larger in control than in light and heavy thinning.
The reason that DBH growth was greater in the control than in the light or the heavy plots could be explained by slope gradient. That is, the slope gradient of the light thinning plot was steeper than the control plot at one site (P(32)) of P. koraiensis and three sites (L(23), L(52), L(55)) of L. kaempferi. Aspect also was predicted to have an effect on DBH increment at one site (P(32)) of P. koraiensis and one site (L(60)) of L. kaempferi; aspect of the control plot was closer to north than the one of the light or the heavy thinning plots. Meanwhile, the remaining four sites (P(31)C, L(33)B, L(48)A and L(57)) could not be explained by DBH increment with thinning intensity as well as slope, aspect, or residual basal area. In this study, as period of thinning effect was very short, long-term study on thinning effects will provide a more definitive result.
Conclusion
The effects of thinning intensities on growth of diameter at breast height (DBH) were analyzed including other factors besides thinning treatment. Permanent monitoring sites were installed at 26 P. koraiensis plantations and 36 L. kaempferi plantations in 2012 and 2014, respectively. Each site consisted of three square or rectangular plots; (1) control or non-thinned, (2) light thinning, in which 20% of the total basal area was removed and (3) heavy thinning, in which 40% of the total basal area was removed. The main results were as follows.
Overall mean DBH increment for 3 years after thinning was affected by thinning intensity; heavy thinning > light thinning > control. The increment was greater for P. koraiensis than L. kaempferi in thinning plots and control plots. ANOVA showed that there was a significant difference (p < .01) in DBH increment among thinning intensities in both species. Duncan’s multiple range test showed that each thinning treatment was significantly different from the others (α = 0.05).
DBH growth was compared at each site in order to investigate the effect of thinning on DBH growth. In P. koraiensis thinned plots (heavy or light thinning) were found to be larger in DBH growth than control controls at 21 of 26 sites. ANOVA showed that 16 sites were significantly different at the 1% or 5% level. In L. kaempferi, thinned plots (heavy or light thinning) were found to be larger in DBH growth than control plots at 26 of 36 sites. ANOVA showed that 17 sites were significantly different at the 1% or 5% level.
Other factors that affect DBH growth, besides thinning intensity, were identified such as residual basal area, slope gradient, and aspect. Residual basal area was found to have an effect on DBH increment; DBH increment of the light thinning plot was smaller than that of the control plot, while residual basal area of the light thinning plot was bigger than that of the control plot. Similar residual basal area resulted in similar DBH increments between the control and the light-thinning plots at four sites. Slope gradient was found to have an effect on DBH increment; the slope of the light thinning plot was steeper than the control plot at four sites, while DBH increment of the light thinning plot was smaller than that of the control plot. Aspect also was predicted to have an effect on DBH increment at two plots; the closer to north the aspect, the larger the DBH increment was. Meanwhile, results for DBH increment at four sites could not be explained by any factor mentioned above. Therefore, more time may need to pass before an effect of thinning on DBH increment is apparent.
Disclosure statement
No potential conflict of interest was reported by the authors.
Additional information
Funding
References
- Barnes BV, Zak DR, Denton SR, Spurr SH. 1998. Forest ecology. 4th ed. Indianapolis (IN): John Wiley and Sons.
- Cao T, Valsta L, Härkönen S, Saranpää P, Mäkelä A. 2008. Effects of thinning and fertilization on wood properties and economic returns for Norway spruce. For Ecol Manag. 256:1280–1289.
- Cao T, Valsta L, Mäkelä A. 2010. A comparison of carbon assessment methods for optimizing timber production and carbon sequestration in Scots pine stands. For Ecol Manag. 260:1726–1734.
- Choi J, Lee B, Lee D, Choi I. 2014. Growth monitoring of Korean White Pine (Pinus koraiensis) plantation by thinning intensity. J Korean For Soc. 103:422–430.
- Cutter BE, Lowell KE, Dwyer JP. 1991. Thinning effects on diameter growth in black and scarlet oak as shown by tree ring analyses. For Ecol Manag. 43:1–13.
- Daume S, Robertson D. 2000. A heuristic approach to modelling thinnings. Silva Fennica. 34:237–249.
- Ewane EB, Lee JH, Lee HH. 2016. Eight-year monitoring of the height growth and survivorship of seedlings of Pinus thunbergii Parl. planted with sand fence and bush hedge protection in a coastal sandy environment in Korea. For Sci Tech. 12(4):192–198.
- Goff NE, Ontorini JM. 1993. Thinning and climate effects on growth of beech (Fagus sylvatica L.) in experimental stands. For Ecol Manag. 62:1–14.
- Kim DH, Kim JH, Park JH, Ewane EB, Lee DH. 2016a. Correlation between above-ground and below-ground biomass of 13-year-old Pinus densiflora S. et Z. planted in a post-fire area in Samcheok. For Sci Tech. 12(3):115–124.
- Kim HJ, Lee SH. 2017. Estimating carbon storage and CO2 absorption by developing allometric equations for Quercus acuta in South Korea. For Sci Tech. 13(2):55–60.
- Kim M, Lee WK, Kim YS, Lim CH, Song C, Park T, Son Y, Son YM. 2016b. Impact of thinning intensity on the diameter and height growth of Larix kaempferi stands in central Korea. For Sci Tech. 12:77–87.
- Korea Forest Research Institute. 2012a. Commercial tree species 3; Pinus koraiensis. Seoul: Korea Forest Research Institute. (in Korean)
- Korea Forest Research Institute. 2012b. Commercial tree species 4; Larix kaempferi. Seoul: Korea Forest Research Institute. (in Korean)
- Korea Forest Service. 2016. 2016 Statistical yearbook of forestry. Daejeon: Korea Forest Service. (in Korean)
- Lee D, Seo Y, Choi J. 2017. Estimation and validation of stem volume equations for Pinus densiflora, Pinus koraiensis, and Larix kaempferi in South Korea. For Sci Tech. 13(2):77–82.
- Mäkinen H, Isomäki A. 2004a. Thinning intensity and growth of Scots pine stands in Finland. For Ecol Manag. 201:311–325.
- Mäkinen H, Isomäki A. 2004b. Thinning intensity and long-term changes in increment and stem form of Norway spruce trees. For Ecol Manag. 201:295–309.
- Mäkinen H, Isomäki A. 2004c. Thinning intensity and long-term changes in increment and stem form of Scots pine trees. For Ecol Manag. 203:21–34.
- Mechergui T, Boussaidi N, Pardos M. 2017. Short-term effect of early thinning on growth in stone pine in Tunisia. J New Sci. 46:2509–2516.
- Nishizono T, Tanaka K, Hosoda K, Awaya Y, Oishi Y. 2008. Effects of thinning and site productivity on culmination of stand growth: results from long-term monitoring experiments in Japanese cedar (Cryptomeria japonica D. Don) forests in northeastern Japan. J For Res. 13:264–274.
- Pelletier G, Pitt DG. 2008. Silvicultural responses of two spruce plantations to midrotation commercial thinning in New Brunswick. Can J For Res. 38:851–867.
- Pfister O, Wallentin C, Nilsson U, Eco PM. 2007. Effects of wide spacing and thinning strategies on wood quality in Norway spruce (Picea abies) stands in southern Sweden. Sca J For Res. 22:333–343.
- Pretzsch H. 2005. Stand density and growth of Norway spruce (Picea abies (L.) Karst.) and European beech (Fagus sylvatica L.): evidence from long-term experimental plots. Eur J For Res. 124:193–205.
- Smith DM. 1986. The practice of silviculture. 8th ed. New York: John Wiley and Sons Inc.
- Wallentin C, Nilsson U. 2011. Initial effect of thinning on stand gross stem-volume production in a 33-year-old Norway spruce (Picea abies (L.) Karst.) stand in Southern Sweden. Scan J For Res. 26:21–35.
- Zeide B. 2001. Thinning and growth: a full turnaround. J For Res. 99:20–25.
- Zeide B. 2004. Optimal stand density: a solution. Can J For Res. 34:846–854.
- Zhang S, Burkhart HE, Amateis RL. 1997. The influence of thinning on tree height and diameter relationships in loblolly pine plantations. Southern J Appl For. 21:199–205.