
ABSTRACT
Choice decisions are inherently subjective but capturing and explaining nuanced variation in respondents’ attitudes is difficult and needs more than the simple socio-demographic variables traditionally used in economic research. In recent years, environmental economists have been shifting towards a more holistic approach to economic valuation, making an increased use of psychology within behavioural economics, to better understand subjective preferences on the environment. This research applies a novel mixed-methods approach to integrate the results from a Q-methodological analysis, which reveals respondents’ latent traits and perceptions about river management, into a choice experiment which estimates respondents’ preferences for potential future improvements to river water quality. The purpose is to improve the quantification of subjectivity within stated preference experiments. Q-methodology reveals five statistically distinct narratives (characterised as Ecological, Financial, Leadership, Collaboration, Legislation) which define the main perspectives respondents hold for river management strategies. Choice experiment results suggest subjectivity causes significant differences in respondents’ choice behaviour. Statistically verified Q-methodological narratives provide plausible explanations for differences in respondents’ choice preferences regarding river water quality improvements. By triangulating between quantitative and qualitative research methods, we demonstrate a research strategy that can contribute to a better understanding of the impact socially contested perspectives have on respondents’ choice behaviour.
1. Introduction
Increasingly economic analysis is adopting subjective behaviouralist principles to better understand and incorporate respondents’ attitudes and behaviours to provide a solid basis for gaining the public’s trust, legitimise environmental policies and formulate effective community-driven environmental management strategies.
Policymakers tend to distrust the unquantified. To be effective within policymaking, qualitative research has to be practical, well founded methodologically and supported by persuasive empirical investigation and logical argument. We use Q-methodology (Q) to systematically capture respondents’ subjective preferences. Q scientifically structures respondents’ subjectivity and allows the quantification of highly qualitative data, to help bridge the divide between qualitative and quantitative approaches to policy research.
Q is typically used to reveal respondents’ perceptions and helps us to better understand highly complex and socially contested issues. It enables insights into the range of opinions that exist about a topic, and how those opinions differ or converge. Q is increasingly being used to inform the environmental policy and management communities on a range of sustainability discourses (Barry and Proops Citation1999), or to better understand stakeholder narratives relating to the management of large rivers (Ching and Mukherjee Citation2015). Q is particularly suited to enabling wider public participation in environmental decision-making as it succinctly provides quantified results that can be incorporated into planning decisions or subsequent mixed-methods research. Kerr and Swaffield (Citation2007), Armatas, Venn, and Watson (Citation2014) and Kejser Jensen (Citation2019) have used the results from Q-methodology studies to help guide attribute selection and experimental design within subsequent stated preference choice experiments.
Among economic valuation techniques, stated preference choice experiments (CE) are extensively used for valuing the non-market benefits arising from environmental improvements. Choice decisions are inherently subjective but capturing and explaining nuanced variation in respondents’ subjective preferences is difficult and often requires more than simple socio-demographic variables (Boxall and Adamowicz Citation2002).
Accounting for subjective preference heterogeneity may be considered a wicked problem (Rittel and Webber Citation1973), even so, environmental economists have sought to incorporate qualitative attitudinal responses into CEs with some success. Combined factor or cluster analysis results of Likert-scale questions for subjective values, or New Ecological Paradigm data, have been incorporated into the assessment of respondents’ willingness to pay (WTP) to better reflect how attitudinal questions about respondents’ perceptions impact economic values (e.g. Cooper, Poe, and Bateman Citation2004; Aldrich et al. Citation2007; Hunter et al. Citation2012).
The two main limitations of Likert-scale approaches are: firstly, the statistical analysis disaggregates respondents’ subjectivity into a series of constituent themes and disregards the gestalt nature of the interconnected facets of respondents’ perceptions. Secondly, Likert data structure constrains respondents’ attitudes by replacing the respondents’ meaning with that of the external a priori deductive frame of reference imposed by the researcher.
A key strength of Q is that it seeks to reveal, via quantitative means, the subjectivist views inherent within social research. Dryzek and Berejikian (Citation1993) tell us it is ‘explicit, constrained by statistical results, and replicable in its reconstructions and measurement of subjects’ orientations, thus affording less interpretative latitude to the analyst’. This combination of numerical analysis and qualitative interpretation increases the level of research reliability and validity (Furlong, Lovelace, and Lovelace Citation2000) and enables the method to bridge the divide between traditional (positivist) and post-positivist approaches to policy research (Sell and Brown Citation1984). We argue that using a novel mixed-methods approach to integrate the results from a Q-methodological analysis (of respondents’ subjective preferences for river management) as explanatory variables within a CE (which assesses those respondents’ preferences for improvements to different attributes of river water quality) enhances valuation results by overcoming the limitations of Likert-scale approaches: firstly, by ensuring that respondents’ intrinsic subjective self-reference is holistically preserved and, secondly, by attributing meaning to respondents’ shared perspectives a posteriori through abductive interpretation and description of the Q statistical summary.
When dealing with complex subjects, such as environmental questions, it is necessary to shift from mono-disciplinary to interdisciplinary and transdisciplinary concepts and methods (Lawrence Citation2010). Mixed-methods triangulation enables the supportive corroboration of competing quantitative and qualitative paradigms (Marsh Citation1982). We believe the experimental design described within this paper can help unpick complex subjective values and reveal unique variance which may otherwise be neglected by a single experimental method (Jick Citation1979).
The main objectives of this paper are to:
Present the results of a Q-methodology analysis which reveals and characterises the main perspectives held by respondents on the complex issues surrounding river water quality, pollution mitigation strategies, recreational use, natural capital, and environmental management.
Assess whether there are convergent or divergent perspectives held by different stakeholder types (e.g. water quality and river management experts, the general public, river visitors, non-visitors, recreational users), and,
Integrate a qualitative psychological methodology (Q) with a quantitative economic choice experiment (CE) to improve our understanding of the role subjectivity has in shaping respondents’ choice behaviour. This third objective explores the complementarity of the two (ostensibly disparate) methods and examines the extent to which results from the CE can be clarified, amplified or triangulated by the Q results.
Methodological procedures are described in the next section. The results of the Q analyses are then presented, as is a conditional logit (CL) model which integrates Q and CE data. The discussion explores the implications of our work which represents, to the best of our knowledge, the first attempt to holistically integrate respondents’ subjectivity, defined by Q factor associations, as explanatory variables within a stated preference CE.
2. Material and methods
2.1.1. Case study area and catchment information
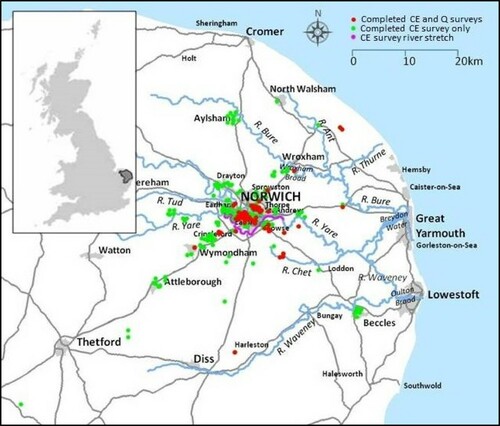
The Broadland Rivers Catchment (BRC), within East Anglia (UK), was selected as the case study area for several reasons; (i) it contains the Broads which provide unique ecosystems and habitats that attract high levels of tourism causing problems for ecosystem health; (ii) the BRC is predominantly rural and is prone to diffuse nutrient pollution (Natural England Citation2016); (iii) the BRC has difficulties meeting water quality targets due to point sources of pollution from the water industry (Environment Agency Citation2015). A sample of 200 respondents was selected in the area and a subset of the full sample completed a CE and a Q-sort and this subsample is analysed here. shows the locations of respondents’ homes and the 20 km stretch of the River Yare, the survey river used within the CE.
Figure 1. Survey area and location of respondents’ home.
2.1.2. Survey design and interview structure
Best practice for CE and Q-methodology experimental design, data collection and analysis was followed (e.g. Johnston et al. Citation2017; Watts and Stenner Citation2012; Brown Citation1980). To prevent ordering effects and informational bias (Bailar, Bailey, and Stevens Citation1977; Day et al. Citation2012), a single interviewer followed a set script to collect trip, CE, Q and socio-demographic data. Participants’ explanations for their unique Q sort configurations were also recorded and later used to help characterise factor narratives.
2.1.3. Respondent selection and sample size
Although stable Q factors can be identified using relatively few respondents, we interviewed 62 respondents for two reasons: firstly, to maximise our confidence that all significant Q factors were revealed, and, secondly, because larger numbers of respondents are required for estimating CE responses. The CE sample is supported by a well-informed experimental design and results are compared with a wider sample of CE respondents as reported in Hampson et al. (Citation2017).
We sampled 14 people with a professional interest in river water quality management (e.g. Natural England and the Environment Agency). We hypothesised that such respondents, as ‘representatives of reason’ (McKeown and Thomas Citation1988), may share similar psychological strategies and, consequently, load similarly onto Q factors. Expert participants were expected to be very familiar with local rivers, with a tendency to be knowledgeable, high frequency visitors.
Central to this research was a desire to capture the perspectives of ‘hard to reach’ respondents, so that their views may be considered within environmental decision-making. Thirty-one respondents from the general public, with a range of socio-demographic characteristics, were interviewed to explore the hypotheses that people from different economic, educational and cultural backgrounds have different preferences on how rivers should be managed. It was expected that these respondents would primarily be a mix of casual- or non- river visitors.
We also sampled 17 river-based recreation club members, who frequently participate in a range of river-based recreational activities (i.e. swimming and rowing) and have high levels of contact with river water.
2.2. Q-methodology experiment
Q methodology, proposed by William Stephenson (Citation1935), is a research approach used in psychology and social sciences to investigate and structure the subjective view of respondents. It is structured in few main steps but from the respondents’ point of view has been likened to a game of cards (Maki Sy et al. Citation2018).Footnote1 Here the focus is on the technical procedure adopted.
2.2.1. Concourse construction and statement set size
To minimise bias, and maintain impartiality and representativeness, we used Dayton’s (Citation2000) framework to organise and condense statements around five themes to sample the universe of opinion on river water quality management (). Statements used are shown in .
Table 1. Matrix of themes and statement typology.
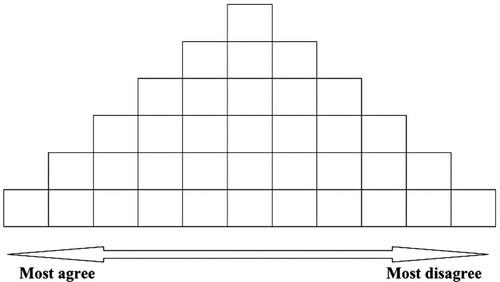
In total 36 statements were used to capture respondents’ subjective preferences, which we considered adequate to minimise biases and response fatigue. Respondents had to place the 36 statements on to a sorting grid (of quasi-normal distribution), , presented as a continuum from ‘most agree’ to ‘most disagree’.
Figure 2. Sorting grid configuration.
2.2.2. Q data analysis
The Q-data were analysed with centroid factor analysis to identify the significant factors.Footnote2 Factors with eigenvalues greater than 1.00 were considered significant, and only extracted if at least two Q-sorts (‘factor exemplars’) significantly associated with them. Following factor extraction, the data were rotated using varimax rotation to maximise explained variance. Given that a factor array estimate is a composite Q-sort for a factor, i.e. an idealised weighted average of contributing Q-sorts, we flag all sorts which are significantly associated with a factor (but not confounded with another factor) to create the estimate for that factor array.
The factor analysis was carried out in two stages. In the first stage, the data collected from the four categories of respondents (shown in ) were analysed separately, resulting in four sets of factorial analysis results. The output from these four analyses, expressed as idealised factor arrays, were then used as input data for a second-order meta-analysis. This technique enables the distinctive differences between the viewpoints of different respondent types to emerge, rather than be ‘lost’ within the aggregated data set (Parkhill et al. Citation2010). It also enables the researcher to assess the distribution of a viewpoint across respondent types (Simmons and Walker Citation1999), or ascertain if the structure of the various factor arrays changes significantly between analyses (Niemeyer, Petts, and Hobson Citation2005). The interpretation of results was carried out using the crib sheet interpretive strategy, as crib sheets facilitate an abductive system of consistently organising interpretation to help the researcher holistically understand each factor (please see Chapter 7 of Watts and Stenner (Citation2012) for detailed guidance).
Table 2. Summary statistics of full sample and respondents’ groups.
2.3. Choice experiment
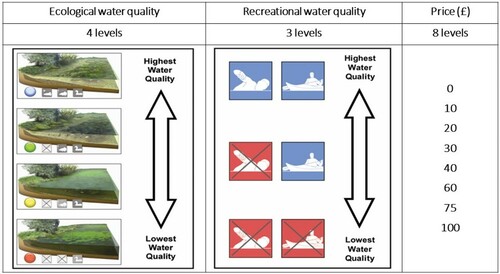
CE responses were collected with choice cards where respondents had to trade-off recreational quality, water ecological quality and increased water bill cost levels (levels shown in ). Choice responses were modelled with a standard conditional logit model (CL) and the observed heterogeneity was modelled as the interaction of subjective characteristics (i.e. respondents’ associations with the second-order Q-factor exemplars) with CE attributes.Footnote3 The specification of discrete choice data is intentionally kept simple to fully appreciate the role that Q responses have in explaining respondents’ preferences.
Figure 3. CE attributes and levels.
Please see the open-access paper by Hampson et al. (Citation2017), which provides full details of the CE design and modelling strategies. The full sample of CE results reveal significant heterogeneity in respondents’ water quality preferences: a majority prefer ecological improvements, a substantial minority prefer recreational improvements and a small proportion hold relatively low values for either form of river quality enhancement. Anglers prioritise ecological quality, swimmers and rowers favour improved recreational opportunities. A clear distance decay in benefit values, the further respondents’ lived from the site of the proposed investment, was revealed. Within the present study, we focus solely on the effect respondents’ subjective preferences for river water quality management have on their choice behaviour.
3. Results
The data collection led to the definition of four categories of river users. Summary socio-economic statistics for these categories are provided in .
There is considerable heterogeneity in respondents’ socio-economic characteristics across categories. Mean age is relatively low for Recreational users. Mean income and educational attainment are relatively low for Recreational and Non-/low use respondents. Experts have relatively high educational attainment, employment levels and mean incomes. Seventy-one per cent of Recreational users and Experts are members of environmental organisations (a variable typically used within CEs as a surrogate to measure respondents’ ‘concern’ for the environment), compared with 12% of Non-/low users who either do not visit, or who only visit rivers one or two times per year. Occasional users, typically older and relatively well educated, visited on average 32 times over the year prior to the survey. Experts and Recreational users are high-frequency visitors.
3.1. Q results
Summary results of the first-order Q-analyses on the four categories of river users are provided in .
Table 3. Results of first order analyses.
Thirteen factor arrays comprised 45 defining sorts. We hypothesised that Expert respondents may share similar psychological strategies. This was not the case. Results suggest greater diversity of opinion, relative to other respondent types, as the Expert analysis was the only one to reveal four factors (). The Expert analysis also contained the fewest confounded and insignificant sorts, which suggests that Experts hold distinct, well-formed (although divergent) opinions on river management.
The 13 factor arrays extracted from the first-order analyses () were subsequently entered into a meta-analysis () to provide a better understanding of the commonalities between those arrays. All of the 13 arrays became significantly associated with one of five statistically distinct factors.Footnote4 All factors have eigenvalues >1.0 and contain at least two defining arrays.
Table 4. Meta-analysis factor array composition.
reports heterogeneous summary characteristics for respondents within the meta-analysis. Respondents were generally pessimistic on the likelihood of river water quality improvements being made in the future. The majority felt that improvements were ‘somewhat unlikely’ or ‘very unlikely’. Factor 1 captures the most pessimistic respondents and Factor 5 the most positive respondents.
Table 5. Summary statistics for meta-analysis respondents.
3.1.1. Q narratives
Q-sort values (), summary statistics (), crib sheets, distinguishing and consensus statements () and interview notes were used to compose narratives for meta-analysis factor exemplars, which are summarised in (key word in bold) and described more fully below (Statement numbers and Q-sort values in brackets). We also corroborate our interpretations of the Q statistical summary by using additional evidence drawn from our primary data set (i.e. summary socio-economic statistics and information on respondents’ river trip characteristics).
Table 6. Factor Q-sort values for each statement within the meta-analysis.
Table 7. Q Narrative summaries.
3.1.2. Factor 1: Ethical and ecological concerns are paramount
Factor 1, composed of 5 Occasional users and 3 Experts, accounts for 15% of the variance within the meta-analysis and has an eigenvalue of 1.95. These respondents tend to be relatively prosperous older males, with high educational attainment. All visited rivers in the year prior to the survey and, on average, visited 76 (s.d. 82) times. 75% felt that it is ‘somewhat unlikely’ or ‘very unlikely’ that river water quality improvements would be made in the future.
Factor 1 respondents feel strongly about ecosystem conservation and ethical issues. River water quality is very important to these respondents (18; +4, ranked highest on this factor). They feel that clean rivers are assets (28; +5, ranked highly significantly (p < 0.01) higher, on this factor) which provide habitats in which species can flourish within unpolluted ecosystems: all species, no matter how insignificant, should be protected from pollution (7; +3, 29; −5). The aquatic environment should be respected as valuable in itself, and not just to be used for economic profit (30; +3). River water should not be harmful to human health (21; +4, ranked highest on this factor) and should be clean enough so that rivers can be used for recreation (34; +2). There is a high level of inter-generational concern: rivers should be protected for future generations to enjoy (10; +3, ranked joint highest on this factor).
The emphasis is on pollution prevention and environmental protection before pollution occurs. These respondents feel that river water quality is a very serious problem (19; +2) as not enough is being done to protect and improve riverine environments (20; −4). Legislation should be improved (15; +2). Humans should not pollute rivers (6; +1) and should conserve the environment (8; −4) ahead of financial goals or profits (23; +2, ranked highest on this factor, 16; −3).
3.1.3. Factor 2: Financial controls on major polluters to reduce pollution
Factor 2 is composed of 5 Low/non-users, 2 Occasional visitors and 6 Recreational users. The factor has an eigenvalue of 2.08 and explains 16% of the meta-analysis variance. These respondents tend to have the lowest educational attainment, lowest mean incomes, fewest environmental memberships and visit rivers relatively infrequently.
Factor 2 respondents hold a deep concern for the wellbeing of the ecological environment (30; +2, 19; +4, ranked highest on this factor). They are emphatic that flora and fauna need protection from pollution (7; +5, ranked significantly higher (p<0.05) than other respondents, 29; −5). They see ecosystem conservation as a priority (16; −4), both now and into the future (10; +3, ranked joint highest). They do not believe that enough is being done to either reduce river pollution (2; +2), or protect and enhance the environment (20; −3). These respondents distrust the water authorities (11; −2) and feel poorly informed by those authorities on issues relating to river pollution (12; −4, ranked joint lowest on this factor).
There is a sense that these respondents disassociate themselves from their personal liability for the costs of pollution remediation, as they are unwilling, or unable, to contribute to remediation via higher food prices (13; −2, ranked lowest on this factor) or through higher water bills (32; −1). This may be because river water quality is not personally important to them (18; −1, ranked lowest on this factor), or because low mean incomes are a financial constraint.
Instead, there is an emphasis on the use of financial instruments to control pollution from other polluters (14; +3). Controls on agriculture (8; −3), and financial penalties on polluting water companies (25; +3), are seen as methods by which remediation could be achieved. Pollution reduction strategies implemented by polluters should not be financially incentivised (1; −3, ranked joint lowest on this factor) as polluters should be aware of the needs of society and the environment (22; +4, ranked higher on this factor) and should not pollute rivers (6; +2, ranked higher on this factor). Despite approving of financial controls, these respondents strongly disagree with increased legislative controls (15; −1, ranked highly significantly (p < 0.01) lower on this factor).
3.1.4. Factor 3: Hierarchical government-driven leadership to protect river ecology
Factor 3 is defined by 5 Low/non-users, 2 Occasional users and 3 Experts. The factor has an eigenvalue of 1.82 and explains 14% of meta-analysis variance. 60% of respondents are female and 70% have a graduate education. 80% are employed and mean incomes are relatively high.
Leadership is important to these respondents. The idea that ‘strong effective leaders are needed to help reduce river pollution’ (5; +4), is ranked highly significantly (p < 0.01) higher on this factor. Additionally, the +5/−5 ranked statements (25; +5, ranked highest on this factor 8; −5, ranked lowest on this factor) call for government intervention to either penalise water companies that pollute, or regulate the actions of the agricultural sector. Appropriate technological solutions (24; +2, 17; +2, ranked highest on this factor) should be used to reduce pollution.
They support increased legislation (15; +3) to protect rivers and prefer that species conservation (7; +2, 29; −4) is prioritised over profit-taking (16; −4). Polluters should see beyond their own interests (22; +3, 30; +3) and should pay for pollution remediation (14; +4, ranked joint highest on this factor).
Perhaps due to the absence of recreational visitors loading onto this factor, the idea that ‘river water should not be harmful to human health’ (21; −2) is significantly (p < 0.05) less important to these respondents. Indeed, river water quality for human recreational use is unimportant to these respondents; for their own use (9; −3, ranked joint lowest on this factor), for others to use (34; −1, ranked joint lowest on this factor), or for future generations to enjoy (10; 0, ranked joint lowest on this factor).
3.1.5. Factor 4: Pragmatic use of the environment and collaboration between polluters
Factor 4 is composed of 2 Low/non-users, 4 Recreational users and 3 Experts. The factor has an eigenvalue of 1.95 and explains 15% of the variance within the meta-analysis.
Key to this factor are ideas of collaboration to reduce pollution: all should take part (36; +5, ranked highly significantly (p < 0.01) higher on this factor) and work together (2; +2, 4; +1, ranked joint highest on this factor). Polluters should seek out local knowledge for solutions to local pollution problems (35 + 1; ranked joint highest on this factor). Conversely, these respondents do not believe that strong leaders are necessary (5; −3, ranked significantly (p < 0.05) lower on this factor). It may be that these respondents favour collaboration over leadership because they feel less informed (12; −4, ranked joint lowest on this factor) and they distrust river authorities (11; −3, ranked joint lowest on this factor).
Within this factor, we see a cautious pragmatism towards the environment (30; −2, ranked highly significantly (p < 0.01) lower on this factor). Human actions may be allowed to pollute rivers (6; −1, ranked joint lowest on this factor) and some species loss is acceptable (29; −1, ranked highly significantly (p < 0.01) higher on this factor), as rivers are tangible economic resources to be used (28; +3, 10; 0, ranked joint lowest on this factor). Although polluters can be self-interested (22; 0, ranked lowest on this factor), they must be responsible (23; −2, 16; −3) and pay to remedy excess pollution (14; +4, ranked joint highest on this factor) as they believe water quality problems are a serious issue (19; +4, ranked joint highest on this factor) and do not believe that enough is currently being done to improve the quality of our rivers (20; −5, ranked lowest on this factor). They prefer that pollution reduction should be carried out if evidence shows that it is needed (33; +3, ranked highest on this factor). These respondents would be willing to pay more on their water bills to ensure improvements happened (32; +1, ranked highest on this factor). Although they support regulation for agriculture (8; −4) and financial penalties for water companies if pollution persists (25; +3), they are open to financial incentives for polluters to make their practices more environmentally friendly (1; +1, ranked highly significantly (p < 0.01) higher on this factor).
3.1.6. Factor 5: Pollution control via legislation and monitoring
Factor 5 has an eigenvalue of 1.30 and explains 10% of the meta-analysis variance. It contains three Experts and two Recreational users, who tend to be younger, have higher levels of education and employment, higher incomes, the most memberships to environmental organisations and by far the highest number of river trips taken in the year prior to the study. They are the most optimistic about future river water quality: 60% believe that water quality improvements are ‘somewhat likely’ or ‘very likely.’
Legislation (15; +5, ranked highest on this factor), backed by accurate data (24; +4, ranked significantly higher (p < 0.05) on this factor) is the preferred method of controlling pollution, where necessary. They distrust the authorities more than most other respondents (11; −3, ranked joint lowest on this factor), and feel most strongly that more effort should be made to inform the public on water quality issues (31; +1, ranked highest on this factor).
Although these respondents respect natural things (30; +4, ranked highest on this factor) and favour ecosystem and species conservation (29; −5), they do not believe river water quality problems are a serious issue (19; 0). They are less likely to reject the idea that enough is being done to protect rivers (20; −1, ranked highest on this factor) and less likely to feel that animals and plants need protection from pollution (7; 0, ranked lowest on this factor).
They believe that some river pollution is acceptable (6;−1) and, whilst they feel major polluters should do more to control pollution (2; +3, ranked highest on this factor), they reject the idea that it is wrong for polluters to profit while pollution still occurs (23; −3, ranked lowest on this factor).
Relative to other respondents, these respondents are less willing to pay more on their water bills to improve water quality (32; −2, ranked lowest on this factor) or see poorly performing water companies financially penalised (25; 0, ranked joint lowest on this factor). Conversely, they are more willing to pay higher food prices to support farmers’ pollution reduction efforts (13; +2, ranked highest on this factor). These respondents are generally supportive of farmers (8; −2, ranked highest on this factor) and are less willing to see farmers penalised for livestock pollution (3; −2, ranked lowest on this factor).
3.1.7. Correlations between factors
The factor arrays within the meta-analysis are significantly inter-correlated (>0.43) (), even though the factors themselves are orthogonal. Correlation between factor arrays is not uncommon within Q-research (Brown and Kim Citation1981; Walder and Kantelhardt Citation2018). We find shared principles (e.g. the environment should be protected) across factors, with nuanced differences within the structure of factor arrays revealing subjective preferences.
Table 8. Correlations between factors scores in the meta-analysis.
In addition to interpreting statements within the context of the individual factor array in which they are embedded, we also consider consensus statements in their own right as they can be indicative of shared principles across factors (see ).
Most notably, respondents reject the idea that conservation should only be considered once the polluter has met their financial (Statement 16) or food production goals (Statement 27), indicative of a shared preference for conservation to be incorporated within decision-making. Respondents generally feel poorly informed about river water quality (Statement 12) and appear non-committal about receiving additional information (Statement 31) which they tend to mistrust (Statement 11). This distrust may help explain their apathy for contributing more to river improvements (Statement 32) and the general disbelief that future river improvements would happen ().
3.2. Econometric modelling results
3.2.1. Conditional logit model of Q respondents’ water quality preferences
We report a parsimonious CL model to describe respondents’ water quality preferences (). Results show significant heterogeneity across respondents’ choice behaviour and those differences may be attributed to the subjective viewpoints held by respondents. Socio-economic summary statistics and insights gained from the narratives generated from the Q statistical summary provide plausible explanations for respondents’ choice behaviour.
Table 9. CL model of Q respondents’ water quality preferences.
The model in describes the preferences of respondents where the base category is Factor 3. Any of the factors could have been designated as the baseline as there is no ordinal ranking across Q factors. Using Factor 3 as the baseline enabled the significant differences between different respondent groups’ choice behaviour to be more readily distinguished. Another respondent characteristic is their recreational use, therefore a dummy for those who are recreational users of the River Yare as their primary location to row or swim is also included.Footnote5Consistent with Hampson et al. (Citation2017) water quality is labelled as ‘Poor’ if ecological quality was Red, ‘Medium’ if levels were ‘Yellow’ (Fair) or ‘Green’ (Good), and ‘High’ otherwise.
The sign and strength of the coefficients reasonably describe the preferences for water quality held by Factor 3 respondents. The negative coefficient for Price, −0.061*** (s.e. 0.016), reveals that these respondents are less likely to choose options containing higher prices ceteris paribus. Of the five respondent groups, Factor 3 respondents are the least likely to choose options which contain higher Price. In line with previous research (Hampson et al. Citation2017), the strength of the coefficients describing preferences for ecological and recreational water quality relative to one another suggest that, on average, these respondents value improvements in ecological quality more than improvements in recreational water quality. The Q narrative provides plausible reasons for this: Factor 3 respondents rejected paying higher food prices or more on their water bills (13; −1, 32; −1, both ranked second lowest on this factor) for river improvements. This is despite these respondents having above average incomes (). The narrative also suggests a range of issues which are of lower importance to these respondents. The idea that river water should not be harmful to human health (21; −2) is significantly (p < 0.01) less important to these respondents. River water quality for human recreational use is unimportant to these respondents (9; −3, ranked joint lowest on this factor, 34; −1, ranked joint lowest on this factor, 10; 0, ranked joint lowest on this factor). Given this ambivalence towards human use, it is unsurprising that no recreational users loaded on to this factor and respondents on this factor are people who tend not to visit, or who visit infrequently.
Factor 3 respondents’ preferences for ecological water quality are complete and transitive. They choose options with High ecological quality, 6.177*** (s.e. 1.263), rather than Medium ecological quality, 4.203*** (s.e. 0.811), which, in turn, is preferred to Low ecological quality (the baseline ecological water quality attribute). Although Factor 3 respondents hold positive preferences for improved levels of recreational water quality, they prefer to choose options with Medium recreational quality, 2.086*** (s.e. 0.804), rather than High recreational quality, 1.697*** (s.e. 0.615). This mirrors the above observations on human use, i.e. they have no use for High recreational quality. A simple CL model of all respondents, without accounting for psychological factors, provides consistent results, with Medium recreational quality less preferred than High recreational quality. It seems that, within the model described in , the variation for recreational water quality has shifted into the coefficient which describes River Yare recreational users’ preference for High recreational water quality (1.976***, s.e. 0.689).
The most striking feature of the model, particularly given the small sample size, is the impact of respondents’ subjectivity on the attribute Price. The groups present a wide variation of preferences for Price that is less negative than that of Factor 3 respondents.
Factor 1 respondents seem to prefer options when the price increases, that is, the slope of their overall coefficient for Price becomes positive (−0.061 + 0.080 = 0.019), which we would reject following standard economic interpretation. On the contrary, Factor 1 respondents’ Q narrative reveals that these respondents put their emphasis on ecological water quality and ethical issues. They rank paying more on their water bills for water quality improvements (32; 0) second highest (to Factor 4) and rank paying higher food prices (13; 1) second highest (to Factor 5). They have a high level of intergenerational concern (10; +3, ranked joint highest on this factor). Given these attitudes, their high levels of education and relatively high mean incomes, we might speculate that the price attribute may not be sufficiently high to deter these respondents from ignoring Price in favour of the ecological or recreational quality attributes. An alternative explanation may be that these respondents are protesting. shows that 75% of respondents on Factor 1 (the highest proportion within the five respondent groups) were generally pessimistic about the likelihood of water quality improvements being made in the future. Given this, their decisions with the CE may have been protest responses against the constructed market scenario.
Despite having the lowest mean incomes, Factor 2 respondents are less sensitive to Price compared with Factor 3 respondents (−0.061−0.032 = −0.029). This may be conditioned by their support for the protection of all flora and fauna from pollution (7: +5, ranked significantly higher, p < 0.01, on this factor, 29; −5). They also feel that pollution is a very serious issue (19; +4, ranked joint highest on this factor) and ecosystem conservation is a priority for them (16; −4), both now and in the future (10; +3, ranked joint highest on this factor). Respondents loading onto Factor 2 are significantly less likely (−1.614*, s.e. 0.894) to choose options containing Medium recreational quality. The socio-economic statistics help explain their preference as the majority of respondents on Factor 2 do not regularly visit rivers. The factor contains 5 Low/non-users and 2 Occasional users (), who took the lowest mean number of trips, 23 (s.d. 54), in the year prior to the study (). The factor also has the lowest proportion of respondents who are members of environmental organisations (38%).
Respondents on Factor 4 are significantly less likely to choose options containing either Medium ecological quality (−2.602***, s.e. 0.874) or High ecological quality (−3.351**, s.e. 1.356). Within the Factor 4 narrative, we see a pragmatic approach towards the environment which may be the reason they are less likely to choose improved levels of ecological water quality. The statement ‘Natural things should be respected for themselves and not just for what humans can get out of them’ (30; −2) is ranked significantly lower on this factor. Indeed, they are somewhat utilitarian in their view; rivers are assets to be used as a tangible economic resource (28; +3). Furthermore, they disregard the inter-generational transfer of clean rivers relative to other respondents (10; 0, ranked joint lowest on this factor).
Despite Factor 4 respondents holding a utilitarian view of the environment, they have a significantly higher willingness to choose options containing higher Price (0.055***, s.e. 0.017). Within their Q narrative, Factor 4 respondents are more willing to pay additional sums on their water bills for water quality improvements than other respondents (32; +1, ranked highest on this factor), and, despite their pragmatism, they believe that rivers should be clean enough to protect both humans and nature (21; +2, 7; +2). They prefer that pollution reduction should be carried out if there is evidence that it is needed (33; +3, ranked highest on this factor) and strongly believe polluters should pay for water quality improvements (14; +4, ranked joint highest on this factor). It appears that their choice behaviour may, in part, be motivated by a desire to cooperate in pollution remediation efforts (e.g. ‘all should take part’) (36; +5, ranked highly significantly (p < 0.01) higher on this factor) and ‘work with each other’ (4; +1, ranked highest on this factor).
Factor 5 contains only Recreational users and Experts (). These respondents have the highest mean incomes, the highest proportion who hold environmental organisation memberships and the highest trip frequency by far (). These characteristics may explain their significantly higher willingness to choose options containing increased Price (0.036*, s.e. 0.020). Factor 5 respondents are significantly less likely to choose options containing Medium ecological quality (−1.645*, s.e. 0.997). The narratives show that Factor 5 respondents, relative to respondents on other factors, are less likely to believe that river water quality problems are a serious issue (19; 0). Consequently, they are less likely than other respondents to feel that animals and plants need protection from pollution (7; 0, ranked lowest on this factor).
4. Discussion
Q methodology offers an effective pattern analytic for explaining diversities of socio-cultural viewpoints and understandings. Such representations are not unique to the individual, as viewpoints cluster together into a limited number of factors which are generalisations of attitudes held by respondents. The Q-factors which emerge permit direct comparisons of differing attitudes; irrespective of the number, or type, of people who subscribe to them (McKeown and Thomas Citation1988).
Using Q to reveal respondents’ viewpoints on the importance of different issues regarding the riverine environment has proved to be a useful tool, as public perceptions of the complex issues surrounding natural capital and its management are frequently overlooked. Within our Q research, we find five significantly different viewpoints.
Factor 1 describes a viewpoint shared between respondents who are primarily concerned with the ethical issues surrounding the ecological and recreational quality of the riverine environment. This factor is similar in its scope to the ideology of intrinsic value, advocating an holistic approach to nature and conserving biodiversity for its own sake (Turner et al. Citation2003; Robinson Citation2011). Factors 4 and 5 reveal pragmatic attitudes, shared by a range of respondents, towards market-led river use. Similar pragmatism, which combines intrinsic and instrumental values for nature, has been reported by Sandbrook et al. (Citation2010). Our interpretation of the statistical summary also reveals heterogeneous preferences for inter-institutional working structures (hierarchical government-led vs. collaborative networks) or regulatory frameworks (financial vs. legislative inducements).
Beyond the different emphases on specific aspects of the river management discourse, results also show that the five viewpoints exhibit common themes across respondents, e.g. the majority of respondents typically feel poorly informed about the subject of river water quality and share a distrust for the water authorities. The management community may wish to reflect on how their information dissemination and communication strategies may be adjusted to improve both the public’s trust and the public’s understanding of water quality and river management issues.
If we want to better understand the latent psychological motivations underpinning respondents’ choice behaviour, we need to develop new means by which such motivations can be classified and quantified. The mixed model approach presented here captures preference heterogeneity expressed as the latent psychological traits of respondents. Other advanced modelling strategies, such as mixed logit and latent class (LC) analysis, capture preference heterogeneity but the explicit link to respondents’ psychological traits is missed.Footnote6 Furthermore, such mixed logit model specifications require samples larger than presently available. Therefore, as the objectives of this paper were to better understand the subjectivity underpinning psychological traits for water quality and to test a mixed model which integrated highly subjective psychological data into discrete choice analysis, the conditional logit model with interaction term appears to be the golden standard. We believe that the approach presented here provides insights on how qualitative and quantitative data can be jointly modeled, without facing the econometric difficulties of specifying a mixed logit model (Cherchi and de Dios Ortúzar Citation2008).
The most striking feature of our econometric analysis, particularly given the small sample, is the influence subjectivity has on respondents’ sensitivity to the attribute Price. All respondents who load onto different Q factors, differ significantly from Factor 3 respondents in their willingness to choose options with higher prices. Subjectivity can also significantly influence respondents’ preferences for water quality attributes and attribute levels.
A small sample size is suitable within a Q-methodology experiment to capture the range of viewpoints on the issue under investigation. However, the small sample of Q respondents limits the number of appropriate discrete choice models to test and the CL model () remains the golden standard. Naturally, to capture wider sources of heterogeneity and relax some of the assumptions of the CL model, increased sample size of respondents who concurrently undertake the Q and choice experiments is required. This remedy may incur increased time and cost restraints for data collection, due to the complexity of the survey design.
Recreational users and water quality experts were deliberately oversampled, in order to test the theory that such respondents may hold subjective preferences distinct from those held by the general public. Because such respondents may have specific interests in water quality improvements, we should expect mean willingness to pay (WTP) values to be inflated and, consequently, to be unrepresentative of WTP values held more widely within society. For these reasons, we do not report WTP values, nor do we make any claim for the transferability of the CL model. To be more representative, a weighted sampling strategy (e.g. one that includes a larger proportion of respondents drawn from the general public) may be used.
Much research has been done on producing transferable CE models. The same cannot be said for Q research, where no research has been conducted into the transferability of Q results within the fields of environmental economics or environmental management. However, Q is particularly suitable for identifying commonality and diversity within respondents’ viewpoints on a topic: providing the sample of opinions is representative, it is possible that the resultant opinions may generalise to other similar populations (Brown Citation1980).
Within this research we partition our sample and perform a meta-analysis on the results obtained from each of the subsamples. The meta-analysis produced significant inter-subsample correlations. Therefore, we can be reasonably confident that should the experiment be replicated with a new sample of respondents we would find that those new respondents should themselves produce factors which would correlate with the factor arrays obtained within the original meta-analysis.
5. Conclusions
Public perceptions of the complex issues surrounding natural capital are frequently overlooked. We believe that the information arising from this Q research will assist environmental policy making. It identifies for policy makers the different ways river water quality issues are perceived and highlights common issues and perspectives held within society. Policies directed towards any such widely shared concerns would be more likely to receive social support and be more effective.
Different communication strategies will have varying degrees of success given the variation in motivations across groups.
By triangulating quantitative and qualitative data, we demonstrate a mixed-methods research strategy which may be used to better understand economic analysis. It may be particularly appropriate in situations where there is an imperative for respondents’ qualitative latent subjective motivations to be holistically included as explanatory variables in quantitative analyses of those respondents’ choice behaviour. Our results suggest subjectivity causes measurable and significant differences in respondents’ choice behaviour regarding river improvements. Moreover, our analysis shows that Q factor narratives can be used to characterise and explain respondents’ choice decisions. This has important implications for stated preferences studies, not least that it enables the researcher to integrate respondents’ subjectivity as complementary evidence alongside respondents’ socio-economic characteristics. This in turn has the potential to strengthen research findings (e.g. provides a means by which respondents’ biases and structures of preference may be more accurately assessed and characterised). We believe that this integration of disparate methodologies shows merit and warrants further investigation.
Acknowledgements
Funding for this research was provided by Anglian Water and the Catchment hydrology, Resources, Economics and Management (ChREAM) project, funded by the joint ESRC, BBSRC and NERC Rural Economy and Land programme [grant number RES-227-25-0024]. One of the authors was supported by the ESRC grant [number ES/F023693/1] for the completion of their PhD. All subjects gave their informed consent for inclusion before they participated in the study. The study was conducted in accordance with the Declaration of Helsinki, and the protocol was approved by the Ethics Committee of University of East Anglia.
Disclosure statement
No potential conflict of interest was reported by the author(s).
Additional information
Funding
Notes
1 For readers less acquainted with Q, we strongly recommend the comprehensive texts by Brown (Citation1980) and Watts and Stenner (Citation2012).
2 PQMethod version 2.35 (Schmolck Citation2014) was used for the factorial analysis, the procedural steps were as in Watts and Stenner (Citation2012, Appendix 2). The algorithms used for centroid extraction are documented in Brown (Citation1980).
3 CL modeling was estimated using Stata 13 (StataCorp Citation2013).
4 Within a varimax rotation, Occasional_2 was confounded between factors 2 and 3. Given that its correlation with Factor 3 (0.764) was very high, and its association with Factor 2 (0.432) only marginally above the critical value of 0.430, rather than reject the sort as confounded, it was prudent to manually rotate factors 2 and 4 by -1o relative to one another to resolve the issue.
5 Other socio-economic variables (e.g. age, income, etc.) were also tested but they were largely insignificant.
6 Hampson et al. (Citation2017) analyze water quality choices using a LC model approach. Although heterogeneity is captured, without incorporating evidence specifically designed to capture and explain subjectivity, that model could not reveal the psychological motivations influencing respondents’ preferences.
References
- Aldrich, G. A., K. M. Grimsrud, J. A. Thacher, and M. J. Kotchen. 2007. “Relating Environmental Attitudes and Contingent Values: How Robust Are Methods for Identifying Preference Heterogeneity?” Environmental and Resource Economics 37 (4): 757–775. doi:https://doi.org/10.1007/s10640-006-9054-7.
- Armatas, C. A., T. J. Venn, and A. E. Watson. 2014. “Applying Q-Methodology to Select and Define Attributes for non-Market Valuation: A Case Study from Northwest Wyoming, United States.” Ecological Economics 107: 447–456. doi:https://doi.org/10.1016/j.ecolecon.2014.09.010.
- Bailar, B., L. Bailey, and J. Stevens. 1977. “Measures of Interviewer Bias and Variance.” Journal of Marketing Research 14 (3): 337–343. doi:https://doi.org/10.2307/3150772.
- Barry, J., and J. Proops. 1999. “Seeking Sustainability Discourses with Q Methodology.” Ecological Economics 28 (3): 337–345. doi:https://doi.org/10.1016/S0921-8009(98)00053-6.
- Boxall, P. C., and W. L. Adamowicz. 2002. “Understanding Heterogeneous Preferences in Random Utility Models: A Latent Class Approach.” Environmental and Resource Economics 23 (4): 421–446. doi:https://doi.org/10.1023/A:1021351721619.
- Brown, S. R. 1980. Political Subjectivity: Applications of Q Methodology in Political Science. New Haven, CT: Yale University Press.
- Brown, S. R., and K. J. Kim. 1981. “The Indigenization of Methodology.” Social Science and Policy Research 3 (3): 109–139. Retrieved from http://s-space.snu.ac.kr/handle/10371/37951.
- Cherchi, E., and J. de Dios Ortúzar. 2008. “Empirical Identification in the Mixed Logit Model: Analysing the Effect of Data Richness.” Networks and Spatial Economics 8 (2–3): 109–124. doi:https://doi.org/10.1007/s11067-007-9045-4.
- Ching, L., and M. Mukherjee. 2015. “Managing the Socio-Ecology of Very Large Rivers: Collective Choice Rules in IWRM Narratives.” Global Environmental Change 34: 172–184. doi:https://doi.org/10.1016/j.gloenvcha.2015.06.012.
- Cooper, P., G. L. Poe, and I. J. Bateman. 2004. “The Structure of Motivation for Contingent Values: a Case Study of Lake Water Quality Improvement.” Ecological Economics 50 (1–2): 69–82. doi:https://doi.org/10.1016/j.ecolecon.2004.02.009.
- Day, B., I. J. Bateman, R. T. Carson, D. Dupont, J. J. Louviere, S. Morimoto, … P. Wang. 2012. “Ordering Effects and Choice Set Awareness in Repeat-Response Stated Preference Studies.” Journal of Environmental Economics and Management 63 (1): 73–91. doi:https://doi.org/10.1016/j.jeem.2011.09.001.
- Dayton, B. W. 2000. “Policy Frames, Policy Making and the Global Climate Change Discourse.” In Social Discourse and Environmental Policy: An Application of Q Methodology, edited by H. Addams and J. L. R. Proops, 71–99. Cheltenham: Edward Elgar.
- Dryzek, J. S., and J. Berejikian. 1993. “Reconstructive Democratic Theory.” American Political Science Review 87 (01): 48–60. doi:https://doi.org/10.2307/2938955.
- Environment Agency. 2015. Water for Life and Livelihoods. Part 1: Anglian River Basin District. River Basin Management Plan. Bristol: Environment Agency.
- Furlong, N. E., E. A. Lovelace, and K. L. Lovelace. 2000. Research Methods and Statistics: An Integrated Approach. San Diego: Harcourt College.
- Hampson, D. I., S. Ferrini, D. Rigby, and I. J. Bateman. 2017. “River Water Quality: Who Cares, How Much and Why?” Water 9 (8): 621. doi:https://doi.org/10.3390/w9080621.
- Hunter, P. D., N. Hanley, M. Czajkowski, K. Mearns, A. N. Tyler, L. Carvalho, and G. A. Codd. 2012. “The Effect of Risk Perception on Public Preferences and Willingness to Pay for Reductions in the Health Risks Posed by Toxic Cyanobacterial Blooms.” Science of The Total Environment 426: 32–44. doi:https://doi.org/10.1016/j.scitotenv.2012.02.017.
- Jick, T. D. 1979. “Mixing Qualitative and Quantitative Methods: Triangulation in Action.” Administrative Science Quarterly 24 (4): 602–611. doi:https://doi.org/10.2307/2392366.
- Johnston, R. J., K. J. Boyle, W. Adamowicz (Vic), J. Bennett, R. Brouwer, T. A. Cameron, … C. A. Vossler. 2017. “Contemporary Guidance for Stated Preference Studies.” Journal of the Association of Environmental and Resource Economists 4 (2): 319–405. doi:https://doi.org/10.1086/691697.
- Kejser Jensen, A. 2019. “A Structured Approach to Attribute Selection in Economic Valuation Studies: Using Q-Methodology.” Ecological Economics 166: 106400. doi:https://doi.org/10.1016/j.ecolecon.2019.106400.
- Kerr, G. N., and S. R. Swaffield. 2007. Amenity Values of Spring Fed Streams and Rivers in Canterbury, New Zealand: A Methodological Exploration. Research Report No. 298. Christchurch, New Zealand: Agribusiness and Economics Research Unit, Lincoln University. http://www.academia.edu/download/42124256/Amenity_values_of_spring_fed_streams_and20160205-30232-hsu0fq.pdf.
- Lawrence, R. J. 2010. “Deciphering Interdisciplinary and Transdisciplinary Contributions.” Transdisciplinary Journal of Engineering & Science 1 (1): 125–130. doi:https://doi.org/10.22545/2010/0003.
- Maki Sy, M., H. Rey-Valette, M. Simier, V. Pasqualini, C. Figuières, and R. De Wit. 2018. “Identifying Consensus on Coastal Lagoons Ecosystem Services and Conservation Priorities for an Effective Decision Making: A Q Approach.” Ecological Economics 154: 1–13. doi:https://doi.org/10.1016/j.ecolecon.2018.07.018.
- Marsh, C. 1982. The Survey Method: The Contribution of Surveys to Sociological Explanation. Contemporary Social Research Series: 6. London: Allen and Unwin.
- McKeown, B., and D. Thomas. 1988. Q Methodology. Newbury Park, CA: Sage.
- Natural England. 2016. Catchment Sensitive Farming. Anglian River Basin District Strategy 2016 to 2021. York: Natural England.
- Niemeyer, S., J. Petts, and K. Hobson. 2005. “Rapid Climate Change and Society: Assessing Responses and Thresholds.” Risk Analysis 25 (6): 1443–1456. doi:https://doi.org/10.1111/j.1539-6924.2005.00691.x.
- Parkhill, K. A., N. F. Pidgeon, K. L. Henwood, P. Simmons, and D. Venables. 2010. “From the Familiar to the Extraordinary: Local Residents’ Perceptions of Risk When Living with Nuclear Power in the UK: Perceptions of Risk When Living with Nuclear Power in the UK.” Transactions of the Institute of British Geographers 35 (1): 39–58. doi:https://doi.org/10.1111/j.1475-5661.2009.00364.x.
- Rittel, H. W. J., and M. M. Webber. 1973. “Dilemmas in a General Theory of Planning.” Policy Sciences 4 (2): 155–169. doi:https://doi.org/10.1007/BF01405730.
- Robinson, J. G. 2011. “Ethical Pluralism, Pragmatism, and Sustainability in Conservation Practice.” Biological Conservation 144 (3): 958–965. doi:https://doi.org/10.1016/j.biocon.2010.04.017.
- Sandbrook, C., I. R. Scales, B. Vira, and W. M. Adams. 2010. “Value Plurality among Conservation Professionals.” Conservation Biology 25 (2): 285–294. doi:https://doi.org/10.1111/j.1523-1739.2010.01592.x.
- Schmolck, P. 2014. PQMethod. Version 2.35.
- Sell, D. K., and S. R. Brown. 1984. “Q Methodology as a Bridge Between Qualitative and Quantitative Research: Application to the Analysis of Attitude Change in Foreign Study Program Participants.” In Qualitative Research in Education, edited by J. L. Vacca and H. A. Johnson, 79–87. Kent, OH: Kent State University, Bureau of Educational Research and Service.
- Simmons, P., and G. Walker. 1999. “Tolerating Risk: Policy Principles and Public Perceptions.” Risk Decision and Policy 4 (3): 179–190. http://www.academia.edu/download/43623998/1999_Tolerating_Risk_pre-print.pdf.
- StataCorp. 2013. StataCorp, Stata Statistical Software, Version 13.1.
- Stephenson, W. 1935. “Correlating Persons Instead of Tests.” Character and Personality 4: 17–24. doi:https://doi.org/10.1111/j.1467-6494.1935.tb02022.x.
- Turner, R. K., J. Paavola, P. Cooper, S. Farber, V. Jessamy, and S. Georgiou. 2003. “Valuing Nature: Lessons Learned and Future Research Directions.” Ecological Economics 46 (3): 493–510. doi:https://doi.org/10.1016/S0921-8009(03)00189-7.
- Walder, P., and J. Kantelhardt. 2018. “The Environmental Behaviour of Farmers – Capturing the Diversity of Perspectives with a Q Methodological Approach.” Ecological Economics 143: 55–63. doi:https://doi.org/10.1016/j.ecolecon.2017.06.018.
- Watts, S., and P. Stenner. 2012. Doing Q Methodological Research: Theory, Method & Interpretation. London: Sage.