
 ?Mathematical formulae have been encoded as MathML and are displayed in this HTML version using MathJax in order to improve their display. Uncheck the box to turn MathJax off. This feature requires Javascript. Click on a formula to zoom.
ABSTRACT
Omission of substitute sites in travel cost analysis can cause an overestimation of recreational benefits. Only few analyses have included substitutes, partly because of the difficulty in defining an appropriate set of substitutes. We examine factors affecting the existence of substitutes and their impact on the demand and value of coastal recreation using spatially-referenced survey data from Finland, Germany and Latvia on recreational visits to the Baltic Sea, which can be characterized as a unique destination. Substitutes are defined by respondents themselves. Our findings indicate that the existence and effects of substitute sites differ across countries. Many respondents have no substitutes for Baltic Sea recreation, in particular in Latvia. Respondent and visit-specific factors explain the probability of having substitutes. Substitutes reduce the demand for coastal recreation in Finland and Germany but increase it in Latvia. Further, respondents having substitutes are less sensitive to travel costs in Germany and more sensitive in Finland and Latvia. The annual welfare from Baltic Sea recreation is lower for people who have substitutes in Finland and Germany, and higher in Latvia. The findings suggest that uniform assumptions about the existence and effects of substitutes appear unwarranted, especially for sites of unique or iconic nature.
1. Introduction
The travel cost method is frequently used to assess the recreational value of nature in economic terms (Hanauer and Reid Citation2017; Prayaga Citation2017; Czajkowski et al. Citation2015). The method is based on the basic assumption of demand theory, implying that the demand for the visits is inversely related to travel costs. An important but often neglected factor in the demand and value of a recreation site is the availability of substitutes (Shrestha and Loomis Citation2001; Reynaud and Lanzanova Citation2017; Ghermandi Citation2015). Substitution effects need to be taken into account when valuing a recreation site as omitting substitutes has been shown to cause significant overestimation of the economic benefits of the recreation site (Rosenthal Citation1987; Freeman, Herriges, and Kling Citation2014). Different kinds of outdoor recreation sites or activities can serve as substitutes for one another. In theory, the existence of a substitute should lower the demand for recreation at a particular site.
Substitutability among goods means that it is possible to substitute one good with another without losing utility, as substitute goods or services are alternatives for each other. The substitutability of goods depends on the perceived similarity of the goods. Random utility models for modelling recreation demand use substitution patterns as an integrated part of the analysis, because their focus is on the choice of a recreational site from a bundle of sites (Parsons, Plantinga, and Boyle Citation2000). In single-site travel cost models, in contrast, substitution needs to be accounted for with one or more explanatory variables. Rosenthal (Citation1987) was the first to examine how the benefits from water recreation at a reservoir were impacted by substitute sites using a single-site travel cost model, revealing that omitting substitute sites caused significant overestimation of the benefits of the recreation site. Since that study, it has been suggested that single-site travel cost models should include substitute sites (Freeman, Herriges, and Kling Citation2014), focusing on sites that are frequently visited by respondents, that have similar characteristics to the study site, or that are close to the study site (Parsons Citation2003). In the few single-site travel cost studies, it has been common to include only one substitute site similar to the site under valuation in the analysis. In most of these studies, they have been represented either with travel costs of or the distance to the substitute site (e.g. Zhang et al. Citation2015; Alves et al. Citation2017; Boyer, Melstrom, and Sanders Citation2017).
Omission of substitutes is typically due to the difficulty in defining the set of relevant substitutes (choice set) that visitors might have in their mind when shifting to another site for recreation (Lupi, Phaneuf, and von Haefen Citation2020). Defining the geographical area of a valuation study is commonly referred to as the ‘(spatial) scope definition’ problem (Spencer-Cotton, Kragt, and Burton Citation2018). In several countries, such as the Nordic countries, open access conditions under everyman’s right also lead to difficulties in identifying substitutes, because most natural areas are freely and openly available for recreation, which leads to a large number of potential substitutes (Ovaskainen, Neuvonen, and Pouta Citation2012; Huhtala and Lankia Citation2012; Lankia, Neuvonen, and Pouta Citation2019). As a result, substitutes are usually omitted from the analysis, which is likely to inflate the value estimates (Rosenthal Citation1987; Freeman, Herriges, and Kling Citation2014). Defining substitutes is even more demanding in the case of iconic or unique recreational sites, such as the Baltic Sea, since many users cannot imagine a site that would provide similar benefits for them (Rolfe and Windle Citation2012; Artell, Ahtiainen, and Pouta Citation2019). In this case, the impact of omitting substitutes on welfare estimates could be smaller, and large observed recreation values could result from the lack of perceived substitutes. Site choice is dependent on both distance and site characteristics, and the level of substitutability between sites may differ (Lo Citation1991; De Valck et al. Citation2016). Recreation sites are often imperfect substitutes, or they may be complements, implying that distance has less effect on the site choice, and that multipurpose trips are more likely to destinations which have a large number of complementary sites (e.g. Lo Citation1991). Thus, the degree of substitution can influence how much the existence of substitutes affects the number and value of visits, and it may vary in different contexts. In any case, information on sites that represent potential substitutes for nature recreation in different contexts is needed for unbiased welfare estimation.
The Baltic Sea is one of the world’s largest brackish waters located in Northern Europe, and an important recreational destination for the residents of its nine coastal countries (Ahtiainen et al. Citation2013). The impaired state of the Baltic Sea environment (HELCOM Citation2018) has reduced its recreational potential and value of recreation visits (Czajkowski et al. Citation2015; Bertram et al. Citation2020). This has raised the issue of substitution, with people looking for possible alternative sites inland and other coastal areas. Almost every summer, the recreational use of the Baltic Sea is restricted along a considerable proportion of the coastline due to blue–green algal blooms caused by excessive inputs of nutrients. For example, in Finland, half of the recreational users of the Baltic Sea have observed blue–green algal blooms that impede recreational use of the sea (Bertram et al. Citation2020). For recreational users who do not have alternatives to their typical sites and are tied to a location, this means a loss of recreational benefits. For other recreational users who are more flexible, possibly due to more abundant time, money, knowledge or equipment, substitutes for the Baltic Sea coast can more easily offer a solution to maintain their welfare level. Understanding of these differences in perceived benefits and recreational behaviour also has importance for the management of recreational sites.
Potential substitute sites can be identified by the researcher, based on areas with similar characteristics and services, or by the respondents themselves (De Valck et al. Citation2017; De Valck and Rolfe Citation2018; Glenk et al. Citation2020; Schaafsma and Brouwer Citation2020). The assumptions used in defining the choice set can potentially influence the welfare estimates (Lupi, Phaneuf, and von Haefen Citation2020). For the Baltic Sea, researcher-driven definitions of substitutes relying, for example, on the number of beaches or access to other water areas may not correspond to people’s own perception of potential alternative sites. The recreational experiences people seek for might differ between the Baltic Sea and water systems located near one’s place of residence, and the Baltic Sea could be characterized as being unique or iconic to the people living in the coastal countries. Thus, we focus on exploring the existence of potential substitutes for Baltic Sea recreation, and the impacts of having substitutes on the number of Baltic Sea recreation visits and recreation values. Similar to De Valck et al. (Citation2016), we allow respondents to identify substitute sites themselves on maps in an internet survey with a built-in map-based survey tool, rather than having them defined by researchers using proxies for potential substitutes.
Sagebiel et al. (Citation2016) identified 29 valuation studies on Baltic Sea recreational services published between 1995 and 2015. Only few revealed preference studies have been conducted (Sandström Citation1996; Soutukorva Citation2001; Vesterinen et al. Citation2010; Czajkowski et al. Citation2015, Citation2020; Bertram et al. Citation2020). Vesterinen et al. (Citation2010) argued that recreation at a summer cottage or other type of vacation residence could be a common substitute for water recreation close to home. Random utility models inherently account for substitutes for recreation as they consider individual’s recreation site choice from a set of alternative recreation sites, but only three studies for the Baltic Sea are available (Sandström Citation1996; Soutukorva Citation2001; Czajkowski et al. Citation2020). An international travel cost study by Czajkowski et al. (Citation2015) omitted substitutes from the analysis, and only speculated that they may be one cause of differences in valuations across countries. Recently, Bertram et al. (Citation2020) used the same dataset as ours in a travel cost - contingent behaviour study, but only discussed the possible effects of substitutes.
Beyond valuation studies, behavioural studies on recreation have found that the substitutability of sites or activities is influenced by demographics (e.g. age, education and gender) (Ditton and Sutton Citation2004; Sutton and Ditton Citation2005). These studies have also identified constraints individuals face that prevent them from participating in certain recreational activities or visiting sites, for example, lack of time, money, access and equipment, and lead to searching for substitutes. It has also been suggested that place attachment or specialization in specific recreation activities may hinder substitution (Oh, Sutton, and Sorice Citation2013; Sutton and Oh Citation2015; Han, Noh, and Oh Citation2015).
This article adds to the existing valuation literature on substitute sites and their impact on the welfare estimates in travel costs analyses by examining the existence of substitutes for coastal recreation sites and the effect of substitutes on the number of visits and recreation values in three Baltic Sea countries (Finland, Latvia and Germany). We analyse the effects of visitor and Baltic Sea recreation site characteristics on the existence of substitute sites, as well as provide information on the characteristics of the potential substitute sites. With this information, we identify the population group that is likely to lack substitutes and is the most sensitive to a decline in the environmental quality of the Baltic Sea. We assess the overall impact of substitutes on the number and value of coastal recreation trips for a destination that has unique or iconic characteristics. As we use spatially referenced survey data collected from three countries, we also compare the substitution patterns between these countries. Our findings imply that uniform assumptions about the existence and effects of substitutes appear unwarranted, especially in the case of sites that could be characterized as unique.
2. Survey and data
2.1 Survey design and implementation
Our data come from an economic valuation survey focusing on recreational visits to the Baltic Sea and the preferred future state of the Baltic Sea. The analysis focuses on the travel cost data collected with the survey. The survey elicited information on the respondents’ leisure visits to the Baltic Sea in general, and detailed information was collected related to the last recreation visit to their most frequently visited site at the Baltic Sea, including travel costs, mode of transport, activities and purpose of the trip. The final section of the survey included questions on respondents’ socio-demographic characteristics.
Map-based questions were used to gather information about the location of the respondents’ place of residence and their most frequently visited recreation site on the Baltic Sea. In the survey, visitors were also asked to determine one or more potential substitute sites for their most frequently visited Baltic Sea recreation site. The question on substitute sites was map-based (Appendix A). Respondents were asked to indicate a location in their country where they would go to find a similar recreational experience to their Baltic Sea recreation site. The question was formulated as follows: ‘Please imagine now that the environmental quality at the Baltic Sea and its coast becomes so poor that you start thinking about going somewhere else for recreation. Where in [Finland / Germany / Latvia] would you go to have a similar recreational experience? You can mark any site that you would consider going to instead of the Baltic Sea.’ Respondents who did not choose a location on the map could state their reason for not having a substitute site by answering a multiple-choice question with three options: ‘I would stay at home’, ‘I don’t know where I would go’ and ‘Other reason’.
The survey was developed in collaboration with environmental valuation and marine ecology scientists. The pre-testing included focus groups and a pilot survey conducted in each country in June–July 2016. After the pilot survey, the survey was shortened and instructions for answering the mapping questions were improved.
The data were collected between November 2016 and February 2017 from stratified random samples of Latvians, Germans and Finns. Finnish and German respondents only replied to the questions via the Internet, but to ensure a representative sample of Latvians, computer-assisted personal interviews were also conducted, because Internet use in older age groups was not sufficient for reaching a representative sample via the Internet panel in Latvia. The online questionnaire allowed us to use a map-based survey tool (Maptionnaire) to determine the respondents’ places of residence, recreational sites and substitute sites, as well as the Euclidian and road distance between them.
A total of 4,819 responses were received from the three countries (), with approximately 2,000 individuals completing the survey in Finland and Germany and 760 in Latvia (see Ahtiainen et al. Citation2019 and Bertram et al. Citation2020 for details).
Figure 1. The data structure.
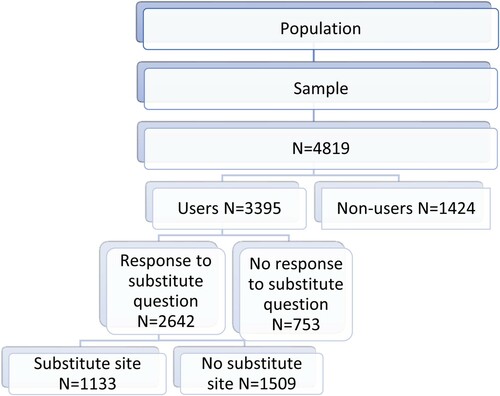
Responses to the map-based substitute question divided users into two subsamples: those who responded to the substitute question and those who did not. About 22% of users did not respond to the substitute question.Footnote1 Out of those who did respond to this question, we defined a group of respondents who reported having a substitute site and a group who reported having no substitute site for Baltic Sea recreation. The data structure and number of observations in each step is presented in . Our analysis is focused on the sample of people who gave a response to the substitute question (n = 2642), with 1257 respondents in Finland, 827 in Germany and 558 in Latvia.
2.2 Number of visits, travel costs and substitutes
Respondents who had visited the Baltic Sea within the last three years were considered users (). The dependent variable, i.e. number of recreation trips to the Baltic Sea per year, was determined as follows. First, possible outliers were removed from the analysis by limiting the maximum number of trips to the Baltic Sea to 365 per year. This resulted in excluding 3 observations. Second, the number of trips within the previous 12 months was calculated for all respondents by dividing the number of visits in the last three years by three for those respondents who had visited the Baltic Sea during the last three years but not within the last 12 months. Third, to satisfy the requirement of only including positive integers in the dependent variable, the number of trips was rounded off to the closest integer. After this, 265 observations of zero trips remained for the dependent variable, because 265 respondents had visited the Baltic Sea only once within the previous three years. Finally, these observations were removed. The final dependent variable, representing the annual number of recreation trips to the Baltic Sea, ranged between 1 and 365 trips.
To maintain consistency in the analysis, both the travel costs and information on the substitutes used in the analysis were defined based on respondent’s perceptions. The respondent-reported travel costs were based on a question where respondents were asked to give their share of the one-way travel costs to their most often visited Baltic Sea site, excluding meals and accommodation. The respondent-reported travel costs provide a practitioner-friendly approach, avoiding the problems of researcher-driven calibration of benefit measures (Ovaskainen, Neuvonen, and Pouta Citation2012). Furthermore, the respondent-reported cost measure has been found to perform well in terms of significance and fit (Ovaskainen, Neuvonen, and Pouta Citation2012). Outliers were identified for each country by utilizing information on the third quartile (Q3, 75th percentile) and interquartile range (IQR) of the stated travel cost variable, such that observations with travel cost higher than Q3 + 1.5*IQR were excluded (Tukey Citation1977).Footnote2 Round-trip travel costs were calculated by multiplying the one-way travel costs reported by respondents by two. Finally, the travel costs were adjusted for differences in price levels using purchasing power parity (PPP) data from Eurostat (Citation2017). Following the results of Ovaskainen, Neuvonen, and Pouta (Citation2012), who reported that perceptions of travel time vary between respondents from being a cost to a pleasant part of the trip, and also following Akron et al. (Citation2017) and Hynes, Gaeven, and O'Reilly (Citation2017), we excluded travel time from the cost parameter.
The analysis of substitutes includes those respondents who responded to the substitute question either by indicating the location of potential substitutes or giving a reason for not providing information on substitutes. Respondents who marked one or more potential substitute sites on the interactive map were considered to have a substitute for Baltic Sea recreation. Those who did not mark any locations on the map were asked for a reason, with three response options ‘I would stay at home’, ‘I don’t know where I would go’ and ‘Other reason’. Respondents choosing any of these three reasons for not indicating a location were defined as having no substitutes. In addition, those respondents who were defined as users and had answered the previous map questions in the survey, but did not mark a location for a substitute were assumed to have no substitutes.Footnote3 Other than that, those who did not either mark a location on the map or give a reason for not marking a location were excluded from the analysis. Besides the location of the substitute, there was no information on the potential previous or future visits to the substitute from the survey due to length constraints.
Based on this information, a dummy variable for the existence of substitutes () was constructed, following the approach of Bowker, English, and Donovan (Citation1996) and Amoako-Tuffour and Martínez-Espiñeira (Citation2012). It was used as a dependent variable in the logit model to examine the factors determining the existence of substitutes for Baltic Sea recreation. In the travel cost models, it was an explanatory variable capturing the impact of having substitute sites on the number of trips. The expectation was that the sign of the variable would be negative, meaning that fewer trips would be made if a respondent had a substitute site. The dummy variable for substitutes could be further multiplied with the travel cost variable (
) for an easily interpretable interaction term between the substitute dummy and the travel cost variable (
) (Lankia, Neuvonen, and Pouta Citation2019; Huhtala and Lankia Citation2012; Loomis, Gonzalez-Caban, and Englin Citation2001; Bhat Citation2003; Blaine et al. Citation2015). The interaction term
affects the slope of the estimated recreation demand curve. The change in the steepness of the slope indicates the effect of substitute sites on the welfare estimate. According to economic theory, price elasticity is higher for goods or services that have substitutes, and a negative sign for the interaction was thus expected. This means that the recreation demand curve would be steeper for individuals with substitute sites compared to those without, leading to lower welfare estimates.
We imputed income information for those respondents who failed to report it, following the approach by Bertram et al. (Citation2020). Demographic characteristics (age, age squared, gender, education level, and employment status) of those respondents who reported income were used in a univariate imputation with truncated regression to fit income for the respondents who did not report income, implemented in Stata 16. Income was imputed for 361 respondents in our analysis sample (n = 2642). Finally, income was adjusted with PPP to account for differences in price levels and allow international comparisons (Eurostat Citation2017).
3. Econometric approach
The econometric analysis included two parts: first, we examined the factors influencing the existence of perceived substitute sites for Baltic Sea recreation, and second, used travel cost models to assess the effects of substitutes on the number of visits and the recreational value of the Baltic Sea. Descriptive statistics for the variables used in the analysis are presented in .
Table 1. Descriptive statistics for the variables in the logit and negbin models.
Logistic regression (e.g. Greene Citation2007; Hosmer Jr, Lemeshow, and Sturdivant Citation2013) was applied to investigate factors influencing the existence of perceived substitute sites. The dependent variable was dichotomous, specifying whether the respondent stated having a substitute site for Baltic Sea recreation or not (see section 2.2). The sample was restricted to those for whom we had information on the existence of substitutes (n = 2642). Potential independent variables that were tested in the logit model described socio-demographic characteristics, the environmental conditions at the respondent’s most frequently visited site and the pattern of respondent’s recreational visits to the Baltic Sea coast. Distance variables were also assumed to be good indicators for having substitute sites, because as the distance to the site under valuation increases, the number of substitute sites should also increase. Based on the preliminary model estimations, only eight of the possible variables were significant and included in the final model.
A travel cost (TC) model was used to assess the effects of substitutes and other explanatory variables on the number of visits to and the recreational value of the Baltic Sea. The dependent variable in the travel cost model was the annual number of all recreational visits the respondent made to the Baltic Sea in total.
Count data models, i.e. Poisson and negative binomial, are particularly suitable for analysing recreation demand, as only positive integers are allowed for the dependent variable. The negative binomial model was chosen over the Poisson model because it allows for overdispersion in the data, meaning that the variance of the dependent variable, i.e. the number of trips, is greater than the mean (Freeman, Herriges, and Kling Citation2014; Haab and McConnell Citation2005).
Following Winkelmann (Citation2008), Hellerstein (Citation1991) and Haab and McConnell (Citation2005), the probability density function of the negative binomial model, and thus the probability of an individual taking trip in a certain time frame, is calculated as follows:
(1)
(1) where
is the gamma function. The parameter alpha
) is the overdispersion parameter.
The negative binomial model produces a regression model that models the number of trips () as an exponential function of the explanatory variables:
(2)
(2) Here, the explanatory variables included the stated travel costs (
), income (
), and information about substitutes in the form of a dummy variable
for the existence of substitute sites and an interaction term between the travel cost and substitute variables (
). In addition, other respondent, visit and site-specific characteristics were included in the model as explanatory variables (
,
). The visit and site-specific characteristics were based on questions on the respondent’s last trip to their most often visited recreation site at the Baltic Sea.
The negative binomial models were estimated using maximum likelihood estimation (Hilbe Citation2011). To test the effect of substitute sites on the number of trips, as well as on the coefficient of the travel cost and the welfare estimates, three models were estimated. The first model introduced all independent variables to the estimation except for substitute variables. In the second model, a dummy variable (Substitute) for the existence of substitute sites was added. Model three included the interaction term . Stepwise estimation was performed to arrive at the final models, and nonsignificant variables were dropped based on the Wald test. The significance of the effect of
,
and
on the goodness-of-fit between the models was tested with the likelihood ratio (LR) test. All models were estimated using the pooled sample and separately for each country.
Welfare estimates for a visit were calculated from each model. The exponential functional form for the number of trips allows the consumer surplus (CS) per trip to be calculated by the following simple formula (Haab and McConnell Citation2005):
(3)
(3) For model 3, where the estimated model included the travel cost-substitute interaction term
, the interaction term influences the steepness of the slope of the recreation demand curve and the per-trip consumer surplus was calculated in the following way (Lankia, Neuvonen, and Pouta Citation2019; Loomis, Gonzalez-Caban, and Englin Citation2001):
(4)
(4) The mean seasonal access value per person was calculated by multiplying the per-trip CS by the model’s predicted mean number of trips taken by the individual annually.
4. Results
4.1. Sample characteristics and descriptive statistics
Descriptive statistics for the sample are presented in Appendix B. A comparison to the populations of Germany, Finland and Latvia indicates that the samples of respondents answering to the substitute question are fairly representative of the national populations for age, household size, educational level and gender distribution (Official Statistics Finland Citation2019; Central Statistical Bureau of Latvia Citation2018; DesStatis Citation2019). Mean income appears to be higher in the sample in Germany and lower in Latvia than in the population.
In total 2,642 respondents (78% of users) provided information on having substitute sites in the Baltic Sea region. Most of them (1,509; 57%) did not have a substitute for Baltic Sea recreation (). The share varied by country, as 53% in Finland, 48% in Germany and 80% in Latvia did not report a substitute. The most common reason (approximately 70%) for not marking a location of a substitute site was that the respondent did not know where they would go. Roughly 20–25% of respondents said they would stay at home, and less than 10% had some other reason for not indicating a substitute. A total of 1,133 respondents (43%) identified at least one substitute site on the map, and 181 of these respondents had more than one substitute site. Altogether, 370 substitute sites were located close to the Baltic Sea coast and the rest of the substitute sites were located inland. Location information for 51 substitute sites was outside the country borders and left out from the analysis.Footnote4 A total of 545 substitute sites were identified by Finnish respondents, 414 by German respondents and 111 by Latvian respondents.
Table 2. Logistic regression model for the existence of substitute sites (dependent variable = 1 if the respondent had a substitute site for Baltic Sea recreation).
The mean Euclidian distance from a respondent’s home to a substitute site was 215 km in Germany, 204 km in Finland and 79 km in Latvia. By comparison, the mean Euclidian distance to the recreation site on the Baltic Sea coast was 230 km in Germany, 158 km in Finland and 87 km in Latvia. These long average distances indicate that visits to the Baltic Sea do not represent local recreation but are rather trips specifically to the coast. This is the case also for substitute sites, which indicates that recreation sites close to people’s place of residence are not, generally, considered as substitutes for Baltic Sea recreation.
Several data sources were used to determine the land cover and land use at and around the substitute sites (Copernicus database coordinated by the European Environment Agency (EEA Citation2019a), Corine Land Cover (CLC), the Marine Regions database (Flanders Marine Institute Citation2019) and Natura 2000 network (EEA Citation2019b)). The land use type for the substitute site was determined based on the main land use in the 500-meter buffer zone surrounding the site. The land use was divided into five exclusive classes: 1) artificial surface (towns, cities, etc.); 2) agricultural areas; 3) forest and semi-natural areas; 4) wetlands; and 5) water bodies (lakes, rivers, etc.). These variables were tested in the logit and negative binomial models but as they were found non-significant, they were left out of the final models. However, they can be used to describe the substitute sites identified by the respondents.
For the Finnish respondents, 39% of the substitute sites were located at water bodies, 20% on artificial surfaces and 36% in forest areas. The distribution was somewhat different in Germany, where 42% of substitute sites were located on artificial surfaces, 26% on agricultural areas, 15% in forested areas and 13% at water bodies. For the Latvian sample, 46% of substitute sites were located at water bodies, 27% on artificial surfaces and 18% in forest areas. The high percentage of artificial surfaces and forest areas reported by the respondents of all countries as the main land use type surrounding the substitute sites implies that access to large water areas was not necessarily needed for the recreational activities at these substitute sites. This was particularly the case for German respondents, relatively few of whom reported that substitute sites were located at water bodies compared to the respondents from Finland and Latvia. Thus, it appears that substitute sites for Baltic Sea recreation are not necessarily water-related but can represent a variety of site types based on land use.
Among those who had visited the Baltic Sea for recreation within the last three years (defined as users), the average number of trips per year taken to the Baltic Sea was approximately 13 (). The distribution is skewed with a large standard deviation, as most visitors made 1–3 trips to the Baltic Sea per year (75% in Germany, 54% in Finland and in Latvia) and there were few people with as many as 365 visits. This indicates that the Baltic Sea is an important recreational site for Finns, Germans and Latvians. The average number of visits was the highest in Finland, followed by Germany and Latvia. The average stated travel cost was approximately €73 with considerable variation across countries, being €117 in Germany, €58 in Finland and €35 in Latvia.Footnote5 The average Euclidean distance to the most often visited recreation site was around 155 km, ranging from 87 km in Latvia to 235 km in Germany.
Since the coastal areas of Latvia, Germany and Finland are densely populated, it is not surprising that more than half of the respondents had purposes other than recreation for their trips to the Baltic Sea. The average duration of the visit was 39 h, but as the maximum time spent at the site was 29 days, a large share of the trips was less than one day in duration.
The recreation/CES variable describes the relative importance of recreation compared to other cultural ecosystem services such as existence values related to habitats and species, landscape values and learning and gaining new information (full description in Ahtiainen et al. Citation2019). Recreation was considered the most important in Latvia, where 75% of the respondents reported recreation to be an important cultural ecosystem service. Corresponding percentages were 42% in Germany and 53% in Finland.
4.2 Logistic regression for having substitutes
The logistic regression model presents the profile of respondents having substitute sites for Baltic Sea recreation ( and ). In our case, the existence of substitutes depends on how the site is used rather than its characteristics. The probability of having a substitute site increased if an individual visited the Baltic Sea regularly, i.e. within the previous 12 months, and participated in more than one recreational activity. This indicates that ordinary, everyday sites that are visited often are more likely to have substitutes, while sites with special or unique characteristics are less likely to have substitutes, consistent with the findings of Rolfe and Windle (Citation2012). Engaging in activities with direct water contact (swimming or diving) at the most visited site decreases the likelihood of having substitutes, which appears expected as there are less locations where such activities are possible.
In addition, respondents living further away from the Baltic Sea coast were less likely to have substitutes for their recreation site.Footnote6 Although this may seem counterintuitive, as one would expect that the likelihood of substitutes would increase with increasing distance, it may also provide additional support to the assumption that substitutes are less probable for unique sites and those who live further away from the coast may consider the Baltic Sea as a one-of-a-kind destination.
Turning to consider the individual characteristics, the probability of having substitutes increased if the respondent had a university or polytechnic education and was between the ages of 30 and 64 compared to respondents with a lower educational level and who were either younger or older, respectively.
Out of the site characteristics, only the (self-reported) number of facilities was significant, indicating that having many facilities at the most frequently visited site increased the likelihood of having a substitute site. One might expect that there would be less sites with many facilities available, thus decreasing the likelihood of having substitutes. This could be explained by people visiting sites with many facilities being more aware of alternative recreational sites and possibilities and not considering the sea itself as important as the available services available. Another possible explanation could be that sites with fewer facilities are considered more unique, e.g. as nature destinations, whereas those with many facilities can be more easily substituted. The probability of having a substitute site was lower for Latvians compared to Germans. This could be explained by Latvians’ access to marine recreation being limited to the Baltic Sea, compared to more ample possibilities in other sea areas in Germany.
Although the model was significant, the goodness of fit was low. The overall predictive capability was moderate, as 62.6% of predictions were correct. This indicates that there may be other factors that determine the existence of substitutes not easily captured with variables explaining the characteristics of the individual or the recreation site.
4.3 Travel cost models
The results of the travel cost models are presented in . Each model was estimated separately for the three countries. Model 1 was a standard travel cost model with no information on substitutes. Model 2 included a dummy variable for having a substitute site (), and Model 3 included the substitute dummy and a travel cost-substitute interaction term (
).Footnote7 All models fulfilled the basic assumptions for demand functions: the travel cost variable was negative and statistically significant, leading to the ordinary downward sloping demand function for recreation.
Table 3. Model 1 - TC model without substitutes (dependent variable = number of recreation visits to the Baltic Sea per year).
Table 4. Model 2 - TC model with substitute dummy (dependent variable = number of recreation visits to the Baltic Sea per year).
Table 5. Model 3 - TC model with substitute dummy and travel cost - substitute interaction (TC*Substitute) (dependent variable = number of recreation visits to the Baltic Sea per year).
The results of Model 1 indicated that higher income consistently increased the number of recreation trips made to the Baltic Sea for all countries (). This is interesting as previous travel cost studies have often found income to have a non-significant or even negative effect on the number of trips (Liston-Heyes and Heyes Citation1999; Loomis Citation2003; Shrestha, Stein, and Clark Citation2007). A possible explanation is that income plays a different role for near-home recreation and visits to sites that are located further away from respondents’ homes, such as for Baltic Sea recreation. Older individuals made more trips to the Baltic Sea in Germany. High relative importance of recreation among cultural ecosystem services increased the number of trips in Finland and Latvia. The number of trips also increased if the individual participated in more than one recreation activity on the Baltic Sea coast. The effect of the purpose of the trip varied across countries. If recreation was the only purpose of the visit, Germans and Latvians made less trips to the Baltic Sea. In Finland, the effect was not significant. Engaging in activities that imply direct contact with water (swimming, diving) increases the number of trips in Germany and Latvia.
In Model 2, a dummy variable for substitutes was added (). In Finland and Germany, if the respondent had a substitute site for the Baltic Sea, the number of recreation visits was lower, whereas the effect of having substitutes on the number of trips was positive in Latvia. The differing effect is unexpected, as one would assume that substitutes would lower the number of recreation trips to a site (Freeman, Herriges, and Kling Citation2014). We examine this finding more closely as part of the discussion and conclusions section. The effects and significance of the other explanatory variables were similar to Model 1.
Model 3 included a substitute site dummy and a travel cost-substitute interaction term (). The substitute dummy was negative for Germany and positive for Latvia as in Model 2, but not significant for Finland. The sign of the travel cost-substitute interaction term varied across countries: it was significant and positive in the German model and significant and negative in the Finnish and Latvian models. Model 3 produced two distinct recreation demand curves, one for individuals with a substitute site for the Baltic Sea and one for individuals without a substitute. The slope of the demand curve for individuals without substitutes is the parameter estimate for the variable , and for individuals with substitutes the parameter estimates for
and
. The negative substitute dummy indicates that in Germany, individuals with substitute sites made fewer trips to the Baltic Sea. The positive interaction term in Germany implies that the slope of the recreation demand curve was less steep if the individual had substitutes, i.e. the number of trips was less sensitive to the travel costs, compared to individuals without substitute sites.Footnote8 In Finland and Latvia, the negative sign of the interaction variable implies a steeper recreation demand curve if the individual had substitutes. Again, the effects and significance of the other explanatory variables were similar to Models 1 and 2.Footnote9
The contribution of substitute variables to the goodness of fit of the model was examined with the likelihood ratio test. It shows that adding the substitute dummy in Model 2 significantly improved the model for all countries. Adding the interaction of the travel cost and substitute dummy in Model 3 significantly improved the model fit compared to Model 1 and Model 2.
The positive and significant ln(alpha) values for Germany and Finland indicate overdispersion, implying that the variance of the visit data exceeds the mean, and negative and significant ln(alpha) for Latvia underdispersion, which means that the variance is smaller than the mean. As the significant alphas indicate that the hypothesis of equal variance and mean is rejected, the negative binomial model was preferred to the Poisson model for all countries.
4.4 Welfare estimates
presents the CS estimates, based on Equationequation 3(3)
(3) , and the predicted number of recreation visits for each country. According to Model 1, CS estimates per visit are around €83 in Germany, €80 in Finland and €67 in Latvia. The predicted number of visits per year is the highest in Finland (13 visits), followed by Germany (9 visits) and Latvia (7 visits).
Table 6. Consumer surplus estimates and predicted number of visits for recreation on the Baltic Sea coast (CS estimates are in PPP adjusted 2017 euros).
Model 2 allows calculating the number of visits for those who reported having a substitute for Baltic Sea recreation and those who did not. Having a substitute reduces the number of annual visits from 10 to 8 in Germany and from 15 to 12 in Finland, and increases the number of visits from 6 to 9 in Latvia. CS estimates per visit from model 2 are similar to model 1. The annual CS values are lower for people who have a substitute for Baltic Sea recreation than for those who do not in Germany and Finland, while they are higher in Latvia. This is a result of the effect of having substitutes on the number of visits.
Model 3 can be used to calculate the welfare estimates for individuals with and without substitute sites for Baltic Sea recreation (Equationequation 4(4)
(4) ). As the travel cost-substitute interaction term was positive for Germany, having a substitute increases the CS per trip. However, as the number of trips is considerably lower for people having a substitute, the annual CS is also lower. In Finland and Latvia, the CS per visit is lower for people who have a substitute. Combined with the negative (although not significant) effects of having a substitute, the annual CS is lower in Finland for those who have a substitute. In Latvia, having a substitute increases the number of visits to the Baltic Sea but makes the number of visits more sensitive to the travel costs. Jointly, the results indicate that those who have a substitute have a somewhat higher annual CS from Baltic Sea recreation.
Relating the travel costs and CS to income provides additional insights about the importance of Baltic Sea recreation across the countries. Annually, travel costs to the Baltic Sea are 2.4% of disposable income in Latvia, 4.1% in Finland and 3.7% in Germany, while CS is 4.6% of income in Latvia, 5.6% in Finland and 2.6% in Germany. Thus, in relation to income, the welfare effect of Baltic Sea recreation appears to be the largest in Finland, where the largest number of visits are made. In Latvia, the share of CS to income is larger than the share of travel costs, indicating that they experience relatively larger welfare gains from travelling to the Baltic Sea than the travel costs would indicate.
5. Discussion and conclusions
This paper examined the existence of perceived substitute sites and the effect of having substitutes on recreation demand and value of recreational trips for a large marine water body, the Baltic Sea. The findings imply that there are no substitutes for Baltic Sea recreation for everyone and the effect of the existence of substitutes on the number of visits varies across countries. This reduces the usefulness of researcher-defined substitute sites, for example, based on the availability of areas with similar characteristics, as well as the appropriateness of uniform assumptions about the effects of substitutes on the number and value of recreation visits for sites that have unique or iconic characteristics.
Approximately 40% of the respondents provided information on a potential substitute for Baltic Sea recreation. The rest had no clear substitute, with the most common reason being that they would not know where to go. The probability of having substitutes for Baltic Sea recreation was higher among respondents who were middle-aged and had a higher educational level. This indicates that perceived substitutes are likely related to the awareness of the possibilities and availability of recreation resources, such as travelling equipment and opportunities. Even though awareness of recreation possibilities can be expected to increase as a function of age, the constraints experienced also change as respondents age. It is likely that such constraints limit older and younger individuals more than middle-aged. For example, some sites can be difficult to access for elderly, whereas young people tend to have less money available for recreation. This is an important aspect to be taken into account in coastal municipalities when providing recreation opportunities for their residents. As awareness of recreation opportunities increases, so too does the probability that residents will find substitute sites for the Baltic Sea, thereby avoiding a significant loss of welfare in situations where marine recreation is not possible, such as in the case of blue–green algal blooms that hamper or even prevent water-based recreation.
The results also demonstrated that respondents who have substitutes are more committed to recreation on the Baltic Sea coast, as individuals who had visited the Baltic Sea in the past 12 months and engaged in more than one recreational activity had a higher probability of having a substitute recreation site. Those who took part in swimming and diving were less likely to have substitutes. The likelihood of having a substitute site was higher for individuals that visit a Baltic Sea site with many facilities than among those who had some or no facilities. People visiting sites with many facilities may be more aware of alternative recreational sites and possibilities than those visiting sites with fewer facilities, or may not consider the sea itself to be as important as the services available, which may also be accessible in other locations away from the Baltic Sea. In addition, sites with fewer facilities could be considered more unique, e.g. as nature destinations, whereas those with many facilities can be more easily substituted.
The lower probability of perceiving substitute sites in Latvia and Finland compared to Germany most probably relates to the fact that for Germans, the North Sea or even the Mediterranean Sea are also more readily available for marine and coastal recreation, and in this sense there may be more substitutes in Germany. In Latvia, only 20% of the respondents had a substitute site for the Baltic Sea. Majority of the Latvian respondents live less than 20 kilometres from the sea, which could be a result of spatial sorting where people decide to live close to the area that they use often for recreation. Latvians could see the Baltic Sea as a special recreation site without equal substitutes. Latvians also had a considerably larger share of respondents (63%) who took part in activities with direct contact to water (swimming and diving) in their most often visited site compared to Finland (16%) and Germany (39%). This could explain the lower availability of substitutes enabling the same activities. However, analysis of the land use near the substitute sites implied that access to water was not necessarily needed for the recreational activities at these sites, indicating that substitutes can represent a variety of site types.
As the distance from the respondent’s home to the Baltic Sea increased, the likelihood of having substitutes decreased. This is against the assumption that as the distance and travel time to a site increase, the number of possible substitutes increases. Rolfe and Windle (Citation2012) suggested that there may be little change in substitutes as a function of increasing distance among those populations that live within reasonable proximity of iconic assets. The iconic nature of the Baltic Sea may partly explain the effect of distance on having substitutes. People living further away might have more potential substitutes, but at the same time, the Baltic Sea could represent a unique destination to them in terms of its nature and recreation uses. The sense of uniqueness of the Baltic Sea could be more prominent for those who live further away, reducing the existence of perceived substitutes. In addition, independent of their distance to the sea, some people may want to visit the Baltic Sea specifically. For example, the Finnish archipelago could be considered as a special one-of-a-kind destination for recreationists. Further, people’s perceptions, knowledge and experiences of the Baltic Sea could be distance-dependent and affect their view of the existence of possible substitutes (Schaafsma Citation2010). In this sense, our findings provide additional support to the assumption that substitutes are less probable for unique sites, and that those who live further away from the coast may consider the Baltic Sea as a one-of-a-kind destination compared to those who live close-by and use it more frequently for recreation. This interpretation is in line with the finding that people who had visited the Baltic Sea recently were more likely to have a substitute.
Based on the findings, as several respondent- and visit-specific factors were significant in explaining the existence of substitutes, uniform assignment of substitutes to respondents would appear inappropriate and could bias the welfare estimates. In our case, substitutes were more likely for middle-aged, highly educated people who were active users of the Baltic Sea, and less likely for those who lived further away from the sea and engaged in activities with direct water contact. These explanatory factors could guide the analyst-driven determination of substitutes. As the results are likely case-specific, further research is needed on how people perceive the existence of substitutes in different contexts.
The results of the travel cost models showed that the existence of perceived substitute sites decreased the number of current recreational trips to the Baltic Sea in Germany and Finland but increased them in Latvia. The diverging results across the countries may partly be explained by the varying degree of substitution between the Baltic Sea and its substitute destinations among respondents (Lo Citation1991; De Valck et al. Citation2016). From the survey responses, we know where the respondents would go if the environmental conditions at the Baltic Sea deteriorated. This formulation allows respondents to indicate various types of locations with varying degree of substitution that are currently or could be in the future visited. Although the degree of substitution cannot be explicitly examined with our data, it provides a useful framework for reflecting the results and offers potential explanations. The issue of whether the self-reported substitutes are current or potential future substitutes can potentially be inferred by comparing the distances to the Baltic Sea and substitute sites in the data.
If a substitute site is a perfect substitute to the Baltic Sea site, its existence may reduce the number of current visits made to the Baltic Sea, since some part of an individual’s recreational visits are likely directed to a destination that offers a similar recreational experience with similar costs as the Baltic Sea. This could be the case for Germany, where the distances to the Baltic Sea and substitute sites are similar, and the existence of a substitute reduces the number of current visits. If the travel costs to a substitute destination are higher than to the Baltic Sea and/or the destination is less attractive, its existence might not affect the number of current visits to the Baltic Sea as it would be visited only if visits to the Baltic Sea were not possible. These sites could mainly be future substitutes that would be visited when the environmental conditions of the Baltic Sea site deteriorate. This could be the case in Finland, where the distance to the substitute is often longer than to the Baltic Sea site. For Finland, there was some but no consistent evidence (one model out of two) of the substitute decreasing the number of current visits to the Baltic Sea.
In Latvia, the existence of substitute destinations increased the number of visits to the Baltic Sea. While this is unexpected, it could again be explained by the degree of substitution (Lo Citation1991), as the so-called substitute sites identified by the Latvian respondents could actually be complements to the Baltic Sea sites, and thereby having another destination could increase the demand for Baltic Sea recreation. It is possible that those who reported substitute sites are particularly interested and active in nature recreation, and that is reflected both in their awareness of alternative recreational areas for the Baltic Sea and in higher number of trips made to the sea (Amoako-Tuffour and Martínez-Espiñeira Citation2012). Alternatively, this could be related to multi-purpose trips. According to Lo (Citation1991), when multiple destinations are visited during the same trip and these destinations are complements, the existence of a substitute destination could increase the visits to the Baltic Sea. Furthermore, as noted by De Valck et al. (Citation2016), the existence of substitute sites and their degree of substitution are often influenced by individual’s perceptions, knowledge and experiences with the destinations. These could vary across countries. A more detailed study of individuals’ perceptions of the substitutes would be needed to explore further which destinations people perceive as substitutes for Baltic Sea and why, and how they divide their trips among these.
In Finland and Latvia, individuals who indicated that they had a substitute for Baltic Sea recreation were more sensitive to an increase in travel costs than those who had no substitutes. This is expected, as when travel costs increase, people who have substitutes should change their recreational site to a substitute site. However, in Germany individuals who had substitute sites were less sensitive to an increase in the travel costs, meaning that an increase in the travel costs has a smaller impact on the number of trips for individuals who have substitute sites than for those with no substitutes. A possible explanation could be that for the people who have substitutes, the Baltic Sea represents a special recreation site that is visited only occasionally and for which the travel costs bear less importance in visiting decisions.
Despite the finding that those having substitutes were less sensitive to travel costs in Germany, the effect of having a substitute site on the recreational value of the Baltic Sea corresponds to the expectations in Finland and Germany: the annual consumer surplus from Baltic Sea recreation is lower for those who have substitute sites than for those who do not, as the existence or perceived substitutes decreases the number of visits to the sea. In Latvia, the positive impact of the existence of substitute sites shows also in the welfare estimates, and those who have substitutes derive higher value from Baltic Sea recreation annually, in particular when the interaction of the travel cost to the existence of a substitute is not included in the model.
The consumer surplus estimates per visit derived from the travel cost models were around €83 in Germany, €80 in Finland and €67 in Latvia. Czajkowski et al. (Citation2015) obtained somewhat lower results Baltic Sea recreation: €31 for Germany, €81 for Finland and €28 for Latvia, but their travel costs were based on distances and motoring costs rather than stated travel costs and included the opportunity cost of time. Bertram et al. (Citation2020) reported consumer surplus estimates that are clearly higher than ours for Germany and Finland: €419 per visit for Germany, €366 for Finland, and €65 for Latvia. One reason for the difference might be that Bertram et al. (Citation2020) applied the combined travel cost – contingent behaviour approach that considers both actual trips made in the past and intended future trips under multiple hypothetical water quality scenarios. For the travel costs, Bertram et al. (Citation2020) used the same approach as Czajkowski et al. (Citation2015) and defined the travel costs based on calculated travel costs and the opportunity cost of time.
Our analysis on substitutes was based on a dummy variable for the existence of substitutes and a travel cost-substitute interaction variable. This approach was preferred to using the travel costs to substitute sites in modelling, as we had no information on reported travel costs to substitute sites. Further, the use of substitute travel costs would have resulted in having to omit the direct impact of the existence of substitute sites on the demand curve from the analysis. Note that we have no data on the substitution patterns of those who had not visited the Baltic Sea within the last three years, and their behaviour and perceptions could differ from the sample under analysis.
As our focus was on examining substitutes for Baltic Sea recreation, the substitute question was formulated to indicate that the environmental conditions would deteriorate in the entire coast and respondents would have to think going to somewhere else than the Baltic Sea. The assumptions that the quality would worsen in the entire sea area is debatable, as the environmental conditions vary across the Baltic Sea region.
The approach of allowing respondents to define the substitute sites themselves partly solved the problem of determining the relevant substitute sites. Map-based questions appear to be a reasonable method for identifying potential substitutes, but further development of the questions is required to avoid non-responses. Map-based questions together with GIS data revealed the characteristics of substitute sites in our study. Future research could possibly use this information on the location and features of substitute sites to define choice sets in random utility travel cost modelling. Further research on the characteristics of the potential substitute sites and their degree of substitution (perfect substitutes - perfect complements) to the Baltic Sea sites would provide additional insights into understanding the substitution patterns of recreation areas with unique or iconic characteristics.
Acknowledgements
This work resulted from the data collected in the BONUS BALTICAPP project. The work was supported by BONUS (Art 185), funded jointly by the EU, the Academy of Finland and the Federal Ministry of Education and Research in Germany.
Disclosure statement
No potential conflict of interest was reported by the author(s).
Additional information
Funding
Notes
1 A possible explanation for the large share of non-response are technical or cognitive difficulties in answering the map question. There are some indications of this in the open feedback to the survey, as well as education and age explaining the probability of responding to the substitute question (see also footnote 8).
2 This resulted in removing 53 observations (6%) in Germany, 53 observations (4%) in Finland and 54 observations (10%) in Latvia.
3 This assumption was made as neither the map question nor the follow-up was mandatory. There were 312 such respondents.
4 Respondents were specifically asked about substitute sites within their own country (see Appendix A).
5 The stated travel costs are in PPP-adjusted EUR.
6 Models including Euclidean distance from home to the most visited recreation site were also estimated using linear, logistic and categorical transformations, but distance to the site was never significant in the models.
7 The number of observations in the models was 647 in Germany, 879 in Finland and 426 in Latvia (total 1952). Observations were excluded from the models due to the focus on those who had made at least one visit to the Baltic Sea in the last three years, missing data (item non-response) and outlier restriction described in Section 2.2.
8 We examined potential sample selection in responding to the substitute question by estimating a probit-Poisson sample selection model for those defined as users of the Baltic Sea, using the pooled data. In the selection model, the level of education (+), importance of recreation (+) and age (-) had a significant effect on the probability of replying to the substitute question. However, the results of the outcome model were similar to the negative binomial model (Model 3), and the coefficient was positive also in the sample selection model.
9 To evaluate the robustness of the results for alternative assumptions, we estimated the negative binomial models with a dependent variable where one trip in three years was rounded to 1 instead of 0. This increased the number of observations by 84 in Germany, 32 in Finland and 40 in Latvia. The coefficients, signs and significance of the variables were similar, and thus the results are robust to the assumption made when rounding the number of visits.
References
- Ahtiainen, H., J. Artell, M. Czajkowski, B. Hasler, L. Hasselström, K. Hyytiäinen, … H. Tuhkanen. 2013. “Public Preferences Regarding use and Condition of the Baltic Sea—An International Comparison Informing Marine Policy.” Marine Policy 42: 20–30.
- Ahtiainen, H., E. Liski, E. Pouta, K. Soini, C. Bertram, K. Rehdanz, … J. Meyerhof. 2019. “Cultural Ecosystem Services Provided by the Baltic Sea Marine Environment.” Ambio 48 (11): 1350–1361.
- Akron, A., A. Ghermandi, T. Dayan, and Y. Hershkovitz. 2017. “Interbasin Water Transfer for the Rehabilitation of a Transboundary Mediterranean Stream: An Economic Analysis.” Journal of Environmental Management 202: 276–286.
- Alves, B., R. Ballester, R. Rigall-I-Torrent, Ó Ferreira, and J. Benavente. 2017. “How Feasible is Coastal Management? A Social Benefit Analysis of a Coastal Destination in SW Spain.” Tourism Management 60: 188–200.
- Amoako-Tuffour, J., and R. Martínez-Espiñeira. 2012. “Leisure and the net Opportunity Cost of Travel Time in Recreation Demand Analysis: An Application to Gros Morne National Park.” Journal of Applied Economics 15 (1): 25–49.
- Artell, J., H. Ahtiainen, and E. Pouta. 2019. “Distance Decay and Regional Statistics in International Benefit Transfer.” Ecological Economics 164: 106383.
- Bertram, C., H. Ahtiainen, J. Meyerhoff, K. Pakalniete, E. Pouta, and K. Rehdanz. 2020. “Contingent Behavior and Asymmetric Preferences for Baltic Sea Coastal Recreation.” Environmental and Resource Economics 75 (1): 49–78.
- Bhat, M. G. 2003. “Application of non-Market Valuation to the Florida Keys Marine Reserve Management.” Journal of Environmental Management 67 (4): 315–325.
- Blaine, T. W., F. R. Lichtkoppler, T. J. Bader, T. J. Hartman, and J. E. Lucente. 2015. “An Examination of Sources of Sensitivity of Consumer Surplus Estimates in Travel Cost Models.” Journal of Environmental Management 151: 427–436.
- Bowker, J. M., D. B. English, and J. A. Donovan. 1996. “Toward a Value for Guided Rafting on Southern Rivers.” Journal of Agricultural and Applied Economics 28 (2): 423–432.
- Boyer, T. A., R. T. Melstrom, and L. D. Sanders. 2017. “Effects of Climate Variation and Water Levels on Reservoir Recreation.” Lake and Reservoir Management 33 (3): 223–233.
- Central Statistical Bureau of Latvia. 2018. Statistics in Brief 2018. May 22. https://www.csb.gov.lv/en/statistics/statistics-by-theme/economy/gdp/search-in-theme/298-latvia-statistics-brief-2018.
- Czajkowski, M., H. Ahtiainen, J. Artell, W. Budziński, B. Hasler, L. Hasselström, J. Meyerhoff, T. Nõmmann, D. Semeniene, and T. Söderqvist. 2015. “Valuing the Commons: An International Study on the Recreational Benefits of the Baltic Sea.” Journal of Environmental Management 156: 209–217.
- Czajkowski, M., M. Zandersen, U. Aslam, I. Angelidis, T. Becker, W. Budziński, and K. Zagórska. 2020. Recreational Value of the Baltic Sea: A Spatially Explicit Site Choice Model Accounting for Environmental Conditions. Working papers 2018-11, Faculty of Economic Sciences, University of Warsaw. Accessed 30 April 2021. https://ideas.repec. org/p/war/wpaper/2018-11. Html.
- De Valck, J., S. Broekx, I. Liekens, J. Aertsens, and L. Vranken. 2017. “Testing the Influence of Substitute Sites in Nature Valuation by Using Spatial Discounting Factors.” Environmental and Resource Economics 66 (1): 17–43.
- De Valck, J., S. Broekx, I. Liekens, L. De Nocker, J. Van Orshoven, and L. Vranken. 2016. “Contrasting Collective Preferences for Outdoor Recreation and Substitutability of Nature Areas Using hot Spot Mapping.” Landscape and Urban Planning 151: 64–78.
- De Valck, J., and J. Rolfe. 2018. “Spatial Heterogeneity in Stated Preference Valuation: Status, Challenges and Road Ahead.” International Review of Environmental and Resource Economics 11 (4): 355–422.
- DesStatis. 2019. Facts and Figures. Accessed 1 April 2019. https://www.destatis.de/EN/FactsFigures/SocietyState/Population/CurrentPopulation/CurrentPopulation.html.
- Ditton, R. B., and S. G. Sutton. 2004. “Substitutability in Recreational Fishing.” Human Dimensions of Wildlife 9 (2): 87–102.
- EEA (European Environment Agency). 2019a. CORINE Land Cover. European Union, Copernicus Land Monitoring Service European Environment Agency (EEA). [referred: 9.1.2019]. Access method: https://land.copernicus.eu/pan-european/corine-land-cover.
- EEA (European Environment Agency). 2019b. Natura 2000 Data - The European Network of Protected Sites. European Environment Agency (EEA) [referred: 9.1.2019]. Access method: https://land.copernicus.eu/pan-european/corine-land-cover/clc-2012.
- Eurostat. 2017. Purchasing Power Parities (PPPs), Price Level Indices and Real Expenditures for ESA 2010 Aggregates. Eurostat Database. http://appsso.eurostat.ec.europa.eu/nui/show.do?dataset=prc_ppp_ind&lang=en. Last updated 29 June 2017, accessed 5 October 2017.
- Eurostat. 2018a. Average Household Size – EU-SILC survey. Accessed 28 June 2018. http://appsso.eurostat.ec.europa.eu/nui/show.do?dataset=ilc_lvph01&lang=en.
- Eurostat. 2018b. Mean and Median Income by Age and Sex – EU-SILC Survey. Accessed 28 June 2018. http://appsso.eurostat.ec.europa.eu/nui/show.do?dataset=ilc_di03&lang=en.
- Eurostat. 2018c. Women per 100 Men. Accessed 28 June 2018. http://ec.europa.eu/eurostat/tgm/table.do;jsessionid=Uo9FXJFv9XEl3q0mODiKXhBxoIjqAM85KaGH3KRNc3AuwZfkIBiI!−1072380108?tab=table&plugin=1&language=en&pcode=tps00011.
- Eurostat. 2018d. Population Grids. Accessed 18 April 2019. https://ec.europa.eu/eurostat/statistics-explained/index.php/Population_grids#Grid_statistics.
- Flanders Marine Institute. 2019. Maritime Boundaries Geodatabase: Maritime Boundaries and Exclusive Economic Zones (200NM). version 10. [referred: 9.1.2019]. Access method: http://www.marineregions.org/.
- FreemanIII, A. M., J. A. Herriges, and C. L. Kling. 2014. The Measurement of Environmental and Resource Values: Theory and Methods. Routledge.
- Ghermandi, A. 2015. “Benefits of Coastal Recreation in Europe: Identifying Trade-Offs and Priority Regions for Sustainable Management.” Journal of Environmental Management 152: 218–229.
- Glenk, K., R. J. Johnston, J. Meyerhoff, and J. Sagebiel. 2020. “Spatial Dimensions of Stated Preference Valuation in Environmental and Resource Economics: Methods, Trends and Challenges.” Environmental and Resource Economics 75 (2): 215–242.
- Greene, W. H. 2007. Econometric Analysis. 6th Edition. Upper Saddle River, NJ: Prentice Hall.
- Haab, T. C., and K. E. McConnell. 2005. Valuing Environmental and Natural Resources: The Econometrics of Non-Market Valuation. Edward Elgar Publishing.
- Han, J. H., E. J. Noh, and C. O. Oh. 2015. “Applying the Concept of Site Substitution to Coastal Tourism.” Tourism Geographies 17 (3): 370–384.
- Hanauer, M. M., and J. Reid. 2017. “Valuing Urban Open Space Using the Travel-Cost Method and the Implications of Measurement Error.” Journal of Environmental Management 198: 50–65.
- HELCOM. 2018. State of the Baltic Sea – Second HELCOM Holistic Assessment 2011–2016. Baltic Sea Environment Proceedings 155. http://www.helcom.fi/baltic-sea-trends/holistic-assessments/state-of-the-baltic-sea-2018/reports-and-materials/.
- Hellerstein, D. M. 1991. “Using Count Data Models in Travel Cost Analysis with Aggregate Data.” American Journal of Agricultural Economics 73 (3): 860–866.
- Hilbe, J. M. 2011. Negative Binomial Regression. Cambridge University Press.
- Hosmer Jr, D. W., S. Lemeshow, and R. X. Sturdivant. 2013. Applied Logistic Regression. John Wiley & Sons.
- Huhtala, A., and T. Lankia. 2012. “Valuation of Trips to Second Homes: Do Environmental Attributes Matter?” Journal of Environmental Planning and Management 55 (6): 733–752.
- Hynes, S., R. Gaeven, and P. O'Reilly. 2017. “Estimating a Total Demand Function for sea Angling Pursuits.” Ecological Economics 134: 73–81.
- Lankia, T., M. Neuvonen, and E. Pouta. 2019. “Effects of Water Quality Changes on the Recreation Benefits of Swimming in Finland: Combined Travel Cost and Contingent Behavior Model.” Water Resources and Economics 25: 2–12.
- Liston-Heyes, C., and A. Heyes. 1999. “Recreational Benefits from the Dartmoor National Park.” Journal of Environmental Management 55 (2): 69–80.
- Lo, L. 1991. “Substitutability, Spatial Structure, and Spatial Interaction.” Geographical Analysis 23 (2): 132–146.
- Loomis, J. 2003. “Travel Cost Demand Model Based River Recreation Benefit Estimates with on-Site and Household Surveys: Comparative Results and a Correction Procedure.” Water Resources Research 39 (4).
- Loomis, J., A. Gonzalez-Caban, and J. Englin. 2001. “Testing for Differential Effects of Forest Fires on Hiking and Mountain Biking Demand and Benefits.” Journal of Agricultural and Resource Economics, 508–522.
- Lupi, F., D. J. Phaneuf, and R. H. von Haefen. 2020. “Best Practices for Implementing Recreation Demand Models.” Review of Environmental Economics and Policy 14 (2): 302–323.
- OECD. 2017. Population with Tertiary Education (Indicator). Accessed 28 June 2018. doi:.
- Official of Finland. 2019. Population Structure [e-publication]. ISSN = 1797-5379. Helsinki: Statistics Finland. Accessed 9 January 2019. http://www.stat.fi/til/vaerak/index.html.
- Oh, C. O., S. G. Sutton, and M. G. Sorice. 2013. “Assessing the Role of Recreation Specialization in Fishing Site Substitution.” Leisure Sciences 35 (3): 256–272.
- Ovaskainen, V., M. Neuvonen, and E. Pouta. 2012. “Modelling Recreation Demand with Respondent-Reported Driving Cost and Stated Cost of Travel Time: A Finnish Case.” Journal of Forest Economics 18 (4): 303–317.
- Parsons, G. R. 2003. “The Travel Cost Model.” In A Primer on Nonmarket Valuation, 269–329. Dordrecht: Springer.
- Parsons, G. R., A. J. Plantinga, and K. J. Boyle. 2000. “Narrow Choice Sets in a Random Utility Model of Recreation Demand.” Land Economics, 86–99.
- Prayaga, P. 2017. “Estimating the Value of Beach Recreation for Locals in the Great Barrier Reef Marine Park, Australia.” Economic Analysis and Policy 53: 9–18.
- Reynaud, A., and D. Lanzanova. 2017. “A Global Meta-Analysis of the Value of Ecosystem Services Provided by Lakes.” Ecological Economics 137: 184–194.
- Rolfe, J., and J. Windle. 2012. “Distance Decay Functions for Iconic Assets: Assessing National Values to Protect the Health of the Great Barrier Reef in Australia.” Environmental and Resource Economics 53 (3): 347–365.
- Rosenthal, D. H. 1987. “The Necessity for Substitute Prices Recreation Demand Analyses.” American Journal of Agricultural Economics 69 (4): 828–837.
- Sagebiel, J., C. Schwartz, M. Rhozyel, S. Rajmis, and J. Hirschfeld. 2016. “Economic Valuation of Baltic Marine Ecosystem Services: Blind Spots and Limited Consistency.” ICES Journal of Marine Science 73 (4): 991–1003.
- Sandström, M. 1996. “Recreational Benefits from Improved Water Quality: A Random Utility Model of Swedish Seaside Recreation.” Stockholm School of Economics.
- Schaafsma, M. 2010. Spatial Effects in Stated Preference Studies for Environmental Valuation. PhD thesis, VU University Amsterdam.
- Schaafsma, M., and R. Brouwer. 2020. “Substitution Effects in Spatial Discrete Choice Experiments.” Environmental and Resource Economics 75 (2): 323–349.
- Shrestha, R. K., and J. B. Loomis. 2001. “Testing a Meta-Analysis Model for Benefit Transfer in International Outdoor Recreation.” Ecological Economics 39 (1): 67–83.
- Shrestha, R. K., T. V. Stein, and J. Clark. 2007. “Valuing Nature-Based Recreation in Public Natural Areas of the Apalachicola River Region, Florida.” Journal of Environmental Management 85 (4): 977–985.
- Soutukorva, Å. 2001. “The Value of Improved Water Quality: A Random Utility Model of Recreation in the Stockholm Archipelago.” Beijer discussion paper series No. 135, Beijer Intemational Institute of Ecological Economics, The Royal Swedish Academy of Sciences, Stockholm.
- Spencer-Cotton, A., M. Kragt, and M. Burton. 2018. “Spatial and Scope Effects: Valuations of Coastal Management Practices.” Journal of Agricultural Economics 69 (3): 833–851.
- Sutton, S. G., and R. B. Ditton. 2005. “The Substitutability of one Type of Fishing for Another.” North American Journal of Fisheries Management 25 (2): 536–546.
- Sutton, S. G., and C. O. Oh. 2015. “How do Recreationists Make Activity Substitution Decisions? A Case of Recreational Fishing.” Leisure Sciences 37 (4): 332–353.
- Tukey, J. W. 1977. Exploratory Data Analysis. UK, Reading: Addison-Wesley Publishing Company Inc.
- Vesterinen, J., E. Pouta, A. Huhtala, and M. Neuvonen. 2010. “Impacts of Changes in Water Quality on Recreation Behavior and Benefits in Finland.” Journal of Environmental Management 91 (4): 984–994.
- Winkelmann, R. 2008. Econometric Analysis of Count Data. Springer Science & Business Media.
- Zhang, F., X. H. Wang, P. A. Nunes, and C. Ma. 2015. “The Recreational Value of Gold Coast Beaches, Australia: An Application of the Travel Cost Method.” Ecosystem Services 11: 106–114.