
ABSTRACT
Mast cell lipid bodies are key to initiation, maintenance and resolution of inflammatory responses in tissue. Mast cell lines, primary bone marrow-derived mast cells and peripheral blood basophils present a ‘steatotic’ phenotype in response to chronic insulin exposure, where cells become loaded with lipid bodies. Here we show this state is associated with reduced histamine release, but increased capacity to release bioactive lipids. We describe the overall lipid phenotype of mast cells in this insulin-induced steatotic state and the consequences for critical cellular lipid classes involved in stages of inflammation. We show significant insulin-induced shifts in specific lipid classes, especially arachidonic acid derivatives, MUFA and PUFA, the EPA/DHA ratio, and in cardiolipins, especially those conjugated to certain DHA and EPAs. Functionally, insulin exposure markedly alters the FcεRI-induced release of Series 4 leukotriene LTC4, Series 2 prostaglandin PGD2, Resolvin-D1, Resolvin-D2 and Resolvin-1, reflecting the expanded precursor pools and impact on both the pro-inflammation and pro-resolution bioactive lipids that are released during mast cell activation. Chronic hyperinsulinemia is a feature of obesity and progression to Type 2 Diabetes, these data suggest that mast cell release of key lipid mediators is altered in patients with metabolic syndrome.
Introduction
Metabolic syndrome is associated with a chronic state of hyperinsulinemia, prior to the onset of Type 2 Diabetes mellitus [Citation1,Citation2]. Chronic insulin elevation has functional consequences for numerous cells, tissues and organs in the body, including those of the immune system [Citation3–Citation5]. We have previously shown that chronic insulin elevation alters mast cell functional phenotypes in vitro, and there is in vivo and clinical evidence that altered levels of insulin affect the outcomes of allergic and anaphylactic inflammatory responses [Citation6–Citation9]. Chronic insulin exposure quantitatively alters the lipid content of mast cells, causes a steatosis-like accumulation of lipid bodies similar to that observed in neutrophils and macrophages under conditions of infection. However, qualitative changes in the cellular profiles of bioactive lipids and their precursors have not been extensively explored. This is an important question arising from the marked effects that lipid remodelling has upon the net pro-and anti-inflammatory capacity of cells such as mast cells [Citation10–Citation14].
Most lipid mediators that been shown to regulate inflammation are derived from omega-6 (n-6) or omega-3 (n-3) fatty acids [Citation10,Citation14–Citation16]. These mediators include arachidonic acid (AA; 20:4n-6), linoleic acid (LA; 18:2n-6), eicosapentaenoic acid (EPA; 20:5n-3), and docosahexaenoic acid (DHA; 22:6n-3). Oxidation catalyzed by cyclooxygenases, lipoxygenases, or cytochrome P450 forms the bioactive metabolite from these precursors. Acute changes in cellular status have been shown to remodel key lipid populations in mast cells and other immune cells, changing the outcome of mast cell activation and in some cases switching the cell between a pro-inflammation and a pro-resolution phenotype [Citation7,Citation16–Citation20].
Several studies have evaluated the location of the bioactive lipid precursor AA in mast cells, evaluating distribution between membrane phospholipid (phosphatidylcholine (PC), phosphatidylethanolamine (PE) and phosphatidylserine (PS)) and free fatty acid (FFA) forms of AA. The distribution within these pools changes in response to mast cell activation in response to both calcium ionophore and FcεRI stimulation [Citation19,Citation21,Citation22]. These changes are functionally important as the location of the AA changes its proximity and availability to phospholipases that are concomitantly activated and catalyse pathways leading to synthesis of prostaglandins, leukotrienes, thromboxanes, HETEs, resolvins and endocannabinoids [Citation13,Citation23,Citation24]. Similarly, functional importance is ascribed to the ratios between omega-3 and omega-6-fatty acids and the abundance of DHA and EPA pools. These are precursors for inflammation resolving factors (protectins, resolvins, and maresins). Since n-6 and n-3 fatty acids are generally regarded as pro-inflammatory, and anti-inflammatory, respectively, the cellular abundance of these forms in mast cells has consequences for tissue inflammatory responses [Citation25,Citation26].
In the context of metabolic syndrome and obesity, lipid remodelling has been studied in adipose tissue and adipocytes [Citation20]. In addition to the formation and storage of large lipid droplets, adipose depot expansion and increased infiltration of pro-inflammatory cells such as macrophages, obesity is also linked to qualitative changes in adipocyte lipid content. In particular, switching towards a more pro-inflammatory lipid profile (increased ratio of poly-unsaturated fatty acids (PUFA) to mono-unsaturated fatty acids (MUFA), altered ratio of DHA and EPA, altered AA levels. In addition, infiltrating macrophages remodel their lipid precursor pools when in obese adipose tissue contexts. However, the effect of an altered metabolic/glycemic environment upon mast cell lipid profiles has not been studied.
In prior studies we have shown that chronic insulin exposure is associated with elevated lipid body numbers, overall increases in cellular lipid content and elevated leukotriene C4 (LTC4) production in model mast cells [Citation6–Citation9,Citation27]. In the current study, we use a similar model system in which a mucosal mast cell-like line is exposed to elevated insulin over a chronic time period. Our data suggest remodelling of the mast cell lipidome and altered functional release of bioactive lipids in response to chronic insulin elevations.
Materials and methods
Cell culture
RBL2H3 [Citation28] (ATCC CRL-2256) were grown at 37°C in a 5% CO2/95% air incubator maintained at 95% humidity. Cells were maintained in Dulbecco’s Modification of Eagle Medium (Mediatech Inc., Herndon, VA) with 10% heat-inactivated fetal bovine serum (FBS, Mediatech) and 2 mM glutamine. Lipid body accumulation was induced by incubating RBL2H3 in 1–10 μg/ml insulin alone where indicated or with 0.25 μM dexamethasone and 0.25 μM isobutylmethylxanthine in the presence of 10% FBS for 2 or 6 d at 37°C, beginning 24 h after seeding.
Chemicals, reagents, and stimulants
General chemicals include LipidTOX Red Neutral Lipid Stain Reagent (LipidTox-NR, H34476), 10-nonyl bromide acridine orange (NAO, A-1372), from Molecular Probes (Eugene, OR), 4′,6-diamidino-2-phenylindole (DAPI), Oil Red O (ORO) from EMD (Gibbstown, NJ).
Functional assays
Resolvin, leukotriene and prostaglandin assays were purchased from Cayman Chemical (Ann Arbor, MI). Assays were developed according to the manufacturer’s instructions, using cell pellets or supernatants derived from 2.5 million RBL2H3 per assay point, performed in triplicate. Mast cell degranulation was assayed as follows: RBL2H3 were plated in cluster plates at 5 × 10 [Citation4] cells/well. Monolayers were washed and incubated in 200 µl Tyrode’s buffer before stimulating as described. After 45 min at 37°C, 25 µl supernatant was removed, clarified by microcentrifugation, and transferred to a 96 well plate containing 100 µl per well 1 mM p-N-acetyl glucosamine (Sigma) in 0.05 M citrate buffer pH 4.5. After 1 h at 37°C reactions were quenched by the addition of 100 µl per well 0.2 M glycine, pH 9.0. Beta-hexosaminidase levels were read as OD at 405 nm. Results are shown as the mean ± standard deviation.
Staining
RBL2H3 cells were seeded on glass coverslips, fixed with 0.4% (w/v) paraformaldehyde (1 h, room temperature [RT]), washed twice with 1X PBS (Phosphate Buffer Saline) and stained with various lipid dyes. Staining with Oil Red O (0.35% in 6:4 EtOH:water, 15 min, RT), DAPI (2.5 μM, 5 min), NAO (200 nM, 1 h), LipidTox-NR (4 μM, 30 min).
Imaging
Bright field and fluorescence imaging of cells in MatTek dishes (50,000 cells per cm2) were performed on a Nikon Ti Eclipse C1 epi-fluorescence and confocal microscopy system, equipped with heated stage. Available laser lines in FITC, TxRed and Cy5 were supplied by a 488 nm 10 mW solid-state laser, a 561 nm 10 mW diode pump solid state laser and a 638 nm 10 mW modulated diode laser. Z stack size was 15 microns. Each z disc (optical section) was 150 nm. Pinhole size for all images was 60 microns. Images were analysed in NIS Elements (Nikon, Melville, NY).
Lipidomic analysis
The lipids were extracted by the method of Folch et al. using chloroform:methanol (2:1 v/v). For the separation of neutral lipid classes (FFA, triacyl glycerols (TAG), diacylglycerol (DAG), free cholesterol (FC), cholesterol ethers (CE)), a solvent system consisting of petroleum ether/diethyl ether/acetic acid (80:20:1, by vol) was employed. Individual phospholipid classes within each extract are separated by liquid chromatography (Agilent Technologies model 1100 Series). Each lipid class is transesterified in 1% sulfuric acid in methanol in a sealed vial under a nitrogen atmosphere at 100°C for 45 min. The resulting fatty acid methyl esters are extracted from the mixture with hexane containing 0.05% butylated hydroxytoluene and prepared for gas chromatography by sealing the hexane extracts under nitrogen. Fatty acid methyl esters are separated and quantified by capillary gas chromatography (Agilent Technologies model 6890) equipped with a 30 m DB 88 capillary column (Agilent Technologies) and a flame ionization detector. Whole cell lipidomic analysis was performed in collaboration with Metabolon, Inc.
Lysis and western blot
Cells were pelleted (2000 x g, 2 min) and washed once in ice-cold PBS. For total lysates, 1 × 10⁷ cells were lysed (ice, 30 min) in 350 μl lysis buffer (50 mM HEPES [pH 7.4], 250 mM NaCl, 20 mM NaF, 10 mM iodoacetamide, 0.5% (w/v) Triton X-100, 1 mM phenylmethyl-sulphonylfluoride, 500 mg aprotinin/ml, 1.0 mg leupeptin/ml and 2.0 mg chymostatin/ml). Lysates were clarified (17,000 x g, 20 min). For preparation of total protein, lysates were acetone precipitated (1.4 vol acetone for 1 h at −20°C, followed by 10,000 x g for 5 min). Protein samples were resolved by 10% SDS-PAGE under reducing conditions. Resolved proteins were electrotransferred to PVDF membranes in 192 mM glycine/25 mM Tris (pH 8.8) solutions. For Western blotting, membranes were blocked using 5% non-fat milk in PBS for 1 h at RT. Primary antibodies were dissolved in PBS/0.05% Tween-20/0.05% NaN3 and incubated with the membranes for 16 h at 4°C. After washing the membranes four times with PBS/0.1% Tween-20 (5 min/wash), developing antibodies (anti-rabbit or anti-mouse IgGs conjugated to horseradish peroxidase diluted to 0.1 μg/ml in PBS/0.05% Tween-20; Amersham) were placed with the membranes for 45 min at RT. Washes were then performed again, and the adherent secondary antibody then visualized using enhanced chemiluminescence solution (Amersham) and exposure of the membrane to BioMax film (Kodak, Rochester, NY). Films were then scanned at >600 dpi, and quantification of the band intensities performed using Image J (NIH, Bethesda, MD).
Mitochondrial staining
Mitotracker (Molecular Probes) was used at 1μM for 15 min at 37°C.
Statistical analysis
Results are shown as mean ± SD or standard error. Statistical significance was determined based on analysis of variance (ANOVA; GraphPad Prism 6 v6.02; San Diego, CA). Adjacent to datapoints in the respective graphs, significant differences were recorded as *p < 0.05, **p < 0.01, or ***p < 0.001. Data shown are all based on an n of at least three experiments.
Results
Chronic insulin exposure results in lipid body accumulation in RBL2H3
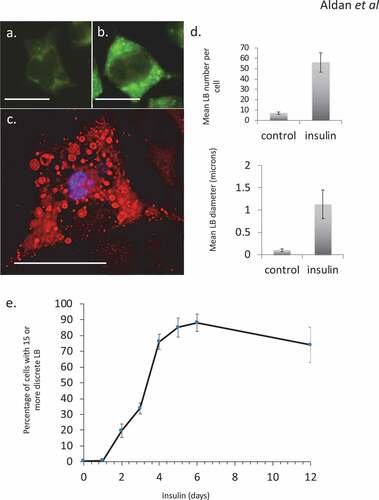
Hyper-insulinemia was mimicked in vitro using chronic exposure to elevated insulin levels. Hyper-insulinemia in either escalated dose schedules (not shown) or single-sustained doses resulted in an altered phenotype in RBL2H3. As we have previously described, this phenotype includes the steatotic accumulation of lipid bodies [Citation18,Citation29,Citation30] (–), associated with overall gains in lipid content. In the populations of cells used here, at least 80% of the cells were confirmed (by Oil Red O staining and microscopy) to have gained significant lipid body accumulation and exhibit a ‘steatotic’ staining pattern by the 6-d insulin exposure timepoint ()). These data are consistent with both our prior studies and observations from adipocyte and immunocytes systems that see lipid body accumulation and overall gains in lipid content in response to insulin, nutrient excess and infection, respectively [Citation6–Citation9,Citation31–Citation33].
Figure 1. Steatosis in RBL2H3 induced by Insulin. (a–c). RBL2H3 control (a) or 6 day insulin-stimulated (b, c) stained with either LipidTox Green (488nm, A, B) or Oil Red O (c) and imaged using confocal microscopy. Scale bar is 10 microns. (d). Upper panel. Mean discrete lipid bodies per cell counted using thresholded Region of Interest (ROI) analysis (Nikon NIS Elements) across 100 control and 100 6 d insulin treated cells. Lower panel. Average LB diameter (in microns) measured for each LB. (e). Time course of lipid body formation in RBL2H3 in response to insulin treatment.
Comparison of fatty acid profiles in major lipid classes between control and insulin-treated cells
We used a lipidomic approach to obtain an overview of the fatty acid profile of nine major lipid classes in insulin-treated and control RBL2H3. ) presents a profile of percentage changes in individual fatty acid levels across nine major lipid classes (cholesterol ethers (CE), (DAG), free fatty acids (FFA), (TAG), cardiolipins (CL), lysophosphatidylcholine (LysoPC), (PC), (PE) and (PS)). The analysis included saturated fatty acids (14:0, 16:0, 18:0. 20:0 and 22:0), single-unsaturated fatty acids (14:1n5, 16:1n7, 18:1n7, 18:1n9, 20:1n9 and 22:1n9), Omega-3 (n-3) fatty acids (18:3n3, 18:4n3, 20:3n3, 20:4n3, 20:5n3, 22:5n3, 22:6n3) and Omega-6 (n-6) fatty acids (18:2n6, 18:3n6, 20:2n6, 20:3n6, 20:4n6, 22:2n6, 22:4n6, 22:5n6). In this Figure, the size, location and colour of the data points relate to the lipid class (colour) and the degree of change in abundance relative to control samples from non-insulin-treated cells (size of marker and distance from axis). By visual inspection we can see that areas of the most marked fold changes in lipid abundance occur in the CE, DAG, TAG and FFA classes, in lipids of chain length 18–22, unsaturated, and within the n-6 and n-3 fatty acid families. The overall trend is towards gains in lipid abundance. The few areas of downregulation seem concentrated in the saturated and single unsaturated FA species, although marked loss in the DAG form of 22:4n6 (all-cis-7,10,13,16-docosatetraenoic acid) and 18:4 n3 (all-cis-6,9,12,15,-octadecatetraenoic acid), and two n-3 and n-6 forms of cardiolipin are apparent. PC, PS and PE pools are regulated across lipid species, as is the cardiolipin (CL) population. –) shows the proportional representation of each of the indicated lipid class in cells treated with vehicle or 6-d insulin. We note shifts from PC to PE and PS in the phospholipid classes. evaluates saturation trends between control and insulin-treated cells. and ) present absolute (nmol per billion cells) measurements of lipid classes in the indicated levels of saturation. For comparison, and ) present a normalized view of the same changes, allowing us to see proportional expansion or contraction in degrees of saturation for each lipid class. In –) we use the same normalization approach to examine insulin-induced shifts in abundance by individual lipid and by class. These normalized presentations allow us to assess remodelling between lipid classes and within individual lipid species in response to 6-d insulin exposure.
Figure 2. Whole cell lipidome of control and Lipid Body-rich RBL2H3. RBL2H3 were grown for 6d with insulin-FDI. Individual major lipid species were separated by high performance liquid chromatography (HPLC) and fatty acid methyl esters (FAME) from each class were produced and subsequently analyzed by GC/MS. A. Percentage changes in phospholipids, acylglycerols, and free fatty acids as constituents of mast cell lipid bodies. The change is a measure of insulin treated mast cell values minus control cell values divided by the control cell values and multiplied by 100 during the same experimental period. Each color represents a measured species: CE (cholesterol-fatty acid ester), DAG (diacylglycerol), FFA (free fatty acids), TAG (triacylglycerol), CL (cardiolipin), LYPC (lysophosphatidylcholine), PC (phosphatidylcholine), PE (phosphatidylethanolamine), PS (phosphatidylserine). The marker size and position correspond to the percentage change of that lipid, with larger markers and distance from the horizontal axis representing more significant differences between control and insulin-treated samples. B. Proportional representation (by percentage) of lipid classes in control and insulin (6d) treated RBL2H3. C, D. Insulin effects on lipid levels (nmol per billion cells) in the indicated classes. Data are presented on two graphs due to differences in y-axis scaling.
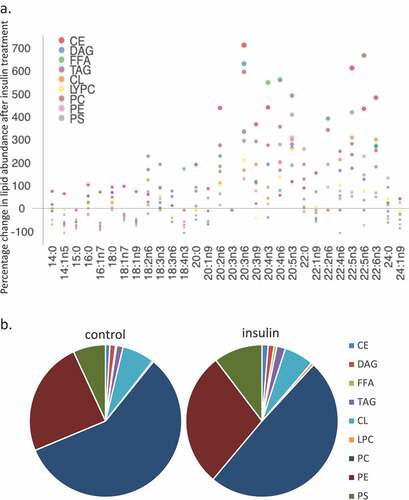
Figure 2. Continued.
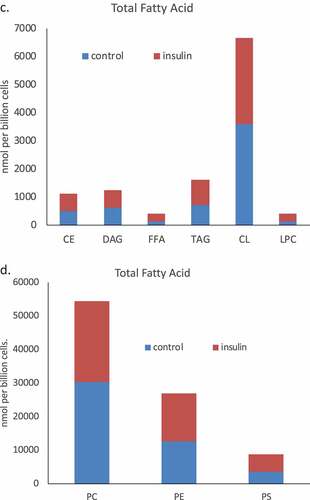
Figure 3. (a–d). Saturation analysis of lipids in RBL2H3 in the absence and presence of chronic insulin exposure. Lipid classes were analysed for the presence of Saturated Fatty Acids (SFA), Mono-unsaturated FA (MUFA), Poly-unsaturated FA (PUFA) and omega n 3, 6, 7, and 9 lipids. Data in A and C present absolute lipid levels (nmol per billion cells). Data in B and D show normalized data to assess proportional representation of SFA, MUFA, etc., in each class in the absence and presence of insulin. Aggregated lipid groups (e.g. PUFA) are shown alongside disaggregated categories (e.g. n3 alone, which is a subset of PUFA). E-M. Normalized (each to 100%) proportion of each lipid species by class in the absence and presence of chronic insulin exposure.
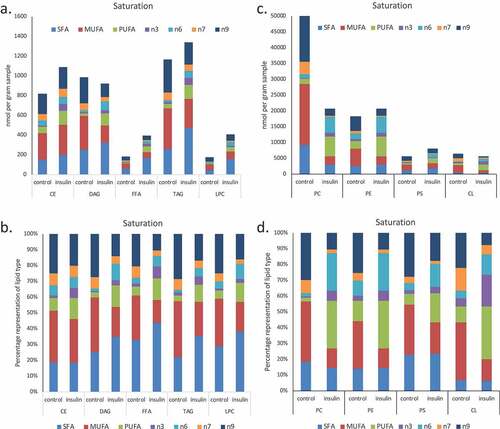
Figure 3. Continued.
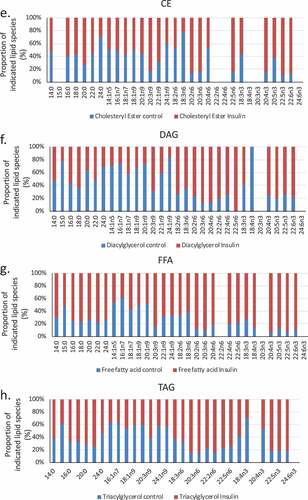
Figure 3. Continued.
Remodelling of AA, DHA and EPA pools in insulin-treated cells
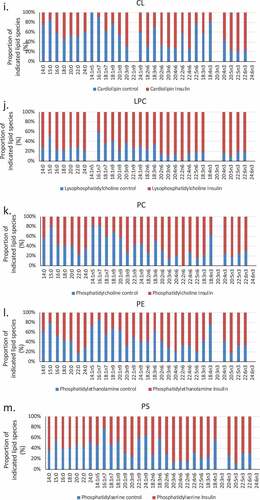
The location of fatty acids within specific lipid pools is of functional significance for the cell. Whether fatty acids such as Arachidonic Acid (AA, 20:4n6), eicosapentenoic acid (EPA, 20:5n3) and Docosahexaenoic acid (DHA, 22:6n3) are in a free fatty acid pool, are esterified onto membrane phospholipids, or are associated with neutral lipid pools changes their ability to be accessed as precursors for the production of bioactive messengers. Organellar locations, for example defined by association with a primarily mitochondrial lipid such as cardiolipin, are also important determinants of lipid availability for signalling and metabolic purposes. We assessed the degree to which insulin-induced remodelling between lipid pools and locations in RBL2H3. –) shows the effect on insulin on the distribution of AA, DHA, and EPA between various pools. We assessed the percentages of the total lipid-associated esterified onto phospholipid, associated with neutral lipid pools, present as free fatty acids or associated with cardiolipin (shown in )). –) shows in absolute quantities, the changes in the total DHA, EPA and AA and the changes in the amount associated with phospholipid (PL), neutral lipid (NL) free fatty acid (FFA) and (CL) pools. ) provides a representation normalized to the totals in each category, allowing us to visualize the proportional remodelling that occurs in each pool. We note that DHA remodels towards CL and away from PL. For EPA and AA the NL pool decreases and PL esterification increases.
Figure 4. EPA, DHA, AA and Cardiolipin pools are remodelled during chronic insulin exposure in RBL2H3. (a). Pie chart overview of proportions (%) of lipids in each category. (b–d). Absolute levels (nmol per billion cells) of DHA, EPA, AA and CL species localized within specific cellular pools (esterified onto phospholipids (PL), in neutral lipid (NL) pools, as Free Fatty Acids (FFA) or as cardiolipins (CL). E. Normalized percentage abundance of each lipid species by pool in the absence and presence of chronic insulin exposure.
Altered functional responses including bioactive lipid release in steatotic mast cells
We extended our previous data by evaluating a range of functional responses in control, 2-d and 6-d insulin-exposed cells. ) tabulates the effects of 2 and 6 d insulin exposure on release of histamine, the Series 4 leukotriene LTC4 and the Series 2 prostaglandin PGD2, Resolvin D1 and Resolvin E1 [Citation17]. ) shows the insulin-induced upregulation of key biosynthetic enzymes in the LTC4 and Resolvin synthesis pathways. ) shows a dose response of the impact of insulin on Resolvin D1 and E1 levels.
Figure 5. Assessment of histamine and bioactive lipid release by RBL2H3 in the absence and presence of chronic insulin. (a). Summary data for histamine, LTC4, PGD2, Resolvin D1 and E1 release by RBL2H3 in response to FcεRI stimulation (IgE anti-DNP followed by 200 ng/ml KLH-DNP) after 6 d treatment with either vehicle or insulin (10 μg/ml). (b). Western blots of lysates prepared from control and 6d insulin cells and probed with antibodies to either 5-lipoxygenase or 15-lipoxygenase, as indicated. AU, arbitrary intensity units from densitometry. (c). Dose response of Resolvin D1 and E1 abundance in RBL2H3 following 6 d treatment with the indicated levels of insulin. Resolvin D1: p values relative to control for insulin doses: 1ng/ml Ins p > 0.05, 10 ng-10,000ng/ml Ins, p < 0.005. Resolvin E1. 1ng/ml Ins p > 0.05, 10 ng-10,000ng/ml Ins, p < 0.005.
Cardiolipin levels and mitochondrial/lipid body complexes are altered in insulin-exposed RBL2H3
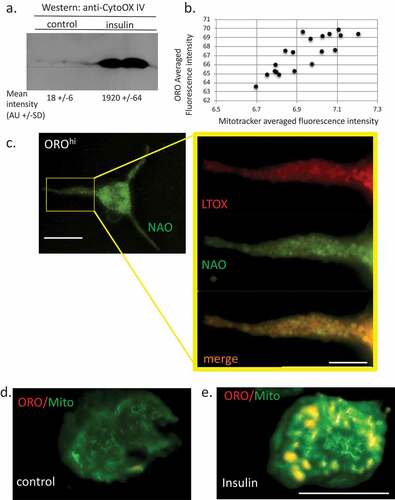
Cardiolipin emerged from our analysis as a highly regulated lipid species following chronic insulin exposure. CL was overall increased in abundance by >3 folds and it follows that AA, DHA, EPA and LA all increased their proportional representation in the CL lipid class. Given the mitochondrial function of CL, we would not have expected this lipid to be highly regulated in cells that were simply enriched in lipid bodies. However, there have been several studies showing that LB and mitochondria are physically interacting [Citation34–Citation36] and that there may be functional interactions between the two. In addition, omega-3 and omega-6 FA-induced remodelling in CL [Citation37]. We asked if this correlated with increased mitochondrial load. ) shows that the mitochondrial marker Cytochrome Oxidase IV is upregulated in insulin-treated cells. Mitochondrial abundance is positively correlated with ORO staining intensity ()). Microscopically, we can image the mitochondrial population under matched conditions in OROloINS− versus OROhiINS+ cells and there is colocalization between both Mitotracker and the CL marker 10-nonyl acridine orange NAO [Citation38] (), Pearson Correlation Coefficient (PCC) for colocalization (Jacop module, Image J) of 0.85) and ORO/Mitotracker (), PCC 0.91) and we observe higher levels of Mitotracker fluorescence in the latter at the single cell level (,)).
Figure 6. Relationship between lipid bodies, mitochondria and cardiolipins in insulin-treated RBL2H3. (a). Western blot analysis of Cytochrome oxidase IV levels in control and 6 d insulin-treated RBL2H3. AU, arbitrary intensity units from densitometry. (b). Correlation between Mitotracker and ORO staining intensities. Scale bar at left is 10 microns, scale bar at right is 2.5 microns. (c). Co-localization of ORO and NAO staining in RBL2H3 treated for 6d with insulin. (d, e). Matched confocal imaging (all parameters equivalent) of the cell bodies of 2 RBL2H3, control (d) or insulin treated for 6 d (e) stained as indicated with ORO and MitoTracker Green. Scale bars are 10 microns.
Discussion
This study characterizes alterations in lipid classes following chronic insulin exposure in a model mast cell line. Our lipidomic evaluation quantified and analyzed 342 distinct lipid molecules consisting of 38 fatty acids in 9 major lipid species. Whole cell lipid extracts from mast cells treated for 6 days with insulin show significant alterations in major lipid species and associated fatty acid composition in respect to fold change and relative abundance. Highly upregulated lipids (by percentage or absolute abundance) include AA, eicosatetraenoic acid (20:4n3), docosapentaenoic acid (22:5n3), docosahexaenoic acid (22:6n3) and di-homo-gamma-linolenic acid (20:3n6). Markedly downregulated lipids (by percentage or absolute abundance) included oleic acid (18:1n9) and palmitoleic acid (16:1n7). We detect significant alterations in the degree of unsaturation in individual fatty acids. Insulin treatment resulted in a significant upregulation of the polyunsaturated fatty acids (PUFAs), specifically the omega-3 and omega-6 PUFAs. PUFAs, in particular the 18–20 carbon long omega-6 PUFAs, constitute the precursor molecules required for AA synthesis. AA is a precursor for production of eicosanoids such as prostaglandins, prostacyclins, thromboxanes and leukotrienes.
We have previously demonstrated that chronic insulin exposure drives the formation of lipid bodies in mast cells, with important collateral effects on mast cell function [Citation39] including a decrease in the intensity of responses such as histamine secretion. In this study, our data suggest that mast cells chronically exposed to insulin in vitro also have marked alterations in their lipidomic landscape. Mast cells have been linked to a variety of pathologies defined by an underlying inflammatory component, and the role of mast cell-derived lipid messengers (leukotrienes, prostaglandins, thromboxanes, etc.) in these pathologies is clear [Citation40]. The physiological roles of mast cells in wound healing, regulation of smooth muscle tone and vasoregulation are also dependent upon these lipid messengers [Citation40,Citation41]. Obesity and type 2 diabetes are also inflammatory diseases, and excess adiposity is associated with adiposopathy, where the adipose itself becomes dysfunctional and inflamed [Citation42]. Mast cells have been implicated in adipose inflammation [Citation43], and mast cell stabilization may change outcomes in metabolic syndrome as well as the status of the adipose [Citation44–Citation47]. The finding that insulin changes mast cell phenotype [Citation6–Citation9] has relevance to the status of adipose-relevant mast cells and the mast cell-derived mediators (cytokines, growth factors and bioactive lipids) that affect adipose health.
There are commonalities and differences between the insulin-induced lipid profile changes in mast cells and those previously observed in the obese liver or adipocyte systems that are steatotic [Citation48–Citation50]. Isolated adipocytes from obese tissue, with expanded lipid droplet numbers, show large increases in PUFA and TAG levels [Citation48]. Similarly, adipose tissue as a whole, and the macrophages isolated from it show increased PUFA levels in the obese setting and elevated TAG [Citation50]. TAG are stored in mast cell LB [Citation11]. Our analysis suggests that under the hyperinsulinaemic conditions modelled in our experiments, mast cells show increases in PUFA but marginal increases overall in TAG. The increase in PUFA that we observe, if translated to the mast cells found in vivo, could provide a new source for the PUFA that are dramatically elevated in adipose tissue.
As described above, we find the largest lipid increases in response to chronic insulin to occur in the polyunsaturated fatty acid class, which are the precursor molecules responsible for synthesizing a variety of pro-inflammatory and pro-thrombotic agents in the mast cell. More specifically, we observe significant upregulations in the particular fatty acids involved in the biosynthetic pathway of AA, including large increases in the AA molecule (20:4n6) itself. We also found (data not shown) remodelling of AA to different membrane phospholipids (PC, PE, PS) that are consistent with prior studies [Citation19,Citation51,Citation52], and which changes their ability to act as precursors for certain mediators. At least under these experimental conditions, these data indicate that in situations of ectopic lipid deposition caused by chronic exposure to insulin, mast cells may be biased to producing the required lipid-derived precursor molecules necessary and sufficient to drive localized and systemic inflammatory responses. These seem to be supported by the functional assays that we performed to look at leukotriene, prostaglandin and resolvins released after FcεRI stimulation of control and steatotic cells [Citation53–Citation55]. The concomitant regulation of both pro-inflammatory and pro-resolution mediators is not paradoxical when we consider the stages of inflammation in a situation such as wound healing [Citation41]. The initial establishment of an inflammatory site is guided by pro-inflammatory mediators but the ‘focus’ of the inflammation shifts over time to resolution and tissue repair. The increase in precursors measured lipidomically here appears to translate to real gains in the amounts of fully formed mediators that are released from the cell with impact on both the pro-inflammation and pro-resolution bioactive phases of processes such as wound healing [Citation41]. Moreover, these gains may change outcomes of inflammation reactions in hyperinsulinemic patients [Citation14].
Acknowledgments
The authors acknowledge the technical contributions of the late Mr. Carl Sung, remembered fondly. This work was funded by the Victoria and Bradley Geist Foundation (Grant #45408), the National Institutes of Health P20MD006084, the National Institutes of Health INBRE 2P20GM103466 and NIH R15DK100978 (all to HT). AJS is funded by NIH COBRE P20GM113134. KMU was funded by The Carlsberg Foundation.
Additional information
Funding
References
- Templeman NM, Skovsø S, Page MM, Lim GE, Johnson JD. A causal role for hyperinsulinemia in obesity. J Endocrinol. 2017 Mar;232:R173–R183.
- Erion KA, Corkey BE. Hyperinsulinemia: a cause of obesity? Curr Obes Rep. 2017;6:178–186.
- McLaughlin T, Ackerman SE, Shen L, et al. Role of innate and adaptive immunity in obesity-associated metabolic disease. J Clin Invest. 2017;127:5–13.
- Patel PS, Buras ED, Balasubramanyam A. The role of the immune system in obesity and insulin resistance. J Obes. 2013;2013:616193.
- Xia C, Rao X, Zhong J. Role of T lymphocytes in type 2 diabetes and diabetes-associated inflammation. J Diabetes Res. 2017;2017:6494795.
- Greineisen WE, Maaetoft-Udsen K, Speck M, et al. Chronic insulin exposure induces ER stress and lipid body accumulation in mast cells at the expense of their secretory degranulation response. PLoS One. 2015;10:e0130198.
- Greineisen WE, Shimoda LM, Maaetoft-Udsen K, et al. Insulin-containing lipogenic stimuli suppress mast cell degranulation potential and up-regulate lipid body biogenesis and eicosanoid secretion in a PPARgamma-independent manner. J Leukoc Biol. 2012;92:653–665.
- Greineisen WE, Speck M, Shimoda LM, et al. Lipid body accumulation alters calcium signaling dynamics in immune cells. Cell Calcium. 2014;56:169–180.
- Jansen C, Speck M, Greineisen WE, Maaetoft-Udsen K, Cordasco E, Shimoda LM, Stokes AJ, Turner H. Transcriptional and Functional Plasticity Induced by Chronic Insulin Exposure in a Mast Cell-Like Basophilic Leukemia Cell Model. J Immunobiol. 2017;2. pii:135.
- Dichlberger A, Kovanen PT, Schneider WJ. Mast cells: from lipid droplets to lipid mediators. Clin Sci (Lond). 2013;125:121–130.
- Dichlberger A, Schlager S, Kovanen PT, et al. Lipid droplets in activated mast cells – a significant source of triglyceride-derived arachidonic acid for eicosanoid production. Eur J Pharmacol. 2016;785:59–69.
- Dichlberger A, Schlager S, Lappalainen J, et al. Lipid body formation during maturation of human mast cells. J Lipid Res. 2011;52:2198–2208.
- Triggiani M, Oriente A, de Crescenzo G, et al. Metabolism of lipid mediators in human basophils and mast cells. Chem Immunol. 1995;61:135–147.
- Wendell SG, Baffi C, Holguin F. Fatty acids, inflammation, and asthma. J Allergy Clin Immunol. 2014;133:1255–1264.
- Calder PC. Omega-3 fatty acids and inflammatory processes: from molecules to man. Biochem Soc Trans. 2017;45:1105–1115.
- Taketomi Y, Murakami M. Immunological regulation by bioactive lipids. Yakugaku Zasshi. 2017;137:503–515.
- Barnig C, Frossard N, Levy BD. Towards targeting resolution pathways of airway inflammation in asthma. Pharmacol Ther. 2018;186:98–113.
- Bozza PT, Magalhaes KG, Weller PF. Leukocyte lipid bodies – biogenesis and functions in inflammation. Biochim Biophys Acta. 2009;1791:540–551.
- Fonteh AN, Chilton FH. Mobilization of different arachidonate pools and their roles in the generation of leukotrienes and free arachidonic acid during immunologic activation of mast cells. J Immunol. 1993;150:563–570.
- Friedrich M. Lipid remodeling and obesity. JAMA. 2011;306:257.
- Surette ME, Winkler JD, Fonteh AN, et al. Relationship between arachidonate–phospholipid remodeling and apoptosis. Biochemistry. 1996;35:9187–9196.
- Chilton FH, Fonteh AN, Surette ME, et al. Control of arachidonate levels within inflammatory cells. Biochim Biophys Acta. 1996;1299:1–15.
- Boyce JA. Mast cells and eicosanoid mediators: a system of reciprocal paracrine and autocrine regulation. Immunol Rev. 2007;217:168–185.
- Kabashima K, Nakashima C, Nonomura Y, et al. Biomarkers for evaluation of mast cell and basophil activation. Immunol Rev. 2018;282:114–120.
- Liu HQ, Qiu Y, Mu Y, et al. A high ratio of dietary n-3/n-6 polyunsaturated fatty acids improves obesity-linked inflammation and insulin resistance through suppressing activation of TLR4 in SD rats. Nutr Res. 2013;33:849–858.
- Kalogeropoulos N, Panagiotakos DB, Pitsavos C, et al. Unsaturated fatty acids are inversely associated and n-6/n-3 ratios are positively related to inflammation and coagulation markers in plasma of apparently healthy adults. Clin Chim Acta. 2010;411:584–591.
- Maaetoft-Udsen K, Greineisen WE, Aldan JT, et al. Comparative analysis of lipotoxicity induced by endocrine, pharmacological, and innate immune stimuli in rat basophilic leukemia cells. J Immunotoxicol. 2015;12:385–394.
- Passante E, Frankish N. The RBL-2H3 cell line: its provenance and suitability as a model for the mast cell. Inflamm Res. 2009;58:737–745.
- Melo RC, Weller PF. Lipid droplets in leukocytes: organelles linked to inflammatory responses. Exp Cell Res. 2016;340:193–197.
- Weller PF, Dvorak AM. Lipid bodies: intracellular sites for eicosanoid formation. J Allergy Clin Immunol. 1994;94:1151–1156.
- Ding J, Nagai K, JT W. Insulin-dependent adipogenesis in stromal ST2 cells derived from murine bone marrow. Biosci Biotechnol Biochem. 2003;67:314–321.
- D’Avila H, Roque NR, Cardoso RM, et al. Neutrophils recruited to the site of Mycobacterium bovis BCG infection undergo apoptosis and modulate lipid body biogenesis and prostaglandin E production by macrophages. Cell Microbiol. 2008;10:2589–2604.
- Araujo-Santos T, Prates DB, Andrade BB, et al. Lutzomyia longipalpis saliva triggers lipid body formation and prostaglandin E(2) production in murine macrophages. PLoS Negl Trop Dis. 2010;4:e873.
- Gemmink A, Daemen S, Kuijpers HJH, et al. Super-resolution microscopy localizes perilipin 5 at lipid droplet-mitochondria interaction sites and at lipid droplets juxtaposing to perilipin 2. Biochim Biophys Acta Mol Cell Biol Lipids. 2018;1863:1423–1432.
- Klecker T, Braun RJ, Westermann B. Lipid Droplets Guard Mitochondria during Autophagy. Dev Cell. 2017;42:1–2.
- Yu J, Zhang S, Cui L, et al. Lipid droplet remodeling and interaction with mitochondria in mouse brown adipose tissue during cold treatment. Biochim Biophys Acta. 2015;1853:918–928.
- Chang WH, Ting HC, Chen WW, et al. Omega-3 and omega-6 fatty acid differentially impact cardiolipin remodeling in activated macrophage. Lipids Health Dis. 2018;17:201.
- Leung CW, Hong Y, Hanske J, et al. Superior fluorescent probe for detection of cardiolipin. Anal Chem. 2014;86:1263–1268.
- Weller PF. Leukocyte lipid bodies – structure and function as “Eicosasomes”. Trans Am Clin Climatol Assoc. 2016;127:328–340.
- Galli SJ, Tsai M. Mast cells in allergy and infection: versatile effector and regulatory cells in innate and adaptive immunity. Eur J Immunol. 2010;40:1843–1851.
- Noli C, Miolo A. The mast cell in wound healing. Vet Dermatol. 2001;12:303–313.
- Bays H. Adiposopathy, “sick fat,” Ockham’s razor, and resolution of the obesity paradox. Curr Atheroscler Rep. 2014;16:409.
- Zelechowska P, Agier J, Kozlowska E, et al. Mast cells participate in chronic low-grade inflammation within adipose tissue. Obes Rev. 2018;19:686–697.
- Shi MA, Shi GP. Different roles of mast cells in obesity and diabetes: lessons from experimental animals and humans. Front Immunol. 2012;3:7.
- Wang J, Shi GP. Mast cell stabilization: novel medication for obesity and diabetes. Diabetes Metab Res Rev. 2011;27:919–924.
- Zhang J, Shi GP. Mast cells and metabolic syndrome. Biochim Biophys Acta. 2012;1822:14–20.
- Liu J, Divoux A, Sun J, et al. Genetic deficiency and pharmacological stabilization of mast cells reduce diet-induced obesity and diabetes in mice. Nat Med. 2009;15:940–945.
- Pietilainen KH, Rog T, Seppanen-Laakso T, et al. Association of lipidome remodeling in the adipocyte membrane with acquired obesity in humans. PLoS Biol. 2011;9:e1000623.
- Quehenberger O, Armando A, Dumlao D, et al. Lipidomics analysis of essential fatty acids in macrophages. Prostaglandins Leukot Essent Fatty Acids. 2008;79:123–129.
- Yetukuri L, Katajamaa M, Medina-Gomez G, et al. Bioinformatics strategies for lipidomics analysis: characterization of obesity related hepatic steatosis. BMC Syst Biol. 2007;1:12.
- Fonteh AN, Chilton FH. Rapid remodeling of arachidonate from phosphatidylcholine to phosphatidylethanolamine pools during mast cell activation. J Immunol. 1992;148:1784–1791.
- Garcia-Gil M, Siraganian RP. Source of the arachidonic acid released on stimulation of rat basophilic leukemia cells. J Immunol. 1986;136:3825–3828.
- Miyata J, Arita M. Role of omega-3 fatty acids and their metabolites in asthma and allergic diseases. Allergol Int. 2015;64:27–34.
- Saito P, Melo CPB, Martinez RM, et al. The lipid mediator resolvin D1 reduces the skin inflammation and oxidative stress induced by UV irradiation in hairless mice. Front Pharmacol. 2018;9:1242.
- Martin N, Ruddick A, Arthur GK, et al. Primary human airway epithelial cell-dependent inhibition of human lung mast cell degranulation. PLoS One. 2012;7:e43545.