
ABSTRACT
Few human cell strains are suitable and readily available as in vitro adipocyte models. We used resected lipoma tissue from a patient with germline phosphatase and tensin homolog (PTEN) haploinsufficiency to establish a preadipocyte cell strain termed LipPD1 and aimed to characterize cellular functions and signalling pathway alterations in comparison to the established adipocyte model Simpson-Golabi-Behmel-Syndrome (SGBS) and to primary stromal-vascular fraction cells. We found that both cellular life span and the capacity for adipocyte differentiation as well as adipocyte-specific functions were preserved in LipPD1 and comparable to SGBS adipocytes. Basal and growth factor-stimulated activation of the PI3 K/AKT signalling pathway was increased in LipPD1 preadipocytes, corresponding to reduced PTEN levels in comparison to SGBS cells. Altogether, LipPD1 cells are a novel primary cell model with a defined genetic lesion suitable for the study of adipocyte biology.
Introduction
Obesity and concomitant diseases are a major public health issue [Citation1]. In vitro models are needed to elucidate molecular mechanisms of adipose tissue dysfunction and identify novel drug targets for obesity treatment. Adipose precursor cells derived from the stromal-vascular fraction (SVF) of adipose tissues from various species including humans have been used for in vitro studies of adipocyte biology. These cell systems are more physiological than transformed murine preadipocyte models, such as 3T3-L1, but availability of tissue and supply of cells are limited. Moreover, there is high donor-to-donor variability of adipose tissue characteristics and function [Citation2]. Only few human preadipocyte cell strains are available for the study of adipose tissue biology [Citation3–5], among which the Simpson-Golabi-Behmel syndrome (SGBS) cell strain is the most widely used. SGBS cells are characterized by a retained capacity for adipogenic differentiation in long-term cell culture [Citation5]. We used resected lipoma tissue from a patient with PTEN hamartoma tumour syndrome (PHTS) carrying a heterozygous germline microdeletion in the phosphatase and tensin homolog (PTEN) gene to establish a cell strain termed LipPD1 [Citation6]. PTEN catalyses the conversion of the lipid messenger phosphatidylinositol-3,4,5-trisphosphate (PIP3) to phosphatidylinositol-4,5-bisphosphate (PIP2), counteracting the activity of the class I phosphatidylinositol 3-kinases (PI3 Ks) and is involved in the regulation of adipocyte function including insulin sensitivity [Citation7]. PTEN inhibition was shown to increase glucose utilization by up-regulating intracellular PIP3 concentrations and activation of AKT in 3T3-L1 adipocytes [Citation8] as well as to increase insulin sensitivity in 3T3-L1 preadipocytes [Citation9]. Patients with PHTS were shown to be more insulin sensitive despite being more obese compared to matched controls [Citation10]. We aimed to characterize adipocellular function and particularly responses to insulin of the newly established LipPD1 cell strain in comparison to PTEN wild type human primary SVF cells and the established adipocyte model SGBS.
Materials and methods
Ethics statement
This study was carried out in accordance with the recommendations of the ethics committee of the University of Leipzig. The protocol was approved by the Ethics Committee of the University of Leipzig (425–12-1712201 and 2425–12-171220). All patients or patient’s parents gave written informed consent in accordance with the Declaration of Helsinki 1975.
Histopathology and cellular composition of lipoma tissue
Lipoma and adjacent adipose tissue (subcutaneous, peri- and prerenal adipose tissue) of an 11-month-old male PHTS patient were resected for diagnostic and therapeutic purposes. Parts of the resected lipoma were embedded in paraffin and stained with hematoxylin/eosin and a periodic acid-Schiff stain for tumour diagnosis. Furthermore, S-100-protein was detected immunohistochemically according to routine protocols to exclude malignancy [Citation11].
Staining for PTEN was performed after demasking the tissues in Target Retrieval solution pH 9.0 (Agilent, #S2367) using a rabbit anti-PTEN antibody (Abcam, # ab32199) and the LSAB+ Dako Real Detection Systems, AP/RED, Rabbit/Mouse detection kit (Agilent, # K5005) according to manufacturer’s instructions. The anti-PTEN antibody was used at a dilution of 1:50 and incubated for 1 h at room temperature.
Cell culture
SGBS cells were established and cultured as described previously [Citation5]. In our culture studies, we used SGBS cells starting from of 35 population doublings which corresponds to approximately 70 d in culture. LipPD1 cells were obtained from lipomatous tissue of an 11 month-old male PHTS patient. SVF#6 (male donor, 27 y) and SVF#10 (female donor, 29 y) cells were established from visceral adipose tissue resected during bariatric surgery of obese, non-diabetic adult patients. SVF cells were isolated from the patient’s lipoma (LipPD1) or from visceral adipose tissue of healthy donors (SVF#6 and SVF#10) and transferred into culture as described previously [Citation6]. For the isolation of preadipocytes, the tissue (~5–20 g) was cut into pieces of about 0.5 cm3 and washed twice with sterile PBS (Sigma, #D8537). After digestion in 200 U/ml Collagenase-HBSS-solution (Sigma, #C5138) for 90 minutes in a 37°C shaking water bath, the material was filtrated through a nylon mesh (pore size 400 µm) and centrifuged at 1.100 rpm at room temperature for 5 min. The pellet was washed and centrifuged again at 1.500 rpm. Erythrocytes were eliminated by lysis (150 mM ammonium chloride (Sigma, #A9434), 10 mM potassium hydrogen carbonate (Roth, #3904.1), 0.1 nM EDTA (Roth, #1410.2), pH 7.29, room temperature, 10 min) and subsequent centrifugation at 1.500 rpm. The pellet was resuspended in culture medium (DMEM/F12 (Thermo Fisher Scientific, #11330032), supplemented with 10% FCS (Merck, #S0615), 33 µM biotin (Sigma, #B4639) and 17 µM pantothenic acid (Sigma, #P5155) and filtered once more (pore size 30 µm). Cells were seeded as adherent cultures and subcultured continuously at a ratio of 1:4 before reaching confluence, usually twice a week. For estimating the capacity for adipocyte differentiation during long-term culture, adipocyte differentiation was induced every three passages.
For 3D culture, 10,000 cells per well were seeded in 96-well ultra-low attachment plates (Greiner Bio-One, #650970) according to a modified protocol from Klingelhutz et al. [Citation12] as previously described [Citation13]. Microscope images were taken daily using an EVOS FL Auto 2 Cell Imaging System (Thermo Fisher Scientifc, #AMAFD2000). Medium change was performed by aspirating and replacing half of the medium every other day.
Adipocyte differentiation
Lipoma cells and controls were differentiated into mature adipocytes following standard protocols as described previously [Citation5]. Before inducing adipocyte differentiation, LipPD1 and SVF were passaged for approximately 40–60 d, while SGBS were passaged for approximately 70–90 d. Cells were seeded at high density (~10,000 cells/cm2) on 6-well plates and reached full confluence after one or 2 d. Differentiation was then induced by incubation with differentiation medium (DMEM/F12,Thermo Fisher Scientific, #11330032), 33 µM biotin (Sigma, #B4639) 17 µM pantothenic acid (Sigma, #P5155), 0.13 nM apo-transferrin (Sigma, #T1147), 20 nM insulin (Sigma, #I2643), 100 nM hydrocortisone (Sigma, #H0888) and 0.2 nM triiodothyronine (Sigma, #T6397). For the first 4 d, cells were incubated in QD medium differentiation medium supplemented with 25 nM dexamethasone (Sigma, #D1756), 500 µM 1-methyl-3-isobutyl-1-methylxanthine (Sigma, #I5879) and 2 µM rosiglitazone (Sigma, #R2408). Medium was changed every other day until day 12. To confirm and quantify differentiation efficiency, cells were fixed with Roti-Histofix 4% PFA (Roth, #P087.4), double-stained with Nile Red (Sigma, #N3013) and Hoechst 33342 (Sigma, #14533) and analysed by fluorescence microscopy. The percentage of lipid accumulating cells in proportion to total cell number was determined by enumerating five defined, randomly chosen areas per well using fluorescence microscopy. Experiments were done three times in quadruplicates. For comparison of LipPD1, SVF#6, SVF#10 and SGBS cells were plated at ~13,000 cells/cm2 on 6-well plates or ~45,000 cells/cm2 on 96-well plates and differentiation was induced the next day with QD medium. Cells were kept in QD medium for 8 d and were either frozen for RNA extraction or fixed for lipid staining. Undifferentiated controls were kept in serum free basal medium for 24 h prior to freezing for RNA extraction. Fixed cells were first double-stained with Nile Red and Hoechst 33342 followed by a staining with Oil Red O solution (0.03% in 60% isopropanol, Sigma, #O0625) for 15 min at 37°C.
Proliferation of lipoma cells
Cells were seeded at low density (~1,000 cells/cm2) in multiwell-plates with serum containing medium. Cells were fixed, nuclei were stained with Hoechst-33342 at several time points (24–96 h) and counted using fluorescence microscopy in defined areas in random order. In three independent experiments population doubling (PD) time was estimated in the exponential growth phase using the formula PD = 3.32 (log Xe – log Xb) + S (Xb: cell number at the beginning of the incubation time, Xe: cell number at the end of the incubation time, S: starting PD level, animal cell culture guide; www.atcc.org)
Quantification of mRNA expression
Adipocyte and other cell-type markers from different adipose tissue depots, lipoma tissue, 3D- and 2D cell cultures were quantified via quantitative PCR (qPCR). For RNA extraction from tissue or 3D cultures we used TRIzol Reagent (Thermo Fisher Scientifc, #15596026) and homogenized the material using a TissueLyser II (QIAGEN). RNA from 2D cell cultures was extracted using the RNeasy Mini Kit (QIAGEN, # 74106). Reverse transcription was done according to standard protocols using the M-MLV Reverse Transcriptase (Thermo Fisher Scientifc, #28025013). Following the producer’s instruction and protocols, gene expression was quantified using TaqMan-Technology (Thermo Fisher Scientifc). Primers and probes were designed with the software PrimerExpress (Version 3.0, Thermo Fisher Scientifc). All measurements were normalized on housekeeping genes hypoxanthine phosphoribosyltransferase (HPRT) and Tata-box binding protein (TBP). Analysed genes and primer sequences are listed in Supplementary Table 1.
Insulin/IGF-I signalling pathway
The amount of PTEN protein and phosphorylated AKT was detected as described previously [Citation6]. For the detection of AKT phosphorylation after overnight serum starvation, cells were stimulated with increasing doses of IGF-I (GroPep, #IU100) or insulin (Sigma, #I2643). After lysis, electrophoretic separation of proteins, and transfer onto nitrocellulose membranes, immunoblotting was performed to detect the amount of PTEN (PTEN (138G6) Rabbit mAb, #9559), phosphorylated (Phospho-Akt (Thr308) (224F9) Rabbit mAb, #4056; Phospho-Akt (Ser473) (193H12) Rabbit mAb, #4058) and total AKT (Akt Antibody #9272). All antibodies were purchased from Cell Signalling Technologies and used according to standard protocols. GAPDH (Merck, #MAB374) or β-Actin (Sigma, A5316) was used as loading control. For semi-quantification, densitometric analysis was carried out using the open-source software ImageJ (Version 1.41 [Citation14],).
Lipolysis
Adipocytes (LipPD1 and SGBS, differentiated until day 13) were incubated in basal medium (DMEM/F12 (Thermo Fisher Scientific, #11330032), 33 µM biotin (Sigma, #B4639) 17 µM pantothenic acid) for 5 h and subsequently stimulated with different concentrations of isoproterenol (Sigma, #I6504, 10 pmol/l – 100 μmol/l) for 22 h. The release of glycerol as measure for an induced lipolysis was quantified using a glycerol assay kit (Sigma, #MAK117-1KT) and normalized to the amount of protein.
14C-2-deoxy-glucose uptake
For glucose uptake assays, fully differentiated LipPD1 and SGBS adipocytes (differentiated until day 12) were incubated as described before [Citation15]. Cells were incubated in culture medium overnight, washed and incubated in 20 mM Hepes Krebs Ringer/0.1% BSA buffer, pH 7.4 (136 mmol/l NaCl, 4.7 mmol/l KCl, 1.25 mmol/l MgSO4, 1.25 mmol/l CaCl2) for 2 h at 37°C. Afterwards, cells were stimulated with 1–106 pM insulin for 2 h at 37°C. Glucose uptake was determined by adding [14 C]-2-deoxyglucose (#NEC720A050UC, Perkin Elmer) to a final concentration of 0.5 µCi/ml for 5 min. The reaction was stopped by adding 10 mmol/l 2-deoxyglucose and subsequent washing in ice-cold PBS, and cell lysates were prepared in 0.1% SDS (ROTH, #1410.2). Radioactivity was determined after adding scintillation fluid (OptiPhase-SuperMix, #1200-439, Perkin Elmer) using a WALLACE 1409 DSA Liquid Scintillation counter. Analyses were performed in quadruplicates.
PI3 K activity measurement
To quantify the amount of PIP3 at the plasma membrane as a measure for PI3 K activity, LipPD1 or SGBS cells were transfected with a plasmid encoding the marker protein for PIP3, YFP-GRP1(PH) [Citation16] using the Amaxa nucleofection technique (Cell Line Nucleofector Kit V, Lonza, #VVCA-1003, program T-30). Nucleofected cells were seeded onto glass cover slips in normal culture medium and medium was replaced after 24 h with serum-free medium to reduce basal PI3-kinase activity. Total internal reflection/fluorescence redistribution after photobleaching (TIR/FRAP) measurements were performed after 3–6 h incubation in serum-free medium. Wortmannin (400 nmol/l, LC Laboratories, #W-2990) in serum-free medium for 3–6 h was used as negative control. Repetitive TIR/FRAP measurements at one spot of the cell membrane were performed as described previously using a setup that enabled image acquisition under TIR illumination in combination with spot photobleaching [Citation16].
Statistics
Unless otherwise stated, experiments were performed ≥3 times. GraphPad®Prism 6 was used for data visualization and statistical calculations. Data were presented as mean±SEM. Statistical significance was tested by one-way or two-way analysis of variance (ANOVA) followed by Sidak’s multiple comparisons test for comparing three or more groups or Student’s t-test for comparing two groups.
Results
Lipoma tissue is not different from white adipose tissue
Lipoma and adjacent adipose tissues from a patient with PTEN hamartoma tumour syndrome (PHTS) and a heterozygous germline microdeletion of exons 2–9 of the PTEN gene were resected for diagnostic purposes and to reduce tumour burden [Citation6]. Histological analysis was performed to exclude malignancy and showed about 80% normal white adipocytes with insular spots of multilocular fat containing cells. PTEN protein was similarly detected in lipoma tissue () compared to subcutaneous () and perirenal tissue ()). No mitotic activities, nuclear polymorphisms or myxoid changes were observed. The investigation was repeated twice to confirm the somewhat unexpected result showing normal adipose tissue histology in the presence of severe lipomatosis. A comparative genomic hybridization (CGH) array was performed to detect the boundaries of the heterozygous PTEN deletion. Exons 2–9 of PTEN and additional 53,000 bp downstream were found to be deleted (schematic depiction in Supplementary Figure 1E). No other genes than PTEN were affected by the deletion [Citation6].
Figure 1. Characterization of lipoma tissue from a patient with phosphatase and tensin homolog (PTEN) hamartoma tumour syndrome
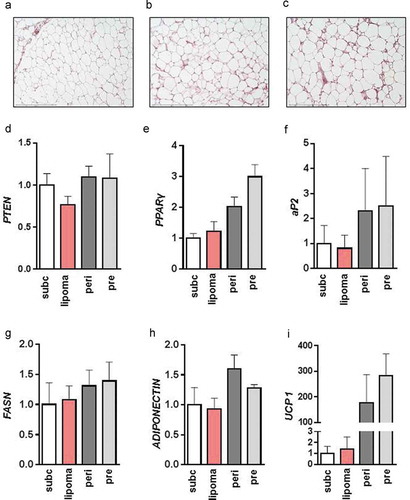
In line with the histological results, PTEN mRNA expression was similar in all examined adipose tissue depots of the patient ()). To further characterize the lipoma tissue, we compared the expression of white adipocyte marker genes peroxisome proliferator-activated receptor γ (PPARγ, )), adipocyte binding protein 2 (aP2, )), fatty acid synthase (FASN, )), adiponectin ()) and brown adipocyte marker uncoupling protein 1 (UCP-1, )). There was a trend towards higher expression of PPARγ, aP2 and higher expression of UCP 1 in the peri- and prerenal adipose depots compared to lipoma or subcutaneous adipose tissue of the patient. No significant differences in gene expression were detected between lipoma tissue and subcutaneous adipose tissue of the patient. This was also seen for the brown adipocyte marker PR Domain 16 (PRDM16), the endothelial cell marker cadherin 5 (CDH5), the macrophage marker cluster of differentiation 163 (CD163) and the fibroblast marker cartilage oligomeric matrix protein (COMP) (Supplementary Figure 1A-D).
LipPD1 show enhanced capacity for adipose differentiation during long-term culture
Lipoma tissue was used to establish a cell strain termed LipPD1 [Citation6]. Doubling time was determined and was found to be approximately 25 h (Supplementary Figure 2A) until cells were approximately 70 d in culture. From this time point onwards, cells grew only very slowly and stopped dividing at approximately 90 d in culture (Supplementary Figure 2B).
Lipoma cells phenotypically resembled preadipocytes. Interestingly, they could be frozen and re-thawed and showed a high potential for adipose differentiation in vitro similar to the SGBS adipocyte model. This capacity was preserved under long-term culture conditions ()) [Citation5]. In line with this, LipPD1 cells passaged for 40–60 d showed an amount of lipid accumulation in response to in vitro adipocyte differentiation comparable to SGBS cells. In contrast, control primary stromal-vascular fraction (SVF) cells incubated for the same time period completely lost their capacity to accumulate lipids ()).
Figure 2. Growth and adipocyte differentiation of LipPD1 cells during long-term culture
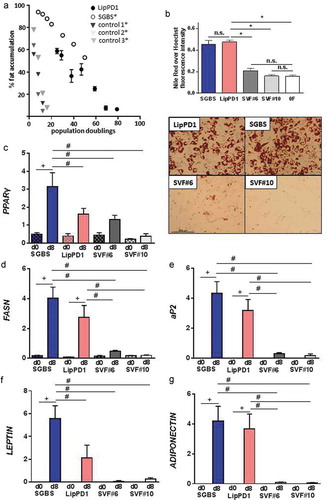
To determine whether the characteristic changes in gene expression patterns during adipocyte differentiation were retained during long-term culture both in SGBS and LipPD1 cells, mRNA expression of PPARγ, aP2, FASN, leptin and adiponectin ()) was quantified over 8 d of differentiation and compared with SVF cells. Expression of white adipocyte differentiation markers was significantly higher in SGBS after 8 d of differentiation compared to undifferentiated SGBS (p < 0.05). Except for the expression of PPARγ and leptin, this was the case also in LipPD1 (p < 0.05). SGBS also showed a higher expression of PPARγ and leptin than LipPD1 (p < 0.05). These results were supported when comparing gene expression time courses until day 12 of adipocyte differentiation (Supplementary Figure 2B-E). In accordance with the inability to accumulate lipids, long-term cultured SVFs did not show differences of adipocyte marker expression before and after differentiation ()).
LipPD1 and SGBS adipocytes are functionally comparable
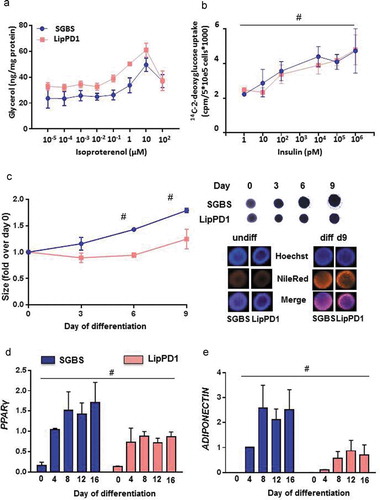
We next tested whether typical adipocyte functional properties were similar in LipPD1 and SGBS adipocytes (). Lipolytic capacity was comparable between LipPD1 and SGBS adipocytes with a dose-dependent increase in lipolysis after isoproterenol stimulation both for LipPD1 and SGBS adipocytes with a maximum at 10 µmol/l isoproterenol ()). Insulin stimulation led to a significant dose-dependent increase in 14 C-2-deoxy-glucose uptake in both LipPD1 and SGBS adipocytes (p < 0.05) with no significant differences between LipPD1 and SGBS ()). Both cell strains grew well in 3D culture; spheroids increased in diameter during in vitro differentiation indicating lipid accumulation [Citation12]. On day 6 and 9, SGBS spheroids were larger than LipPD1, reflecting enhanced adipocyte differentiation and therefore adipocyte size ()). Expression of differentiation markers PPARγ ()) and adiponectin ()) was significantly higher in SGBS than in LipPD1 spheroids (p < 0.05).
Figure 3. Functional characteristics of LipPD1 compared to SGBS adipocytes
PI3 K and AKT are constitutively activated in LipPD1 compared to SGBS preadipocytes
To check whether the detected mutation in PTEN influenced cellular signalling, we analysed the PI3 K/AKT signalling pathway. LipPD1 had lower PTEN protein compared to SGBS (), 0.50 ± 0.11fold in LipPD1, p < 0.05 in preadipocytes). Next, we tested whether PI3 K/AKT signalling was different in LipPD1 compared to SGBS preadipocytes. A higher basal and IGF-I-stimulated AKT phosphorylation both at Thr308 (p < 0.05; ), Supplementary Figure 3A) and at Ser473 (Supplementary Figure 3B [Citation17],) was detected in LipPD1 compared to SGBS preadipocytes. The amount of a fluorescent PIP3 analogue at the cell membrane was quantified under serum free conditions or stimulated with IGF-I (10 nmol/l). LipPD1 had a higher basal amount of membrane-bound PIP3 analog than SGBS preadipocytes (p < 0.05, )). PIP3 analogue measurements after stimulation with IGF-I were not different in LipPD1 and SGBS cells ()). In line with the similar functional responses to insulin stimulation, no differences in basal and insulin-stimulated AKT phosphorylation were found when comparing LipPD1 and SGBS adipocytes (), Supplementary figure 4A, B).
Figure 4. PI3 K signalling is constitutively activated in LipPD1 preadipocytes
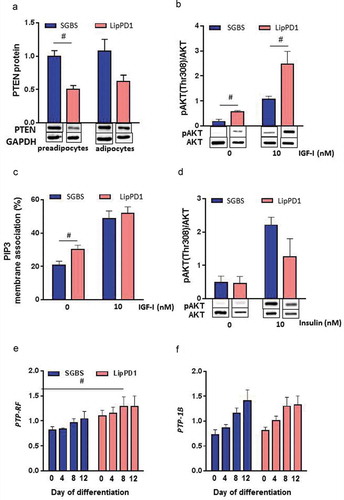
Other phosphatases acting upon PIP3 or AKT could potentially be upregulated and substitute for PTEN haploinsufficiency. We checked mRNA expression of candidate phosphatases PH domain leucine-rich repeat protein phosphatases (PHLPP) 1 and 2, protein-tyrosine phosphatase (PTP)-1B or PTP receptor type F (PTP-RF). While expression of PHLPP 1 and 2 was not detectable in our cell models (data not shown), we found higher expression of PTP-RF in LipPD1 cells during adipocyte differentiation compared to SGBS cells ()). PTP-1B expression was not different ()).
Discussion
Human adipocyte models, which are genetically and functionally well characterized, are urgently needed for in vitro obesity research. We evaluated a human adipocyte model which was established from lipoma tissue of a patient with heterozygous germline PTEN deletion and was termed LipPD1 [Citation6]. Germline PTEN mutations are frequently found in patients with PTEN hamartoma tumour syndrome (PHTS). Besides having an increased risk for malignancies [Citation18], children with PHTS often develop multiple lipomas or non-malignant adipose tissue overgrowth, which can cause organ dysfunction due to rapid and invasive expansion [Citation6,Citation19]. This phenotype is specific for paediatric patients. Adults with PHTS rarely develop lipomas but were shown to have increased insulin sensitivity despite being more obese than age- and sex-matched controls [Citation10]. PTEN is a lipid and protein phosphatase and a negative regulator of the PI3 K/AKT pathway, one of the major signalling pathways mediating cellular growth in response to insulin and other growth factors [Citation20]. PTEN is also a tumour suppressor and frequently mutated in human malignancies.
Although being tumoural tissues, spontaneous non-syndromal lipomas have been shown to resemble dysfunctional adipose tissue, similar to what is seen in obesity [Citation21], but lacking infiltration of inflammatory cells. This was also the case in our study, in which lipoma tissue morphology and gene expression were similar to subcutaneous adipose tissue of the same patient. Mutations or deletions in other tumour suppressor genes were excluded by Sanger sequencing, multiplex ligation-dependent probe amplification and comparative genomic hybridization both in the lipoma tissue and in lipoma-derived LipPD1 cells [Citation6]. We can, however, not exclude the possibility that LipPD1 cells acquired somatic mutations during cell culture. A potential reason could be the accumulation of replication stress, as is described for the culture of human mesenchymal stromal cells [Citation22].
We compared LipPD1 cells to primary SVF cells from healthy adult donors that had been cultured for the same time period and to the functionally well-characterized adipocyte model Simpson-Golabi-Behmel Syndrome (SGBS) cells [Citation5,Citation23] with amounts of PTEN comparable to primary SVF cells from healthy donors [Citation17]. SGBS cells have been utilized to study white and brown adipocyte development, beiging of white adipocytes as well as effects of co-culture in a multitude of studies [Citation23–34]. While the syndrome is associated with mutations in glypican 3 and 4 as well as in oral-facial-digital syndrome (OFD1) [Citation35], the specific mutation which is carried by the SGBS cells and is causative for the SGBS phenotype of increased cellular lifespan and preserved capacity for adipocyte differentiation during long-term culture is not yet defined [Citation23].
LipPD1 cells are haploinsufficient for PTEN function, which presumably is the cause for their increased cellular life span and enhanced in vitro adipocyte differentiation capacity. This is supported by earlier results using alpelisib, a specific PIK3CA inhibitor on LipPD1 cells. Alpelisib-treated LipPD1 cells differentiated into adipocytes less well and showed a decrease in proliferation. We did not detect induction of apoptosis or cell death, but found an upregulation of senescence marker p16 and increased β-galactosidase staining indicating induction of senescence [Citation13]. PTEN’s role in senescence seems to be cell-type specific and can be enhancing or suppressing. While an upregulation of PTEN in alveolar epithelial cells caused senescence-associated fibrosis [Citation36], PTEN overexpression in glioblastoma neurospheres led to increased senescence [Citation37]. A recent study in a mouse model with conditional PTEN knockout in adipose tissue depots showed a phenotype of adipose tissue redistribution with massive expansion of the PTEN knockout depot and reduced fat mass in other adipose tissue depots. We saw a similar phenotype in the PHTS patient from whose lipomas the LipPD1 cells were derived [Citation6], pointing to a direct role for PTEN in regulating whole-body adipose tissue distribution.
Because of the reduced PTEN function, we expected LipPD1 cells to be more sensitive both in cellular responses towards insulin and in insulin signalling pathway activation compared to SGBS which express PTEN at a similar level as primary human SVF cells [Citation38]. LipPD1 responses to insulin stimulation, however, were comparable to SGBS, with similar glucose uptake and capacity for adipocyte differentiation. These findings were supported by the fact that insulin-stimulated AKT activation was similar in both cell cultures after in vitro adipocyte differentiation. One reason for this could be the upregulation of other phosphatases during adipocyte differentiation that substitute for the reduced PTEN function. Possible candidates for this role could be PH domain leucine-rich repeat protein phosphatases (PHLPP) 1 and 2 [Citation39], protein-tyrosine phosphatase 1B [Citation40] or protein-tyrosine phosphatase receptor type F (PTP-RF) [Citation41] as they target the insulin signalling pathway and were shown to be implicated in the development of insulin resistance. We found a higher expression of PTP-RF in LipPD1 compared to SGBS cells during adipocyte differentiation.
In contrast to the situation in adipocytes, we detected a significantly higher basal and IGF-I stimulated AKT activation in LipPD1 compared to SGBS preadipocytes, which corresponded to a higher amount of membrane-bound PIP3 analogue under basal conditions. This result recapitulates the findings of increased AKT phosphorylation in adipose tissue and mucosa-associated lymphoid tissue of patients with PHTS [Citation10,Citation39,Citation42].
Conclusion
LipPD1 cells were comparable, but not equal to, SGBS cells in their capacity for adipocyte differentiation after long-term culture, expression of white adipocyte marker genes and adipocyte function. SGBS cells with slightly longer duration in continuous culture showed higher expression of some white adipocyte markers as well as a bigger size of 3D spheroids during in vitro adipocyte differentiation. In contrast to SGBS cells with unknown genetic alterations [Citation23], the genetic lesion in LipPD1 cells has been characterized [Citation6]. The usage of LipPD1 cells as adipocellular model is limited by the fact that they are no cell line with infinite capacity for passaging as they are not immortalized and no unlimited supply is possible. However, they can be easily cultured, differentiated into adipocytes by established protocols and function as mature adipocytes in key functional assays. LipPD1 cells can therefore be considered a new primary cell model with a prolonged life span, which is suitable to study adipocyte biology.
Supplemental Material
Download MS Power Point (878.4 KB)Supplemental Material
Download MS Word (23.2 KB)Acknowledgments
We gratefully acknowledge Anja Barnikol-Oettler, Sandy Richter and Roy Tauscher for excellent technical assistance. We thank the donors of adipose tissue and Prof. Arne Dietrich (Department of Metabolic Surgery, Leipzig University Hospital) for support.
Disclosure statement
All authors declare no conflict of interest.
Supplementary material
Supplemental data for this article can be accessed here.
Additional information
Funding
References
- Bray GA, Kim KK, Wilding JPH. Obesity: a chronic relapsing progressive disease process. A position statement of the World Obesity Federation. Obes Rev. 2017;18:290–301.
- White U, Tchoukalova Y. Sex dimorphism and depot differences in adipose tissue function. Biochim Biophys Acta. 2014;1842:377–392.
- Wabitsch M, Brüderlein S, Melzner I, et al. LiSa-2, a novel human liposarcoma cell line with a high capacity for terminal adipose differentiation. Int J Cancer. 2000;88:889–894.
- Rodriguez AM, Elabd C, Delteil F, et al. Adipocyte differentiation of multipotent cells established from human adipose tissue. Biochem Biophys Res Commun. 2004;315:255–263.
- Wabitsch M, Brenner RE, Melzner I, et al. Characterization of a human preadipocyte cell strain with high capacity for adipose differentiation. Int J Obes Relat Metab Disord. 2001;25:8–15.
- Schmid GL, Kässner F, Uhlig HH, et al. Sirolimus treatment of severe PTEN hamartoma tumor syndrome: case report and in vitro studies. Pediatr Res. 2014;75:527–534.
- Ortega-Molina A, Efeyan A, Lopez-Guadamillas E, et al. Pten positively regulates brown adipose function, energy expenditure, and longevity. Cell Metab. 2012;15:382–394.
- Manna P, Jain S. Hydrogen sulfide and L-cysteine increase PIP3 and glucose utilization by inhibiting PTEN protein and activating PI3K/AKT/PKCζ/λ in 3T3l1 adipocytes. J Biol Chem. 2011;286:39848–39859.
- Lee SK, Lee JO, Kim JH, et al. Metformin sensitizes insulin signaling through AMPK-mediated PTEN down-regulation in preadipocyte 3T3-L1 cells. J Cell Biochem. 2011;112:1259–1267.
- Pal A, Barber TM, Van de Bunt M, et al. PTEN mutations as a cause of constitutive insulin sensitivity and obesity. N Engl J Med. 2012;367:1002–1011.
- Schmitt FC, Bacchi CE. S‐100 protein: is it useful as a tumour marker in diagnostic immunocytochemistry? Histopathology. 1989;15:281–288.
- Klingelhutz AJ, Gourronc FA, Chaly A, et al. Scaffold-free generation of uniform adipose spheroids for metabolism research and drug discovery. Sci Rep. 2018;8:523.
- Kirstein AS, Augustin A, Penke M, et al. The novel Phosphatidylinositol-3-Kinase (PI3K) inhibitor alpelisib effectively inhibits growth of PTEN-haploinsufficient lipoma cells. Cancers (Basel). 2019;11:1586.
- Rueden CT, Schindelin J, Hiner MC, et al. ImageJ2: imageJ for the next generation of scientific image data. BMC Bioinformatics. 2017;18:529.
- Revollo JRJR, Körner A, Mills KFKF, et al. Nampt/PBEF/Visfatin regulates insulin secretion in beta cells as a systemic NAD biosynthetic enzyme. Cell Metab. 2007;6:363–375.
- Tannert A, Voigt P, Burgold S, et al. Signal amplification between Gbetagamma release and PI3Kgamma-mediated PI(3,4,5)P3 formation monitored by a fluorescent Gbetagamma biosensor protein and repetitive two component TIR/FRAP analysis. Biochemistry. 2008;47:11239–11250.
- Wilhelm F, Kässner F, Schmid G, et al. Phosphatidylinositol 3-kinase (PI3K) signalling regulates insulin-like-growth factor binding protein-2 (IGFBP-2) production in human adipocytes. Growth Horm IGF Res. 2015;25:115–120.
- Ngeow J, Eng C. PTEN hamartoma tumor syndrome: clinical risk assessment and management protocol. Methods. 2014. DOI:10.1016/j.ymeth.2014.10.011
- Marsh DJ, Kum JB, Lunetta KL, et al. PTEN mutation spectrum and genotype-phenotype correlations in Bannayan-Riley-Ruvalcaba syndrome suggest a single entity with Cowden syndrome. Hum Mol Genet. 1999;8:1461–1472. Available from: http://www.ncbi.nlm.nih.gov/pubmed/10400993
- Chalhoub N, Baker SJ. PTEN and the PI3-kinase pathway in cancer. Annu Rev Pathol. 2009;4:127–150.
- Suga H, Eto H, Inoue K, et al. Cellular and molecular features of lipoma tissue: comparison with normal adipose tissue. Br J Dermatol. 2009;161:819–825.
- Kim M, Rhee JK, Choi H, et al. Passage-dependent accumulation of somatic mutations in mesenchymal stromal cells during in vitro culture revealed by whole genome sequencing. Sci Rep. 2017;7. DOI:10.1038/s41598-017-15155-5.
- Fischer-Posovszky P, Newell FS, Wabitsch M, et al. NFS. Human SGBS cells - a unique tool for studies of human fat cell biology. Obes Facts. 2008;1:184–189.
- Yeo CR, Agrawal M, Hoon S, et al. SGBS cells as a model of human adipocyte browning: A comprehensive comparative study with primary human white subcutaneous adipocytes. Sci Rep. 2017;7:4031.
- Allott EH, Oliver E, Lysaght J, et al. The SGBS cell strain as a model for the in vitro study of obesity and cancer. Clin Transl Oncol. 2012;14:774–782.
- Galhardo M, Sinkkonen L, Berninger P, et al. Transcriptomics profiling of human SGBS adipogenesis. Genom Data. 2014;2:246–248.
- Keuper M, Dzyakanchuk A, Amrein KE, et al. THP-1 macrophages and SGBS adipocytes - a new human in vitro model system of inflamed adipose tissue. Front Endocrinol (Lausanne). 2011;2:89.
- McInnes KJ, Brown KA, Knower KC, et al. Characterisation of aromatase expression in the human adipocyte cell line SGBS. Breast Cancer Res Treat. 2008;112:429–435.
- Díaz-Delfín J, Domingo P, Wabitsch M, et al. HIV-1 Tat protein impairs adipogenesis and induces the expression and secretion of proinflammatory cytokines in human SGBS adipocytes. Antivir Ther. 2012;17:529–540.
- Leiherer A, Geiger K, Muendlein A, et al. Hypoxia induces a HIF-1α dependent signaling cascade to make a complex metabolic switch in SGBS-adipocytes. Mol Cell Endocrinol. 2014;383:21–31.
- Kraus M, Greither T, Wenzel C, et al. Inhibition of adipogenic differentiation of human SGBS preadipocytes by androgen-regulated microRNA miR-375. Mol Cell Endocrinol. 2015;414:177–185.
- Schaedlich K, Gebauer S, Hunger L, et al. DEHP deregulates adipokine levels and impairs fatty acid storage in human SGBS-adipocytes. Sci Rep. 2018;8. DOI:10.1038/s41598-018-21800-4.
- Li S, Bouzar C, Cottet-Rousselle C, et al. Resveratrol inhibits lipogenesis of 3T3-L1 and SGBS cells by inhibition of insulin signaling and mitochondrial mass increase. Biochim Biophys Acta - Bioenergy. 2016;1857:643–652.
- Iwata T, Kuribayashi K, Nakasono M, et al. The AMPK/mTOR pathway is involved in D-dopachrome tautomerase gene transcription in adipocytes differentiated from SGBS cells, a human preadipocyte cell line. Cytokine. 2017;96:195–202.
- Kehrer C, Hoischen A, Menkhaus R, et al. Whole exome sequencing and array-based molecular karyotyping as aids to prenatal diagnosis in fetuses with suspected Simpson-Golabi-Behmel syndrome. Prenat Diagn. 2016;36:961–965.
- Qiu T, Tian Y, Gao Y, et al. PTEN loss regulates alveolar epithelial cell senescence in pulmonary fibrosis depending on Akt activation. Aging (Albany NY). 2019;11:7492–7509.
- Banasavadi-Siddegowda YK, Russell L, Frair E, et al. PRMT5-PTEN molecular pathway regulates senescence and self-renewal of primary glioblastoma neurosphere cells. Oncogene. 2017;36:263–274.
- Kässner F, Sauer T, Penke M, et al. Simvastatin induces apoptosis in PTEN-haploinsufficient lipoma cells. Int J Mol Med. 2018;41. DOI:10.3892/ijmm.2018.3568.
- Chen HH, Händel N, Ngeow J, et al. Immune dysregulation in patients with PTEN hamartoma tumor syndrome: analysis of FOXP3 regulatory T cells. J Allergy Clin Immunol. 2016;139:607–620.e15.
- Goldstein BJ. Protein-tyrosine phosphatase 1B (PTP1B): a novel therapeutic target for type 2 diabetes mellitus, obesity and related states of insulin resistance. Current drug targets. Immune Endocr Metab Disord. 2001;1:265–275.
- De Lorenzo C, Greco A, Fiorentino TV, et al. Variants of insulin-signaling inhibitor genes in type 2 diabetes and related metabolic abnormalities. Int J Genomics. 2013;2013:1–13.
- Heindl M, Händel N, Ngeow J, et al. Autoimmunity, intestinal lymphoid hyperplasia, and defects in mucosal B-cell homeostasis in patients with PTEN hamartoma tumor syndrome. Gastroenterology. 2012;142:1093–1096.e6.