
 ?Mathematical formulae have been encoded as MathML and are displayed in this HTML version using MathJax in order to improve their display. Uncheck the box to turn MathJax off. This feature requires Javascript. Click on a formula to zoom.
ABSTRACT
Background
Weight change is often seen in people with diabetes. We investigated the effects of genes associated with weight change/glucose handling/insulin-signalling.
Materials/methods
DNA from diabetes individuals and non-diabetes individuals, plus clinical data, were available from the DARE study (n = 379 individuals: T1D n = 111; T2D n = 222; controls n = 46). Weight gain was assessed by temporal change of Body Mass Index (BMI). Genotyping was performed for CAV1rs926198, LEPRrs1137101, BDNFrs6265 and FTOrs9939609.
Results
No differences in genotype distributions were observed for the four SNPs in all groups un-stratified by weight gain. Following stratification differences in genotype distribution were observed. For those BMI relatively stable; controls showed a difference in genotype distributions versus T1D (CAV1rs926198, LEPRrs1137101). In T2D vs controls, significant differences were observed in genotype distribution for all four genes. For BMI increase, the only difference by category was LEPRrs1137101 (bothT1D/T2D vs controls). In BMI-stable groups, CAV1rs926198, T1D individuals showed lower T allele frequency (p=0.004) vs non-diabetes and for LEPRrs1137101 a higher G allele frequency versus controls (p=0.002). For T2D, CAV1rs926198, T allele frequency was lower in T2D than controls (p=0.005). For LEPR rs1137101, the G allele frequency was higher than in controls (p=0.004). In those with BMI increase, LEPRrs1137101 T1D individuals had higher G allele frequency versus controls (p=0.002) as did T2D vs controls (p=0.03).
Conclusion
Differences in allele frequency were seen between diabetes individuals and non-diabetes diagnosed at baseline in relation to the likelihood of BMI increase of >10%. It is established that the G allele of LEPRrs1137101 is associated with weight gain/obesity. However, this is the first report of CAV1rs926198 polymorphism being associated with weight stability/gain in diabetes.
Introduction
Diabetes, in all its forms, presents significant challenges both to the individuals with the condition and the healthcare professionals who support them in clinical management while also accounting for around 10% of healthcare expenditure in the United Kingdom, as it does elsewhere [Citation1].
Weight change, and in particular weight increase, is a major consideration for people with diabetes. This is because increasing obesity can further complicate the maintenance of optimal blood glucose control [Citation2,Citation3] and also drive biological pathways of multi-morbidity [Citation4]. Whilst ‘way of life’ in all its complexity can influence weight change over time, underlying genomic factors may also influence an individual’s weight trajectory over the longer term [Citation5].
Studies have shown that certain allelic variants of some genes are associated with weight increase in people living with type 1 diabetes (T1D) or type 2 diabetes (T2D) [Citation6,Citation7]. In this pilot study, we have investigated the likelihood of weight change over time and how this may vary between people with and without a diagnosis of diabetes when stratified by genotype distribution and allele frequencies of genes previously shown to be associated with weight regulation.
Whilst an extensive literature already exists on the genetic factors that are associated with weight gain, there is much less reported relating to the differences between individuals with diabetesand those without diabetes and their likelihood of weight gain over time. In this study, we have investigated the possible effects of single nucleotide polymorphisms of four genes known to be associated with weight change, glucose handling or insulin signalling. These comprised; brain-derived neurotrophic factor (BDNF rs6265), caveolin1 gene (CAV1 rs926198), fat and obesity-associated gene (FTO r9s939609) and the leptin receptor gene (LEPR rs1137101).
The leptin receptor gene (LEPR) encodes a protein that is the receptor for the hormone Leptin which is an adipocyte-specific hormone that regulates body weight [Citation8]. LEPR belongs to the glycoprotein gp130 family of cytokine receptors that regulate a number of gene transcription pathways through the activation of STAT proteins [Citation9]. Consequently, it impacts on the ability of Leptin to regulate fat metabolism [Citation10]. Allelic forms of the LEPR gene have associated previously with obesity and dysfunction of the pituitary gland [Citation11]. Genome-wide association studies have identified a significant association between LEPR polymorphism and plasma levels of soluble leptin receptor in health individuals [Citation12]. In this study, we investigated the potential association of the distribution of genotype and allele frequencies of the non-synonymous SNP rs1137101 (Gln233Arg) which has previously been investigated in studies of weight gain [Citation13].
Caveolin-1 (CAV1) is a critical membrane protein used in the construction of lipid cell surface rafts called caveolae that facilitate multiple cellular functions including endocytosis, cholesterol homoeostasis and signal transduction and pathways. Caveolae are found in the surface membrane most cell types but their distribution density differs [Citation14]. The human CAV1 gene comprises three exons and is located on Chromosome 7q. A number of gene polymorphism have been identified within this gene and include single nucleotide polymorphisms. In vivo perturbation of caveolae is known to cause insulin resistance. CAV1 rs926198 has been implicated in several pathways related to glycaemia and lipid metabolism in both mice and humans [Citation15] which links to our findings here.
Brain-derived neurotropic factor (BDNF) belongs to a family of neurotrophin factors of secretory molecules that have a major impact on the brain and central nervous system [Citation16]. The gene encoding this molecule is complex and can generate 19 different transcripts through alternative splicing [Citation16]. Post proteolytic processing of BDNF and the receptors binding the mature protein have been reviewed elsewhere [Citation17]. BDNF is widely expressed in a range of tissues. In addition to playing a major role in the development and function of the nervous system, it has been associated with a range of clinical situations affecting body weight including eating disorders [Citation18] obesity and BMI [Citation17]. The relationship of BDNF level with T2 diabetes appears to be complex and potentially related to progressive neurological and behaviours [Citation19]. One particular variant of this gene SNP rs6265 also referred to as Val66Met. The A variant allele of this SNP is potentially biologically relevant as it alters the intracellular processing and activity-dependent secretion of BDNF [Citation20,Citation21].
The fat mass and obesity-associated (FTO) gene has been shown to influence BMI, abdominal circumference and associated symptoms throughout life course at a population level [Citation22–25]. The mode of action of this gene has yet to be fully elucidated and understood, but it has been reported that functional alterations by the gene impact on the HPA axis and influence the reward system within the brain [Citation26,Citation27]. To date, it is unclear which SNP within FTO may be most strongly associated with the modification of BMI and other weight associated symptoms although rs993609 has been the most frequently studied [Citation25].
While a large body of work has been done in recent years to characterize the genomic factors associated both with the development of complications of diabetes and also the development of the various forms of diabetes, less is known about the determinants of weight change in people with T1D and T2D. As obesity is so closely associated with progression of multi-morbidity and its consequences, a clearer understanding of weight gain over time for people living with diabetes is critical. We here describe a preliminary analysis of the way that allelic variation may associate with differences in significant weight change vs weight relatively stable between non-diabetes individuals and those with T1D and T2D.
Materials and methods
Context of the study
Longitudinal clinical data were available from the Diabetes Alliance for Research in England (DARE) (www.diabetesgene.org/currentresearch/dare) study [Citation27]. This was established as an epidemiologically based cohort of individuals living with diabetes and matched non-diabetes individuals, with the aim of achieving a better understanding of how genetic factors influence health outcomes and associated with diabetes.
Participants
Participants were recruited between 2007 and 2017. Consent to access their retrospective and prospective longitudinal health data was given (with ethical permission in place for access until 2043) including biochemical measures and coded health outcomes. Ethics approval for the DARE study was granted by the Southwest (Exeter) NHS Research Ethics Committee [Citation27]. In all, more than 62,000 people were recruited to DARE of whom 6,800 were in the North-West of England. Blood samples were collected mainly between 2007 and 2014. Participants were aged between 18 and 70 y at the point of recruitment and had either been diagnosed with diabetes or had no prior diabetes diagnosis. This study was also reviewed and approved by the Greater Manchester Care Record (GMCR) Expert Research Group (ERG). The access to the healthcare record data was enabled by the Greater Manchester Care Record [Citation28,Citation29] which enabled access to healthcare record data for the consented DARE study participants (GMCR RQ-19).
Clinical assessments
BMI relatively stable individuals were defined as those having a BMI change of ≤+10% over the follow-up period. BMI increase was defined as a BMI change of >+10% over the period of follow-up (). We chose >10% BMI increase as this is very unlikely to be related to natural fluctuations in BMI over time.
Table 1. Description of BMI increase category by diagnosis and by gender.
SNP genotyping
DNA was extracted using QIAamp DNA Mini Blood extraction Kit (Qiagen, Hilden, Germany) from EDTA blood samples taken from all consenting participants and stored at −70°C for future analysis. Genotyping reactions were performed in MicroAmp® Fast Optical 96-Well Reaction Plates with Barcode 0.1 mL, each containing 5 μl of TaqMan® GTpress™ Master Mix 2X (Applied Biosystems), 0.25 μL TaqMan® genotyping assay mix (20X), 2 μl DNA and 2.5 μL of DNAse-free water. Positive controls for each genotype and control without DNA were included in all plates to exclude the possibility of cross-contamination with DNA from another source in some of the reagents and during the manipulation of the experiments.
The reactions were performed according to the following thermocycling program (StepOnePlusTM); stage 1: pre-PCR reading at 60°C for 1 min; stage 2: holding of DNA polymerase activation at 95°C for 20 s; stage 3: 40 cycles of denaturation at 95°C for 3 s and annealing at 60°C for 20 s; stage 4: 10 cycles of post-PCR reading of denaturation at 95°C for 3 s and annealing at 60°C for 20 s. The allelic discrimination analysis was performed using the Taqman® Genotype (Software Real-Time PCR Systems Version 2.0 - Applied Biosystems®, 2007) program, with the specific algorithm compatible with the results generated by the equipment for this polymorphism.
Polymorphism selection
We investigated four genes known to be associated with weight change, glucose handling or insulin signalling: BDNF rs6265, CAV1 rs926198, FTO rs9939609 and LEPR rs1137101.
Participant’s phenotype data were cross referenced with the corresponding DARE ID number and associated genotyping data. This dataset was then cleaned to remove duplicate entries, resulting an initial dataset of 597. We further cleaned this dataset to remove entries without BMI data, and anomalous entries for which the BMI value did not fall within the predefined range of 15–80 kg/m2. This resulted in a dataset consisting of 379 entries. We conducted analysis on the relationship between genes and BMI change stratified as described above. Genotype distributions for each candidate gene SNP were compared for each group. This was conducted for individual allele frequencies. Appropriate Chi-square analyses were applied to the data to determine levels of statistical significance. Genotype distributions were compared using a 2-by-3 chi-square. Each group of genotype proportion is 1-by-3 square. For example, BDNF rs6265 T1 group with a BMI increase of less than 10% is . The expected (E) is calculated by observed numbers (O) in these two 1-by-3 matrices. As such, the 2-by-3 Chi-square can be calculated using the formula below:
The p value is then calculated using the chi-square freedom degree formula and associated the p-value table. Here, the .
Results
Socio-demographic and clinical variables of the participants
BMI increase was greatest in people with T1D with BMI increase similar in T2D and non-diabetes individuals. The mean follow-up duration for females was 17.3 y in the control group, 27.1 y in the T1D group and 16.8 y in the T2D group. The mean follow-up duration for males was 17.1 years in the control group, 27.3 y in the T1 group and 18.3 years in the T2 group.
The total number of people with genotyping and BMI data was 379 (169 female and 210 male) of which 111 were diagnosed with T1D, 222 with T2D and 46 were controls. The mean follow-up duration of females and males was 20.6 and 21.2 y, respectively.
For individuals living with T2D, there were 98 using insulin and 134 not prescribed insulin. Average BMI change for those on insulin was an increase of +4.5 and the average BMI change for those not on insulin was +3.7. Approximately half of the T2D patients on insulin (46.7%) had a BMI change of more than +10% and a third of patients (33.1%) not on insulin had a BMI change of more than +10%.
Associations between genetic factors and weight gain
The total number of participants with BMI data () for this analysis was 379 (46 controls without diabetes, 111 with T1D and 222 T2D). The sex ratio of the study population was 46.0% female and 54.0% male. And, 78.9% of the participants were recorded in the primary care data as ‘British’ or ‘English’. The average age at diagnosis was 45.7 y. Among them, the average diagnosis age for T1D was 32.7 y and the average diagnosis age for T2D was 53.0 y. The average follow-up period in relation to the available data was 19.4 y. Differences between controls, T1D and T2D in terms of genotype frequency were examined (). No significant differences in genotype frequencies were observed between the three groups (T1D, T2D and control groups).
Table 2. Genotype distributions by diagnosis.
Genotype frequency and weight change
Candidate genotype distributions differed by diagnosis for a given BMI change category. For those defined as ‘BMI relatively stable’ (≤10%), controls displayed a difference in genotype distribution vs T1D cases for CAV1 RS926198 and LEPR rs1137101. When T2D individuals were compared with controls, significant differences were observed in genotype distributions for all for 4 genes, BDNF rs6265, CAV1 rs926198, FTO rs9939609 and LEPR rs1137101 (). The genotype distribution was in Hardy–Weinberg equilibrium.
Table 3. Genotype frequency for BMI change category by diagnosis.
For those defined as having a ‘BMI increase ‘>10%, the only difference by category was for LEPR rs1137101 for both T1D and T2D individuals versus non-diabetes individuals ( and ).
Table 4. p-Value for .
Allele frequency and weight change
summarizes the differences in allele frequency for each diagnosis by BMI change category. The allele distribution was in Hardy–Weinberg equilibrium.
Table 5. Allele frequency for BMI change category by diagnosis.
Weight stable individuals
For those defined as BMI stable, for CAV1 rs926198, T1D individuals showed a lower frequency of thymine (T) (p = 0.004) vs non-diabetes individuals and for LEPR rs1137101 a higher frequency of Guanine (G) vs non-diabetes individuals (p = 0.002). For T2D and CAV1 rs926198, T frequency for CAV1 rs926198 was lower in T2D than in non-diabetes individuals (p = 0.005), while for the LEPR rs1137101 G was higher frequency than for non-diabetes individuals (p = 0.004) (). Allele frequencies are also summarized in .
Figure 1. Significantly different Allele Frequencies for BMI change category by diagnosis for the CAV1 rs926198 and LEPR rs1137101 candidate genes.
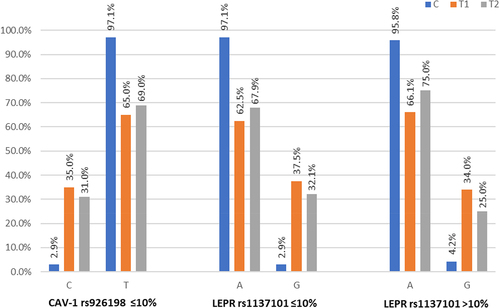
Table 6. Chi-squared and p values for .
BMI increase
For those defined as having a BMI increase (>10%), for LEPR rs1137101 T1D individuals had a higher frequency of the G allele vs non-diabetes individuals (p = 0.0023) as did T2D individuals vs non-diabetes individuals (p = 0.0352) (). Allele frequencies are also shown in .
Discussion
Weight gain in all forms of diabetes can result in higher circulating blood glucose levels and also result in higher blood pressure. This results in a requirement for more intense antihypertensive therapy and more clinical intervention. The root cause of why some people but not others put on substantial amounts of weight as they age has an extremely complex basis.
Some of this is due to vicious cycles of increased sedentary lifestyle due to weight gain leading to more weight gain resulting in more physical inactivity and joint failure. It is also clear that in others there are issues of satiate and apatite control relating to behavioural impulse control. Medication and other co-morbidities also impact on weight gain. Whilst some aspects of weight gain are down to external factors others manifest themselves through genetic variations present in individuals at a population level. This will be the case regardless of whether someone develops diabetes or not. However, weight gain is of critical concern in diabetes as obesity leads. A key question is whether some genetic factors specifically drive weight gain in diabetes patients; if this is the case, can we identify such high-risk diabetes patients at an early stage to proactively advise, monitor and support weight control.
In this study, we have identified an association of the T allele of the CAV1 gene SNP (rs926198) with change in BMI over time in people with diabetes as distinct from people without a diagnosis of diabetes at the time of recruitment to the DARE study. This is a novel finding and clearly merits further investigation in a larger cohort. The CAV1 rs926198 SNP has been previously associated with a metabolic syndrome phenotype [Citation30]. However, this study did not examine this genetic association with weight gain over time after diagnosis of diabetes and so is perhaps not directly comparable to our report. Furthermore, CAV1 rs926198 has previously been implicated in insulin secretion, insulin receptor-mediated signalling and insulin resistance [Citation15] as it has in several pathways related to glycaemia and lipid metabolism in both mice and humans [Citation15] which links to our findings here.
The fact that differences exist between both T1D and T2D individuals vs non-diabetes individuals may actually imply common aetiological factors in all DM individuals. With respect to this, of the T2D individuals in this sample of the DARE cohort, 44% were on insulin. It is therefore possible that this is a linked phenomenon we may be observing and be related to an effect of CAV1 rs926198 on insulin action as it relates to adipogenesis, in people who are administering insulin as part of their treatment regime [Citation31].
However, such genetic studies do not prove any causality and are just providing insight into observed statistical associations. Further studies will be required to investigate such possibilities. It will also be important to examine other polymorphisms within and around the CAV1 gene to establish haplotype combinations and patterns of linkage disequilibrium. Functional studies and examination of this gene should help inform how it is influencing weight gain in people with diabetes and at what stages within the clinical trajectories of impaired glycaemic control and/or increasing insulin resistance it is contributing an effect.
Larger confirmation studies will be required to resolve such relations and whether they can be replicated across a range of ethnicities and influenced by demographic factors that also impact on weight gain and increasing multi-morbidity such as deprivation and diet.
If such genetic associations can be replicated and their predictive value for identifying higher risk individuals for weight gain estimated, this could provide a useful targeted and preventative approach focussed on those with most need.
We also found that the G allele of LEPR gene SNP rs1137101 was associated with weight change in people with T1D or T2D. The associations seen with the G allele of the LEPR SNP rs1137101 were observed with both weight gain and weight relatively stable for T1D and T2D groups versus controls. This is in keeping with previous reports about this allele and its relation to BMI in people prescribed sodium valproate [Citation32] although the GG genotype was associated with less BMI increase over time in that study [Citation33]
A relevant report by Almandia et al. [Citation32] examined potential association of LEPR with both baseline weight and weight change over time in children and adolescents of Arabic heritage treated with the antipsychotic drug Risperidone. The LEPR SNP rs1137101 (G/G homozygotes) was significantly associated with weight gain (BMI z categories) over time when compared to A/A (OR 4.13) and heterozygotes showed nominally significant association with weight change. Whilst this study is in young people treated with an antipsychotic, it is nevertheless an intriguing observation with weight gain over time. Nevertheless, this study supports the hypothesis of an impact of leptin receptor gene variation on antipsychotic weight gain [Citation32]
This study was only made possible by having access to longitudinal clinical data and biological samples from both controls and people living with diabetes. Large longitudinal cohort studies such as UK Biobank [Citation34] have revolutionized epidemiology and already delivered vast outputs of vital information. However, it is important to also realize that some studies benefit most from situations where longitudinal clinical data (and samples) relating from adolescence age onwards. The DARE project is such a study, and this investigation was only made possible by such access. Our plan is to extend the project in due course to much larger number of DARE participants from other sites, with more SNPs included.
Strengths/Weaknesses
A strength is that we have been able to access all primary care follow-up data on those for whom genetic data was available as a subset of the much larger DARE cohort over a period of up to 15 y. We accept that we have only analysed four SNPs so far, but this is the first paper written in relation to a planned programme of work and should be viewed as a pilot project.
This preliminary study has only looked at four SNPs in a proof-of-principle investigation. Nevertheless, it has demonstrated the value of this cohort study and supports the need to access further data and samples already collected by the DARE project for future genomic and epigenomic analyses.
Conclusion
We describe differences in allele frequency between individuals with diabetes and those without diabetes diagnosed at baseline in relation to the likelihood of BMI increase of >10%. It is well established that the G allele of LEPRrs1137101 is associated with weight gain/obesity. However, this is the first report of the polymorphism CAV1rs926198 being associated with weight stability/gain in diabetes.
Disclosure statement
No potential conflict of interest was reported by the author(s).
Data availability statement
The participant data for this study is located in a data safe haven environment. The authors will provide a fully anonymized extract of the original data upon reasonable request.
Additional information
Funding
References
- https://www.diabetes.co.uk/cost-of-diabetes.html; Accessed 14 March 2023.
- Bonadonna RC, De Fronzo RA. Glucose metabolism in obesity and type 2 diabetes. Diabete Metab. 1991 May;17(1 Pt 2):112–9.
- Leitner DR, Frühbeck G, Yumuk V, et al. Obesity and type 2 diabetes: two diseases with a need for combined treatment strategies - EASO can lead the way. Obes Facts. 2017[Epub 2017 Oct 12];10(5):483–492. doi: 10.1159/000480525
- Kivimäki M, Strandberg T, Pentti J, et al. Body-mass index and risk of obesity-related complex multimorbidity: an observational multicohort study. Lancet Diabetes Endocrinol. 2022 Apr [Epub 2022 Mar 4];10(4):253–263. doi: 10.1016/S2213-8587(22)00033-X
- Loos RJF, Yeo GSH. The genetics of obesity: from discovery to biology. Nat Rev Genet. 2022 Feb [Epub 2021 Sep 23];23(2):120–133. doi: 10.1038/s41576-021-00414-z
- Ludwig-Słomczyńska AH, Seweryn MT, Kapusta P, et al. The transcriptome-wide association search for genes and genetic variants which associate with BMI and gestational weight gain in women with type 1 diabetes. Mol Med. 2021 Jan 20;27(1):6. doi: 10.1186/s10020-020-00266-z
- McCaffery JM, Papandonatos GD, Huggins GS, et al. FTO predicts weight regain in the Look AHEAD clinical trial. Int J Obes (Lond). 2013 Dec[Epub 2013 Apr 3];37(12):1545–1552. doi: 10.1038/ijo.2013.54
- Yang MM, Wang J, Fan JJ, et al. Variations in the obesity gene “LEPR” contribute to risk of type 2 diabetes mellitus: evidence from a meta-analysis. J Diabetes Res. 2016 [Epub 2016 Apr 18];2016:5412084. doi: 10.1155/2016/5412084
- Gorska E, Popko K, Stelmaszczyk-Emmel A, et al. Leptin receptors. Eur J Med Res. 2010 Nov 4;15(Suppl 2):50–54. doi: 10.1186/2047-783x-15-s2-50
- Aller R, Primo Martín D, Izaola O, et al. Association of the leptin receptor rs 1805134 polymorphism with obesity parameters, dietary intakes, and metabolic syndrome in Caucasian obese subjects. Nutrición Hospitalaria. 40(1): English:35–40. 2023 Feb 15. 10.20960/nh.04139
- Clément K, Vaisse C, Lahlou N, et al. A mutation in the human leptin receptor gene causes obesity and pituitary dysfunction. Nature. 1998 Mar 26;392(6674):398–401. doi: 10.1038/32911
- Sun Q, van Dam RM, Meigs JB, et al. Leptin and soluble leptin receptor levels in plasma and risk of type 2 diabetes in U.S. women: a prospective study. Diabetes. [Epub 2009 Dec 3] 2010 Mar 59(3):611–618. doi: 10.2337/db09-1343
- Daghestani MH, Daghestani MH, Daghistani MH, et al. The influence of the rs1137101 genotypes of leptin receptor gene on the demographic and metabolic profile of normal Saudi females and those suffering from polycystic ovarian syndrome. BMC Womens Health. 2019 Jan 11;19(1). doi: 10.1186/s12905-018-0706-x
- Parat MO. The biology of caveolae: achievements and perspectives. Int Rev Cell Mol Biol. 2009;273:117–162. doi: 10.1016/S1937-6448(08)01804-2
- Baudrand R, Gupta N, Garza AE, et al. Caveolin 1 modulates aldosterone-mediated pathways of glucose and lipid homeostasis. J Am Heart Assoc. 2016 Sep 28;5(10):e003845. doi: 10.1161/JAHA.116.003845
- Yates A, Akanni W, Amode MR, et al. Ensembl 2016. Nucleic Acids Res. 2016 Jan 4Epub 2015 Dec 19;44(D1):D710–6. doi: 10.1093/nar/gkv1157
- Rosas-Vargas H, Martínez-Ezquerro JD, Bienvenu T. Brain-derived neurotrophic factor, food intake regulation, and obesity. Arch Med Res. [Epub 2011 Sep 22] 2011 Aug 42(6):482–494. doi: 10.1016/j.arcmed.2011.09.005
- Nakazato M, Hashimoto K, Shimizu E, et al. Possible involvement of brain-derived neurotrophic factor in eating disorders. IUBMB Life. 2012 May[Epub 2012 Apr 4];64(5):355–361. doi: 10.1002/iub.1012
- Rozanska O, Uruska A, Zozulinska-Ziolkiewicz D. Brain-derived neurotrophic factor and diabetes. Int J Mol Sci. 2020 Jan 28;21(3):841. doi: 10.3390/ijms21030841
- Chen ZY, Patel PD, Sant G, et al. Variant brain-derived neurotrophic factor (BDNF) (Met66) alters the intracellular trafficking and activity-dependent secretion of wild-type BDNF in neurosecretory cells and cortical neurons. J Neurosci. 2004 May 5;24(18):4401–4411. doi: 10.1523/JNEUROSCI.0348-04.2004
- Egan MF, Kojima M, Callicott JH, et al. The BDNF val66met polymorphism affects activity-dependent secretion of BDNF and human memory and hippocampal function. Cell. 2003 Jan 24;112(2):257–269. doi: 10.1016/s0092-8674(03)00035-7
- Frayling TM, Timpson NJ, Weedon MN, et al. A common variant in the FTO gene is associated with body mass index and predisposes to childhood and adult obesity. Science. 2007 May 11Epub 2007 Apr 12;316(5826):889–894. doi: 10.1126/science.1141634
- Rendo T, Moleres A, Marti Del Moral A. Effects of the FTO gene on lifestyle intervention studies in children. Obes Facts. 2009 Epub 2009 Dec 10;2(6):393–399. doi: 10.1159/000262296
- Tercjak M, Luczyński W, Wawrusiewicz-Kurylonek N, et al. Rola polimorfizmu genu FTO w patogenezie otyłości [The role of FTO gene polymorphism in the pathogenesis of obesity]. Pediatr Endocrinol Diabetes Metab. 2010;16(2): 109–113. Polish.
- Koike S, Richards M, Wong A, et al. Fat mass and obesity-associated (FTO) rs9939609 polymorphism modifies the relationship between body mass index and affective symptoms through the life course: a prospective birth cohort study. Transl Psychiatry. 2018 Mar 13;8(1):62. doi: 10.1038/s41398-018-0110-1
- Zhao X, Yang Y, Sun BF, et al. FTO and obesity: mechanisms of association. Curr Diab Rep. 2014;14(5):486. doi: 10.1007/s11892-014-0486-0
- https://digital.nhs.uk/data-and-information/data-tools-and-services/data-services/hospital-episode-statistics Accessed25 March 2023
- https://www.diabetesgenes.org/current-research/dare/: Accessed 25 March 2023
- https://gmwearebettertogether.com/: Accessed 25 March 2023
- Baudrand R, Goodarzi MO, Vaidya A, et al. A prevalent caveolin-1 gene variant is associated with the metabolic syndrome in Caucasians and Hispanics. Metabolism. [Epub 2015 Sep 12] 2015 Dec 64(12):1674–1681. doi: 10.1016/j.metabol.2015.09.005
- Chang CC, Chen CY, Wen HC, et al. Caveolin-1 secreted from adipose tissues and adipocytes functions as an adipogenesis enhancer. Obesity (Silver Spring). [Epub 2017 Sep 25] 2017 Nov 25(11):1932–1940. doi: 10.1002/oby.21970
- Li H, Wang X, Zhou Y, et al. Association of LEPR and ANKK1 gene polymorphisms with weight gain in epilepsy patients receiving valproic acid. Int J Neuropsychopharmacol. 2015 Mar 3;18(7):yv021. doi: 10.1093/ijnp/pyv021
- Almandil NB, Lodhi RJ, Ren H, et al. Associations between the LEP -2548G/A promoter and baseline weight and between LEPR Gln223Arg and Lys656Asn Variants and Change in BMI z Scores in Arab Children and Adolescents Treated with Risperidone. Mol Neuropsychiatry. 2018 Oct [Epub 2018 Oct 5];4(2):111–117. doi: 10.1159/000490463
- https://www.ukbiobank.ac.uk/; Accessed 5th May 2023