ABSTRACT
Formation of polyploid or aneuploid cells is a pathological hallmark of malignant tumors. Cell cycle checkpoint mechanisms play a crucial role in ensuring genomic integrity during mitosis, avoiding the generation of aneuploid cells. Additionally, cancer cell DNA ploidy is subjected to extrinsic controls operated by activation of adaptive immune responses mediated by T cells. NK cells exert a central role in the innate anticancer immunity; however, the mechanisms involved in the recognition of tumor cells by NK cells have not been fully elucidated. Herein, we report that drug-induced polyploidy in cancer cells activates antitumor responses mediated by NK cells. Thus, hyperploidy-inducing chemotherapeutic agents strongly upregulate the tumor expression of ligands for the NK cell activating receptors NKG2D and DNAM-1. Drug-induced hyperploidy modulated the repertoire of activating receptors and the cytokine profile of NK cells, rendering tumor cells more susceptible to NK cell-mediated lysis through the activation of NKG2D and DNAM-1 receptors. In addition, hyperploidization stimulated the production of IL-2 by CD4 T cells, which induced NK cell proliferation and activity. The stimulation of MICA, a key NKG2D ligand, in hyperploid cells was mainly mediated by ATM protein kinase. Likewise, pharmacological inhibition of key regulators of endoplasmic reticulum stress in certain cell models supports a role for this pathway in NKG2D ligand upregulation. Overall, our findings indicate that, besides the cytotoxic effect on tumor cells, the therapeutic activity of anti-mitotic drugs may be mediated by the induction of a coordinated antitumor immune response involving NK and T cells.
Abbreviations
| CRT | = | Calreticulin |
| FBS | = | Fetal Bovine Serum |
| PBS | = | Phosphate buffered saline |
| PBMCs | = | Peripheral Blood Mononuclear Cells |
| DMSO | = | Dimethyl sulfoxide |
| PMA | = | Phorbol 12-myristate 13-acetate |
| 7-AAD | = | 7-Aminoactinomycin D |
| CFSE | = | 5,6-carboxyfluorescein diacetate succinimidyl ester |
| IL-2 | = | Interleukin-2 |
| CsA | = | Cyclosporine A |
| NKG2D | = | Natural killer group 2, member D |
| DNAM-1 | = | DNAX Accessory Molecule-1 |
| NKp30/44/46 | = | Natural killer cell p30/44/46-related protein |
| MICA/B | = | MHC class I chain-related gene A/B |
| ULBP | = | UL16-binding protein |
| PERK | = | protein kinase RNA-like endoplasmic reticulum kinase |
| ATM | = | Ataxia Telangiectasia Mutated |
| ICD | = | Immunogenic cell death |
| CTL | = | Cytotoxic T cells |
| APCs | = | Antigen-Presenting cells |
Introduction
Polyploidization is a common and early event in many types of cancer, which correlates with the inactivation of TP53 and retinoblastoma.Citation1,2 Studies in yeast and primary mouse fibroblasts have shown that even an extra chromosome results in an additional load of proteins, which may impair cell proliferation enhancing cell lethality.Citation3,4 However, it may also result in genomic instability, eventually endowing cells with new tumor progression capabilities.Citation5 Cell cycle checkpoint mechanisms play a crucial role in ensuring genomic integrity during mitosis, avoiding the generation of aneuploid cells.Citation2 Additionally, a recent report has shown that DNA ploidy is also subjected to extrinsic controls operated by the immune system.Citation6,7 Thus, tetraploidization increases the immunogenicity of tumor cells due to the exposure of the endoplasmic reticulum resident protein calreticulin (CRT) on the surface of cancer cells, which acts as an “eat-me” signal for macrophages and dendritic cells, initiating a T cell response against hyperploid cells in vivo.Citation8-10 The surface exposure of CRT is mediated by the phosphorylation of eukaryotic initiation factor 2α (eIF2α) by PERK protein, which results from an endoplasmic reticulum stress generated in hyperploid cells.Citation11
Natural Killer (NK) cells are innate cells involved in the immune response against virus infection and cancer.Citation12,13 NK cells recognize tumor and infected cells by detecting changes in the expression of ligands of their inhibitory and activating receptors.Citation14-16 The loss of the expression of self-molecules, mainly HLA class I proteins, is detected by an array of inhibitory receptors (i.e., KIRs, CD94/NKG2A). Contrarily, activating receptors (i.e., NKG2D, DNAM-1, NKp30, NKp44 and NKp46) recognize ligands that are upregulated in tumor cells, but are restrictedly expressed in healthy cells. NKG2D is a receptor for MICA/B and ULBP1-6 ligands.Citation17,18 DNAM-1 is a receptor for poliovirus receptor (PVR, CD155) and Nectin-2 (CD112).Citation19,20 HLA-B associated transcript 3 (BAT-3) and B7-H6 bind to NKp30;Citation21 and mixed-lineage leukemia-5 (MLL5) protein has recently been identified as a ligand for NKp44.Citation22 Among NK cell receptors, NKG2D plays a key role in the immune response against cancer.Citation18,23 Genotoxic stress,Citation24 Sp1 transcription factors,Citation25 proliferative and tumor suppressor signaling pathways,Citation26,27 and tumor progressionCitation28,29 are known to induce the expression of NKG2D ligands in cancer cells, initiating an antitumor immune response.Citation30-32
Activated NK cells are capable of killing a broad range of cancers and of regulating the innate and adaptive immune responses through the secretion of cytokines, such as IFN-γ. Despite the relevance of NK cells in cancer immunosurveillance, the mechanisms involved in their activation against cancer cells remain to be fully elucidated. In this study, we report that the induction of hyperploidy by treatment with anti-mitotic drugs increases the immunogenicity of tumor cells,Citation31 rendering them more susceptible to NK cell-driven lysis. Concomitantly, drug-induced hyperploidy also promotes a T cell-mediated response that cooperates with NK cells in the immunity against hyperploid cancer cells.
Results
Drug-mediated generation of hyperploid cells
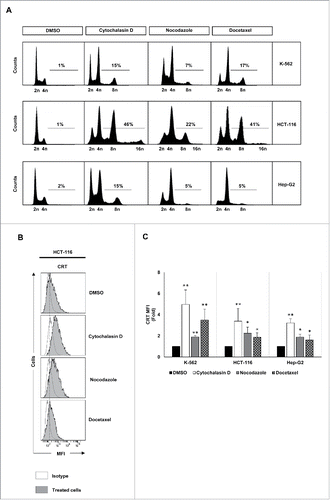
K-562, HCT-116 and Hep-G2 human cancer cells (Table S1) were treated with several polyploidy-inducing chemotherapeutic agents and the effect of these compounds on the cell cycle was analyzed by flow cytometry. Treatment with cytochalasin D, an inhibitor of microfilament polymerization through binding to actin filaments, as well as with nocodazole and docetaxel, both inhibitors of microtubule polymerization, resulted in the accumulation of hyperploid cells (DNA content >4n) (). As previously reported, the acquisition of hyperploidy was associated with CRT exposure on the surface of tumor cells ( and ) and an increased apoptosis (Fig. S1A and B).Citation10
Figure 1. Analysis of DNA content and CRT expression in tumor cells treated with drugs that induce hyperploidy. (A) Representative cell cycle profiles of K-562, HCT-116 and Hep-G2 cells treated with cytochalasin D (0.6 µg/mL), nocodazole (100 nM) or docetaxel (3 nM) for 48 h are reported. Numbers refer to percentage of polyploid (>4n) cells. (B) Cancer cells were treated with cytochalasin D, nocodazole or docetaxel for 48 h and the cell surface expression of CRT was analyzed by flow cytometry. The histograms show a representative experiment performed with HCT116 cells. (C) The graph shows the fold induction ± SEM of the mean fluorescent intensity (MFI) of CRT on the cell surface of K-562, HCT-116 and Hep-G2 cells (at least three independent experiments were performed; *p < 0.05; **p < 0.01, Mann–Whitney U test).
Induction of hyperploidy enhances the expression of ligands for NK cell-activating receptors in cancer cells
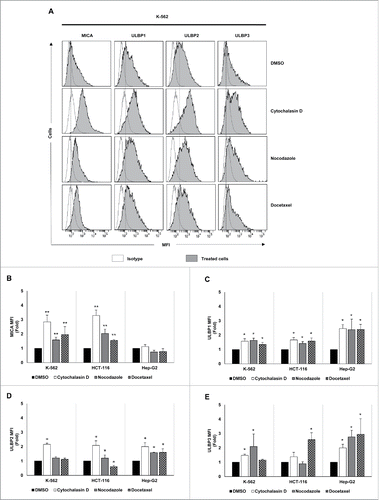
The effect of drug-induced hyperploidy on the tumor expression of human ligands of activating immune receptors (NKG2D, DNAM-1 and NKp30) was next analyzed by flow cytometry (Table S2). Despite some cell line and drug-specific differences, an upregulation of NKG2D ligand expression was detected on the surface of the three cancer cell lines analyzed (). MICA was mainly induced in K-562 and HCT-116 cells, whereas Hep-G2 cells exhibited a stronger upregulation of ULBP1-3 ligands.
Figure 2. NKG2D ligand expression increases in cancer cells upon treatment with drugs that induce hyperploidy. (A) Cancer cells were treated with the hyperploidy-induced drugs, nocodazole or docetaxel for 48 h and the membrane expression of MICA, ULBP1, ULBP2 and ULBP3 was evaluated by flow cytometry. The histograms of one representative experiment with K-562 cells are shown. Isotypes for each condition are shown as empty histograms and treated cells are represented as gray histograms. (B–E) K-562, HCT-116 and Hep-G2 cells were treated as detailed in (A) and NKG2D ligand surface expression was monitored by flow cytometry. The bars represent the mean of the fold induction ± SEM of the MFI of the treated cells relative to the vehicle-treated control (at least three independent experiments were performed; *p < 0.05; **p < 0.01).
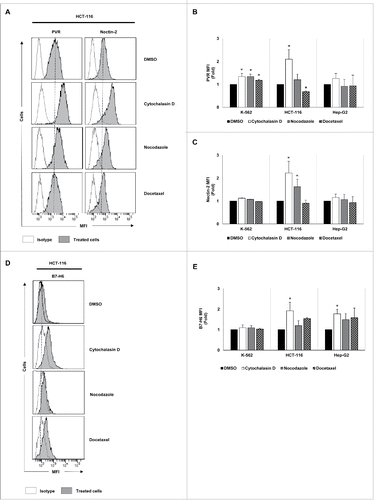
Likewise, a significant increase in the levels of DNAM-1 ligands (PVR and Nectin-2) was observed in HCT-116 cells, particularly in response to cytochalasin D treatment (). Additionally, PVR expression was also enhanced in K-562 cells (). The expression of the NKp30 ligand B7-H6 was upregulated in HCT-116 and Hep-G2 cells cultured in the presence of cytochalasin D (). No marked effect was observed on the expression of the NK cell inhibitory HLA class I molecules (Fig. S1C).
Figure 3. Analysis of the tumor expression of DNAM-1 and NKp30 ligands upon treatment with drugs that induce cell hyperploidy. K-562, HCT-116 and Hep-G2 cells were treated with cytochalasin D, nocodazole or docetaxel for 48 h, and the membrane expression of PVR (A and B), Nectin-2 (A and C) and B7-H6 (D and E) was analyzed by flow cytometry. (A and D) A representative experiment performed in HCT-116 cells is included. Isotypes for each condition are shown as empty histograms and treated cells are shown as gray histograms. (B, C and E) The bars represent the mean of the fold induction ± SEM of the MFI of the treated cells relative to the vehicle-treated control (at least three independent experiments were performed; *p < 0.05; **p < 0.01).
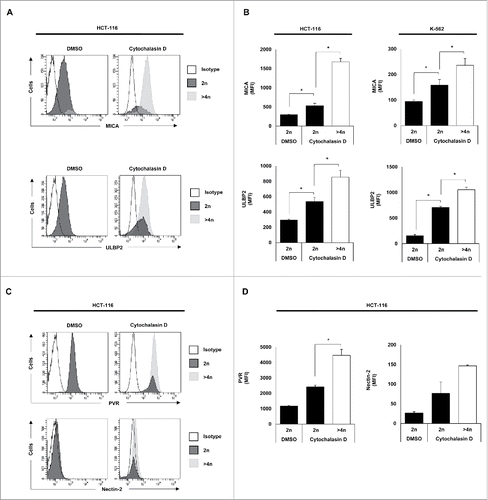
Of note, a significant induction of NKG2D (MICA and ULBP2) and DNAM-1 (PVR and Nectin-2) ligand expression was observed in hyperploid cells (DNA content >4n) compared with diploid cancer cells upon treatment with cytochalasin D and nocodazole ( and Fig. S1D), supporting that drug-induced polyploid cancer cells express higher levels of NK cell activating ligands.
Figure 4. NK cell activating ligands are upregulated in polyploid cancer cells. Cancer cells were treated with cytochalasin D and DNA content and membrane expression of MICA, ULBP2, PVR and Nectin-2 were simultaneously assessed by flow cytometry upon Hoechst 33342 staining. (A and C) The histograms of one representative experiment performed with HCT-116 cells are shown. (B and D) The bars represent the MFI ± SEM of MICA and ULBP2 (B) and PVR and Nectin-2 (D) expression detected for each DNA content (2n vs. >4n) of cancer cells treated or not with cytochalasin D (at least three independent experiments were performed; *p < 0.05).
Hyperploid cancer cells modulate the immune phenotype and induce the cytotoxic activity of NK cells
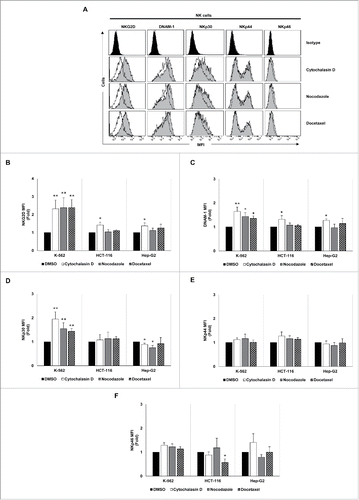
Given the increased levels of NKG2D and DNAM-1 ligands observed in cancer cells upon treatment with polyploidy-inducing agents, we next studied whether NK cell activity is modulated by the exposure to hyperploid cancer cells. Thus, PBMCs from healthy donors were co-cultured with hyperploid tumor cells treated with cytochalasin D, nocodazole or docetaxel, and the expression of IFN-γ was measured by intracellular staining and flow cytometry analysis. As shown in , IFN-γ expression was induced in NK cells, CD8 T cells and CD3+CD8+CD56+ T cells when PBMCs were co-cultured with cytochalasin D-treated tumor cells. Accordingly, drug-induced hyperploidy increased the susceptibility of cancer cells to NK cell-mediated killing, as demonstrated by in vitro cytotoxicity assays ( and Fig. S2A). This effect was more pronounced in Hep-G2 cells, in which a significant increase of NK cell-mediated lysis was observed with the three anti-mitotic drugs used ( and Fig. S2A). No marked effect on the susceptibility of docetaxel- and nocodazole-treated K-562 or HCT-116 cells to NK cell cytotoxicity was observed (not shown). Such stimulation of the cytotoxic activity was inhibited by NKG2D and DNAM-1 blocking antibodies (), but not by using an NKp30 blocking antibody (Fig. S2B), supporting the relevance of NKG2D and DNAM-1 signaling for the NK cell-recognition of hyperploid cancer cells. Moreover, the interaction with drug-induced polyploid cancer cells also modulated the NK-cell expression of several activating receptors (mainly NKG2D, DNAM-1 and NKp30) (), although the levels of NKp44 and NKp46 on the surface of NK cells were, however, not substantially modified ().
Figure 5. Exposure to drug-induced polyploid cancer cells stimulates the IFN-γ production and the cytotoxic activity of NK cells. (A) PBMCs from healthy donors (n = 4) were co-cultured with K-562 cells treated with cytochalasin D and the intracellular expression of IFN-γ was analyzed in NK, CD3+CD8+CD56+, CD8 T cells and CD4 T cells by flow cytometry. A representative histogram of IFN-γ producing NK cells under these conditions is shown. The graph shows the % of IFN-γ positive cells ± SEM (*p < 0.05). (B) Control and cytochalasin-induced hyperploid cancer cells were co-cultured with NK cells at an E:T ratio of 2:1, 10:1 and 20:1 for 4 h, and the cytotoxic activity of NK cells was evaluated by flow cytometry. Results are expressed as the percentage of specific lysis ± SEM (*p < 0.05). (C) Cytotoxic activity of NK cells against control and treated Hep-G2 cells in the presence of NKG2D and DNAM-1 blocking antibodies. Results are expressed as the percentage of specific lysis ± SEM of four independent experiments (*p < 0.05).
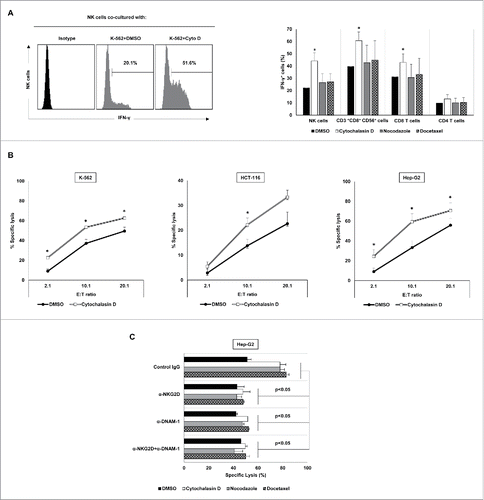
Figure 6. NK cell immune phenotype is modulated upon co-culture with drug-induced polyploid cancer cells. (A) NK cells isolated from healthy donors (n = 4) and expanded 5 days with IL-2 were co-cultured with control and drug-induced K-562 cells for 48 h and the expression of NKG2D, DNAM-1, NKp30, NKp44 and NKp46 receptors was analyzed on the surface of NK cells (CD3−CD56+) by flow cytometry. The histograms of one representative donor co-cultured with hyperploid K-562 cells are shown. Untreated cells are shown as empty histograms and treated cells are shown as gray histograms. (B–F) The graphs show the fold induction ± SEM of the MFI of the molecules analyzed in treated cells relative to the vehicle-treated controls (*p < 0.05; **p < 0.01).
In summary, our data indicate that drug-induced polyploidy activates NK cells, enhancing their ability to recognize and eliminate tumor cells.
Drug-induced cancer cell hyperploidy stimulates NK cell proliferation through the activation of CD4 T cells
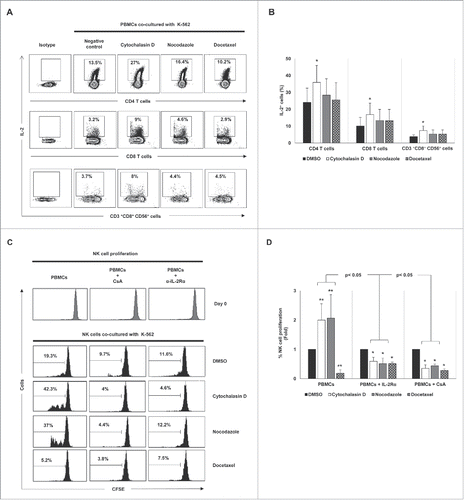
The effect of drug-induced hyperploidy on the proliferation of lymphocytes was next analyzed. To this end, CFSE-stained PBMCs obtained from healthy donors were co-cultured with control and treated cancer cells and the proliferation of the different lymphocyte subsets was determined by flow cytometry. Co-culture with K-562 cells exposed to cytochalasin D or nocodazole, but not to docetaxel, significantly increased the proliferation of NK cells and CD3+CD8+CD56+ T cells, with no marked effect observed on CD4+ or CD8+ CD56− T cells (). Noteworthy, depletion of non-NK immune cells by negative selection completely abrogated the induction of NK cell proliferation, supporting the idea that this effect was indirect and dependent on a different lymphocytic population (). Given that IL-2 is a cytokine mainly produced by T cells that is crucially involved in the proliferation of NK cells, we next analyzed the effect of hyperploid malignant cells on the production of IL-2 by immune cells. Co-culture with K-562 cells treated with cytochalasin D and nocodazole stimulated the synthesis of IL-2 by CD4+ T cells and, in a lesser extent, by CD8+ T cells and CD3+CD8+CD56+ cells (). No production of IL-2 by NK cells was detected (not shown). Moreover, treatment of PBMCs from healthy donors with an anti-IL-2 receptor blocking antibody or cyclosporine A, an immunosuppressant drug that inhibits IL-2 production by T cells, completely abrogated NK cell proliferation (), indicating that the production of IL-2 by T cells, mainly by CD4 T cells, was essential for NK cell expansion.
Figure 7. Effect of exposure to drug-induced hyperploid cancer cells on the proliferation of immune cell subsets. (A) PBMCs (n = 6) (left histograms) or purified NK cells (n = 4) (right histograms) isolated from healthy donors were labeled with CFSE and co-cultured with hyperploid-K-562 cells for seven days. CFSE expression on NK cells, CD3+CD56+CD8+ T cells, CD8+ T cells and CD4+ T cells was examined by flow cytometry at day 0 and day 7. The histograms on the right represent the results obtained with purified NK cells. One representative experiment is shown. (B) The graph shows the mean of the fold induction ± SEM of the percentage of proliferative NK and CD3+ CD8+CD56+ cells relative to the negative control obtained in the experiments using PBMCs (*p < 0.05; **p < 0.01). (C) Results are expressed as the mean of the fold induction ± SEM of the percentage of proliferative NK cells relative to the vehicle-treated control obtained in the experiments using purified NK cells (n = 4; *p < 0.05; **p < 0.01).
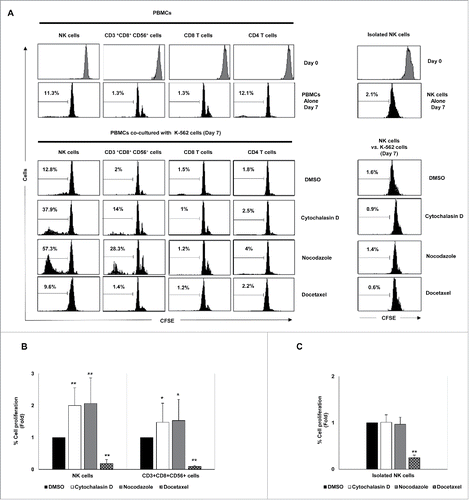
Figure 8. Cancer cell hyperploidy induced by chemotherapeutic drugs stimulates IL-2 production by CD4 T cells and triggers NK cell proliferation. (A) PBMCs obtained from four donors were co-cultured with hyperploid cells and the intracellular levels of IL-2 were measured in different lymphocyte subsets. The cytometric profiles show the percentage of IL-2 positive CD4 T cells, CD8 T cells and CD3+CD56+CD8+ cells. (B) Results are expressed as the percentage ± SEM of IL-2 positive cells (*p < 0.05). (C) PBMCs from healthy donors (n = 4) were stained with CFSE and co-cultured with K-562 hyperploid cells in the presence or absence of CsA (1 µM) or anti-IL-2Rα blocking antibody (15 µg/mL) for seven days. The histograms show the results of the CFSE expression of NK cells from one representative donor. (D) Results are expressed as the fold induction ± SEM of the percentage of proliferative NK cells relative to the vehicle-treated control under the conditions detailed in (B) (n = 4; *p < 0.05; **p < 0.01).
Stress signaling pathways are involved in the upregulation of MICA in polyploid cancer cells
The molecular mechanisms involved in the upregulation of MICA in hyperploid tumor cells were next studied. It has been shown that hyperploid cells exhibit a constitutively elevated level of ER stress.Citation10,32 Indeed, an increased amount of phosphorylated eIF2α was observed in HCT-116 cells treated with cytochalasin D compared with control cells, although no significant changes were detected in K-562 cells (). To gain insight into the relevance of the ER stress response in the stimulation of NK-cell activating ligands in polyploid cancer cells, HCT-116 cells were treated with a specific PERK inhibitor (GSK2606414, 1 µM)Citation33 and the expression of MICA was evaluated by flow cytometry. Treatment with GSK2606414 reduced the levels of phosphorylated eIF2α upon exposure to cytochalasin D (Fig. S2C). Concomitantly, inhibition of PERK attenuated the upregulation of MICA expression in cytochalasin D-treated HCT-116 ( and Fig. S2D). Of note, the surface levels of HLA class I molecule did not change as a consequence of the treatment, supporting the specificity of the effect observed on MICA expression upon PERK inhibition (Fig. S2E). Moreover, treatment with salubrinal, an inhibitor of eIF2α dephosphorylation and protector of ER stress,Citation34 also resulted in the downregulation of MICA expression in the presence of cytochalasin D (Fig. S2F).
Figure 9. Molecular mechanisms underpinning the upregulation of MICA in cancer cells by hyperploidy-inducing agents. (A) K-562 and HCT-116 cells were exposed to cytochalasin D (0.6 µg/mL) for 48 h and the levels of total and phosphorylated eIF2α (Ser51) were evaluated by immunoblotting (R.U. indicates relative units). Quantification and a representative blot of three independent experiments are shown (*p < 0.05). (B) HCT-116 cells were treated with a PERK inhibitor (GSK2606414, 1 µM) for 2 h before the induction of polyploidy with cytochalasin D and the presence of MICA on the cell surface was evaluated by flow cytometry. Results are expressed as the mean of the fold induction ± SEM of the MFI of MICA in treated cells relative to that of vehicle-treated control cells (n = 4; *p < 0.05). (C and D) K-562 and HCT-116 cells were treated with the ATM inhibitor KU55933 (10 µM) 1 h before treatment with cytochalasin D and the presence of MICA on the cell surface was evaluated by flow cytometry after 48 h. Results are expressed as the mean of fold induction ± SEM of the MFI of cells treated relative to the vehicle-treated control (n = 3; *p < 0.05). (E and F) K-562 and HCT-116 cells were transfected with a plasmid expressing an ATM shRNA or with the mock vector and the expression of MICA was evaluated by flow cytometry 48 h after cytochalasin D treatment. Results are expressed as the mean of fold induction ± SEM of the MFI of cells treated relative to the vehicle-treated control (n = 3; *p < 0.05,). (G) K-562 cells were treated with the ATM inhibitor KU55933 (10 µM) and co-cultured with purified NK cells at an E:T ratio 10:1 for 4 h. The cytotoxic activity of NK cells was evaluated by flow cytometry. The graph shows the percentage of specific lysis. Results are the average of four different experiments ± SEM (*p < 0.05).
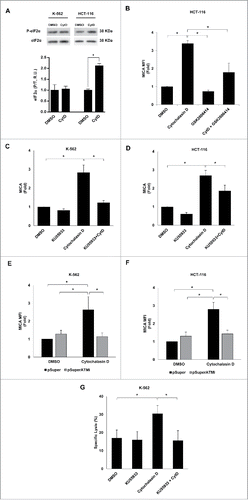
Likewise, induction of hyperploidy also triggers DNA damage stress responses,Citation35 a relevant mechanism that is known to upregulate MICA expression by activating ATM and PI3K pathways.Citation24,36 Treatment of K-562 cells with LY-294002, a PI3K blocker, did not markedly change the induction of MICA (data not shown). However, exposure to the ATM inhibitor KU55933 completely abrogated the induction of MICA on the surface of cytochalasin D treated K-562 and HCT-116 cells (). Accordingly, depletion of ATM expression by transfection of HCT-116 and K-562 cells with a plasmid expressing a specific shRNA reduced the upregulation of MICA upon cytochalasin D treatment ( and Fig. S2G). Furthermore, pharmacological inhibition of ATM in cancer cells treated with cytochalasin D dramatically reduced the specific NK cell-mediated killing of tumor cells (), revealing a key role for ATM in the induction of the immunogenicity observed in hyperploid tumor cells.
Together, these experiments show that the DNA damage and, in certain cell lines, the ER stress responses are involved in the upregulation of MICA expression and, subsequently, in the enhanced susceptibility of drug-induced hyperploid cancer cells to NK-cell mediated killing.
Discussion
Polyploidization is an early event in the tumorigenic process observed in many types of cancers.Citation1,2 Cell cycle control mechanisms play a crucial role in ensuring genomic integrity during mitosis avoiding hyperploidy. Additionally, it has recently been reported that DNA ploidy is also subjected to an extrinsic control by the immune system, which eliminates hyperploid cells through the induction of antitumor T cell responses.Citation10 Herein, we show that the induction of hyperploidy also stimulates the cancer immunosurveillance mediated by NK cells. The activation of NK cells in response to drug-induced hyperploid cancer cells was not associated with the loss of ligands for NK cell inhibitory receptors, such as HLA class I molecules. Instead, malignant cells exposed to polyploidy-inducing agents showed a significant increase in the expression of ligands for NK cell activating receptors, particularly NKG2D and DNAM-1. Indeed, the expression of MICA and ULBP2 was strongly correlated with the cell DNA content, providing a link between cancer ploidy and antitumor NK cell-dependent responses. Additionally, co-culture with hyperploid cancer cells induced the expression of NKG2D and DNAM-1 on NK cells, and experiments performed using blocking antibodies highlighted the relevance of these receptors in the cytotoxic response of NK cells against polyploid cancer cells. Altogether, we describe herein that, additionally to oncogenes, proliferative, tumor progression and stress signals, which are known to regulate NKG2D ligands expression in cancer,Citation26-30 the induction of hyperploidy is involved in the activation of the NKG2D-mediated cancer immunosurveillance.
Hyperploidy triggers the DNA damage response (DDR), which enhances the expression of NKG2D ligands through the activation of ATM/ATR.Citation24,35,36 Our experiments show that genetic and pharmacological inhibition of ATM reduces the expression of MICA, clearly indicating that the DDR mediates the induction of NKG2D ligands expression upon drug-induction of hyperploid cancer cells. Likewise, we describe herein that the ER stress response is a mechanism complementary to the DDR in certain cell models that is involved in the NK cell recognition of drug-induced polyploid cancer cells. This observation adds to a recent report showing that the ER stress elicits the exposure of CRT at the cell surface, eventually stimulating the T cell-mediated immune recognition of hyperploid tumor cells.Citation10,32
In addition to the activation of NK cells, our study unveils a cooperative effect between T and NK cells in the immunosurveillance to cancer cell ploidy. Co-culture of hyperploid cells with immune cells significantly induced the production of IL-2 by T cells, mainly by CD4 T cells, increasing NK cell proliferation. Notably, such stimulation was completely abrogated in the absence of T cells, showing that this effect on the proliferation was not directly exerted on NK cells. Of note, K-562 cells do not express HLA class I or class II molecules,Citation37 supporting that the immune response observed was not mediated by alloreactivity against MHC antigens expressed on tumor cells. It has been shown that hyperploid cancer cells are strong activators of T cell responses.Citation8-10 Tetraploidization increases the exposure of CRT on the surface of cancer cells, which acts as an “eat-me” signal for APCs. Thus, the activation of CD4 T cells is likely to be mediated by the phagocytosis of drug-induced hyperploid cancer cells by APCs that are in the PBMCs and the presentation of tumor antigens to CD4 T cells. Nevertheless, the lack of proliferation of activated CD4 T cells observed in our study suggests a more complex interaction between CD4 T cells and hyperploid-induced tumor cells that warrants further investigation.
IL-2 is a key cytokine involved in the activation and proliferation of NK cellsCitation38 and, accordingly, the blockade of IL-2 secretion using CsA or an anti-IL-2Rα blocking antibody completely abrogated NK cell proliferation, indicating a role for T cells in the production of this cytokine and, therefore, in the proliferation of NK cells observed. Thus, our results clearly support that polyploidization ignites a coordinated immune response against tumor cells mediated by the cooperation between T and NK cells. This idea is also supported by clinical observations showing that treatment with taxanes, which are hyperploidy-inducing agents that inhibits microtubule polymerization, led to an increase in serum IL-2 and an enhancement of NK cell activity in patients with advanced breast cancer.Citation39 Moreover, a recent study shows that docetaxel increased the surface expression of CRT without undergoing immunogenic cell death, and induced an immunogenic modulation, demonstrating significantly increased sensitivity to antigen-specific CTL killing.Citation40
Despite the fact that cancer has been considered as an immunologically silent entity for decades, it is now clearer that beyond cell- and tissue-specific mechanisms, the immune system contributes to the defense against tumors. The characteristics of cancer cells that make them distinguishable from healthy cells and, thus, recognizable by the immune system are an intense field of research. Acquisition of an abnormal number of chromosomes is one of these characteristics that may trigger the immunosurveillance response.Citation7-9 In this sense, polyploidization increases the immunogenicity of tumor cells, initiating an antitumor T cell response that may recognize tumor antigens expressed by cancer cells. Consequently, hyperploid tumors formed in immunocompetent mice display a decreased nuclear size and DNA content.Citation8-10 Our study extends this observation demonstrating that NK cells may also mediate this response by detecting danger molecules (i.e., NKG2D and DNAM-1 ligands) highly expressed on the surface of hyperploid cancer cells.
Material and methods
Cell lines, cell culture and treatments
K-562 (chronic myelogenous leukemia), HCT-116 (colorectal carcinoma), Hep-G2 (hepatocellular carcinoma) and NKL cells were obtained from the American Type Culture Collection (ATCC). K-562 and NKL cells were cultured in RPMI-1640 (Lonza, BE12-702F). HCT-116 and Hep-G2 were cultured in DMEM (Lonza, BE12-604F). Medium was supplemented with 10% heat-inactivated FBS (Sigma, F7524), 1 mM pyruvate (BioWest, L0642), 100 U/mL penicillin and 100 µg/mL streptomycin (Lonza, 17-602E). In the case of NKL cells, the medium was also supplemented with 50 U/mL of recombinant human IL-2 (Peprotech). Cell cultures were maintained at 37°C in 5% CO2.
Cell hyperploidy was induced by treatment with 0.6 µg/mL cytochalasin D, 100 nM nocodazole or 3 nM docetaxel (all from Sigma, C8273, M1404 and 01885 respectively) for 48 h. In some experiments, cells were treated with 20 µM salubrinal (Sigma, SML0951), 1 µM GSK2606414 (Selleckchem, S7307), 10 µM LY-294002 (Sigma, L9908) or 10 µM KU55933 (Tocris, 3544).
Peripheral blood mononuclear cells (PBMCs) were purified by Ficoll®-HistoPaque-1077 (Sigma, 10771) gradient centrifugation from freshly isolated blood obtained from buffy coats. NK cells were isolated from PBMCs using the EasySep® NK Cell Enrichment kit (StemCell Technologies, 19055). The purity of NK cells (∼90 to 95%) was assessed by flow cytometry. PBMCs or purified NK cells were grown in RPMI-1640 supplemented with 10% FBS, 2 mM L-glutamine, 1 mM pyruvate, penicillin and streptomycin. In some experiments, cells were treated with recombinant human IL-2 (Peprotech), anti-human IL-2 receptor (IL-2 sRα) blocking antibody (R&D systems) or cyclosporine A (CsA) (Sigma, C3662).
Flow cytometry
Cell surface protein expression was evaluated by flow cytometry using the following primary antibodies: Calreticulin (sc-6468-R, Santa Cruz Biotechnology), MICA (MAB13002, R&D Systems), ULBP1 and ULBP2 (Bamomab, Cat.No. AUMO2 and BUMO1), ULBP3 (MAB1517, R&D Systems), Nectin-2 and PVR (Clon TX31 and clon SKIL4, Biolegend), B7-H6 (MAB7144, R&D Systems) and HLA class I (W6/32). After washing, cells were stained with a phycoerythrin (PE)-conjugated secondary antibody or fluorescein isothiocyanate (FITC)-conjugated secondary antibody (AbD Serotec).
To determine immune cell subsets, cells were stained with anti-CD3-FITC, anti-CD4-PerCP, anti-CD8-CFBlue, anti-CD56-APC (all from Immunostep) and anti-CD56-PECy7 (eBiosciences) antibodies. The populations of immune cells were defined as follows: CD4 T cells were defined as CD3+CD4+, CD8 T cells were defined as CD3+CD8+, NK cells were defined as CD3−CD56+. NK cell receptors were detected by using anti-human NKG2D-PE (Miltenyi Biotec), DNAM-1-PE, NKp30-APC, NKp44-APC and NKp46-Pacific Blue (all from Biolegend) antibodies.
For intracellular quantification of IFN-γ and IL-2, co-cultures of PBMCs and hyperploid cells were incubated in culture media with GolgiPlug (BD Biosciences, 555029), 50 ng/mL phorbol myristate acetate (Sigma, P8139) and 1 µg/mL ionomycin (Sigma, I9657) for 5 h. Cells were stained for surface antigens (CD3, CD4, CD8 and CD56) and incubated with a fixation/permeabilization solution (BD Biosciences, Cytofix/Cytoperm, 555028) prior to the staining with anti-human IFN-γ-PE or IL-2-PE antibodies (Biolegend). Cell viability and apoptosis were evaluated by staining with 7-amino-actinomycin D (7-AAD, Sigma) and annexin V-FITC (Immunostep) following the manufacturer's protocols. Cells were analyzed in a BD FACS Canto II™ flow cytometer and data were analyzed by using the FACS Diva software.
Cell cycle analysis and cell proliferation assay
Cell cycle was analyzed by resuspending cells in 100 μL of PBS containing 100 μg/mL RNAse A and incubated for 15 min at room temperature. Nuclei were stained by adding 400 μL of propidium iodide solution (50 μg/mL in 0.1% sodium citrate)Citation42; and cells were analyzed by flow cytometry. To simultaneously study cell cycle and MICA expression, cancer cells, previously stained with a monoclonal MICA antibody, were resuspended in 0.5 mL of culture medium and, then, Hoechst 33342 (Life Technologies; 10 μg/mL) was added and cells were incubated for 45 min at 37°C cells. Cell cycle and MICA expression analyses were carried out by flow cytometry.
PBMCs or NK cells from healthy donors were labeled with 1 µM CFSE (Sigma, 21888) for 10 min at 37°C. Labeling was stopped with 5 volumes of cold complete media containing 10% FBS. After 2 washes, cells were co-cultured in complete media with control and treated target cells at a ratio of 10:1 (PBMCs/NK cell:hyperploid cell) for 7 days. After culture, cells were stained for CD3, CD4, CD8 and CD56 expression and the proliferation of different immune cell subsets was determined by flow cytometry. Cell proliferation was analyzed based on the decrease in CFSE staining as a result of the dilution of the dye with each cell division.
NK cell and hyperploid tumor cell co-cultures
NK cells isolated from healthy donors and expanded for 5 days in the presence of recombinant IL-2 (100 ng/mL) were co-cultured with cancer cells previously treated with hyperploidy-inducing agents at a ratio of 1:5 (NK cell:hyperploid tumor cell) for 48 h. After incubation, samples were stained for CD3, CD56, NKG2D, DNAM-I, NKp30, NKp44 and NKp46 and analyzed in a BD FACS Canto II™ flow cytometer and data were analyzed by FACS Diva software.
In vitro NK-mediated cytotoxicity assays
The analysis of the susceptibility of cancer cells to NK-mediated lysis was performed as described previously.Citation43 K-562, HCT-116 and Hep-G2 cells were labeled with 5 µM CFSE and seeded in 24-well plates. The day after, fresh complete media with DMSO (vehicle), cytochalasin D (0.6 µg/mL), nocodazole (100 nM) or docetaxel (3 nM) was added as indicated. After 48 h of treatment, effector NK cells were added and co-cultured with the target cells for 4 h. Blocking experiments were performed by incubating NK cells with α-NKG2D (sc-53501, Santa Cruz Biotechnology), α-DNAM-1 antibodies (BD Biosciences) and α-NKp30 (Biolegend) or a control IgG (sc-2025, Santa Cruz Biotechnology), all at 15 µg/mL for 1 h prior to the co-culture with target cells. Afterwards, cells were stained using 7-AAD to test cell viability, and the percent of specific NK-mediated lysis was measured on a flow cytometer using the following formula: % NK-specific lysis = (% 7-AAD staining of sample – % 7-AAD staining of negative control)/(100% 7-AAD staining of negative control) × 100.
Transient tranfection of an ATM shRNA
K-562 cells were transfected with the pSuper.ATMi or the empty pSuper plasmids (Addgene) using lipofectamine LTX (Life Technologies, 15338-100), following the manufacturer's recommendations. After 72 h, cells were treated with cytochalasin D for 48 h and, then, the expression of MICA was assessed by flow cytometry. Relative gene expression levels of ATM were analyzed by real-time quantitative PCR. Primer sequences were: ATM forward primer 5′-TGGCTACAG ATTGCAACCCAA-3′; and ATM reverse primer 5′-TGGTGTACGTTCCCCATGTC-3′. The amplifications were done using the SYBR Green PCR Master Mix (Applied Biosystems) and GAPDH gene was used for normalizing the cDNA concentration of each sample using the following primers: forward primer 5′-CGGAGTCAACGGATTTGGTC-3′; and reverse primer 5′-AATCATATTGGAACATGTAAACCATGTAGT-3′. All real-time PCR reactions were performed using the ABI 7300 sequence detection system (Perkin-Elmer Applied Biosystems) and the relative quantification in gene expression was determined following the 2−ΔΔCt method.
Western blotting
To obtain total protein extracts, cells were lysed in 50 mM Tris (pH 7.4), 150 mM NaCl, 0.1% SDS, 1% Triton X-100, 1 mM EDTA, 10 mM NaF, 1 mM dithiothreitol, complete inhibitor mixture (Roche Applied Science) and phosphatase inhibitor cocktail (PhosSTOP, Roche). Soluble proteins were then separated by centrifugation at 15,000 × g for 5 min at 4°C. Protein concentration was determined using BCA assay (Pierce). Following heat denaturation, samples containing 5 μg of protein were loaded on 10% SDS-PAGE gels. Proteins were then transferred to Immobilon-FL polyvinylidene fluoride membranes (Millipore) and stained with Ponceau to verify that similar amounts of protein had been loaded. Blots were blocked with 3% nonfat milk in TBS-T buffer (20 mM Tris at pH 7.4, 150 mM NaCl, 0.05% Tween 20), and incubated overnight at 4°C with antibodies against phospho-eIF2α (1:1000, Cell Signaling) and eIF2α (1:500, BioLegend). Finally, blots were incubated with 1:10,000 secondary antibody conjugated with horseradish peroxidase (HRP) (Jackson ImmunoResearch Laboratories) in 1.5% nonfat milk in TBS-T. Immunoreactive bands were developed with Immobilon Western chemiluminescent HRP substrate (Millipore).
Statistical analysis
Continuous variables were compared with Mann–Whitney U test. The p values <0.05 were considered statistically significant.
Disclosure of potential conflicts of interest
No potential conflicts of interest were disclosed.
1074378_supplemental_files.zip
Download Zip (279.7 KB)Acknowledgments
A.L.S. holds a Sara Borrell postdoctoral fellowship from the “Instituto de Salud Carlos III”, Spain. A.R.F. is a recipient of a Juan de la Cierva postdoctoral fellowship from the Spanish MINECO.
Funding
This work was supported by the Spanish grant from PI12/01280 from the Instituto de Salud Carlos III and the FEDER program of the European Community, and, in part, by the Spanish grant from the “Fondo de Investigaciones Sanitaria”, FEDER European Union (PI12/02587), and from “Red de Investigación Renal” REDinREN RD12/0021/0021.
References
- Davoli T, de Lange T. The causes and consequences of polyploidy in normal development and cancer. Annu Review Cell Dev Biol 2011; 27:585-610; PMID:21801013; http://dx.doi.org/10.1146/annurev-cellbio-092910-154234
- Gordon DJ, Resio B, Pellman D. Causes and consequences of aneuploidy in cancer. Nat Rev Genet 2012; 13:189-203; PMID:22269907; http://dx.doi.org/10.1038/ngr3123
- Torres EM, Sokolsky T, Tucker CM, Chan LY, Boselli M, Dunham MJ, Amon A. Effects of aneuploidy on cellular physiology and cell division in haploid yeast. Science 2007; 317:916-24; PMID:17702937; http://dx.doi.org/10.1126/science.1142210
- Williams BR, Prabhu VR, Hunter KE, Glazier CM, Whittaker CA, Housman DE, Amon A. Aneuploidy affects proliferation and spontaneous immortalization in mammalian cells. Science 2008; 322:703-9; PMID:18974345; http://dx.doi.org/10.1126/science.1160058
- Torres EM, Williams BR, Amon A. Aneuploidy: cells losing their balance. Genetics 2008; 179:737-46; PMID:18558649; http://dx.doi.org/10.1534/genetics.108.090878
- Senovilla L, Galluzzi L, Marino G, Vitale I, Castedo M, Kroemer G. Immunosurveillance against cancer-associated hyperploidy. Oncotarget 2012; 3:1270-1; PMID:23174699; http://dx.doi.org/10.18362/oncotarget.753
- Senovilla L, Galluzzi L, Castedo M, Kroemer G. Immunological control of cell cycle aberrations for the avoidance of oncogenesis: the case of tetraploidy. Annal New York Acad Sci 2013; 1284:57-61; PMID:23651194; http://dx.doi.org/10.1111/nyas.12072
- Obeid M, Tesniere A, Ghiringhelli F, Fimia GM, Apetoh L, Perfettini JL, Castedo M, Mignot G, Panaretakis T, Casares N et al. Calreticulin exposure dictates the immunogenicity of cancer cell death. Nature medicine 2007; 13:54-61; PMID:17187072; http://dx.doi.org/10.1038/nm1523
- Chaput N, De Botton S, Obeid M, Apetoh L, Ghiringhelli F, Panaretakis T, Flament C, Zitvogel L, Kroemer G. Molecular determinants of immunogenic cell death: surface exposure of calreticulin makes the difference. J Mol Med (Berl) 2007; 85:1069-76; PMID:17891368; http://dx.doi.org/10.1007/s00109-007-0214-1
- Senovilla L, Vitale I, Martins I, Tailler M, Pailleret C, Michaud M, Galluzzi L, Adjemian S, Kepp O, Niso-Santano M et al. An immunosurveillance mechanism controls cancer cell ploidy. Science 2012; 337:1678-84; PMID:23019653; http://dx.doi.org/10.1126/science.1224922
- Kepp O, Galluzzi L, Giordanetto F, Tesniere A, Vitale I, Martins I, Schlemmer F, Adjemian S, Zitvogel L, Kroemer G. Disruption of the PP1/GADD34 complex induces calreticulin exposure. Cell Cycle 2009; 8:3971-7; PMID:19901557; http://dx.doi.org/10.4161/cc.8.23.10191
- Wu J, Lanier LL. Natural killer cells and cancer. Adv Cancer Res 2003; 90:127-56; PMID:14710949; http://dx.doi.org/10.1016/S0065-230X(03)90004-2
- Smyth MJ, Hayakawa Y, Takeda K, Yagita H. New aspects of natural-killer-cell surveillance and therapy of cancer. Nat Rev Cancer 2002; 2:850-61; PMID:12415255; http://dx.doi.org/10.1038/nrc928
- Moretta L, Bottino C, Pende D, Castriconi R, Mingari MC, Moretta A. Surface NK receptors and their ligands on tumor cells. Semin Immunol 2006; 18:151-8; PMID:16730454; http://dx.doi.org/10.1016/j.smim.2006.03.002
- Lanier LL. NK cell recognition. Annu Review Immunol 2005; 23:225-74; PMID:15771571; http://dx.doi.org/10.1146/annurev.immunol.23.021704.115526
- Pegram HJ, Andrews DM, Smyth MJ, Darcy PK, Kershaw MH. Activating and inhibitory receptors of natural killer cells. Immunol Cell Biol 2011; 89:216-24; PMID:20567250; http://dx.doi.org/10.1038/icb.2010.78
- Huergo-Zapico L, Acebes-Huerta A, Lopez-Soto A, Villa-Alvarez M, Gonzalez-Rodriguez AP, Gonzalez S. Molecular Bases for the Regulation of NKG2D Ligands in Cancer. Front Immunol 2014; 5:106; PMID:24711808; http://dx.doi.org/10.3389/fimmu.2014.00106
- Lopez-Soto A, Huergo-Zapico L, Acebes-Huerta A, Villa-Alvarez M, Gonzalez S. NKG2D signaling in cancer immunosurveillance. Inter J Cancer J Inter du Cancer 2015; 136:1741-50; PMID:24615398; http://dx.doi.org/10.1002/ijc.28775
- Bottino C, Castriconi R, Pende D, Rivera P, Nanni M, Carnemolla B, Cantoni C, Grassi J, Marcenaro S, Reymond N et al. Identification of PVR (CD155) and Nectin-2 (CD112) as cell surface ligands for the human DNAM-1 (CD226) activating molecule. J Exp Med 2003; 198:557-67; PMID:12913096; http://dx.doi.org/10.1084/jem.20030788
- Pende D, Bottino C, Castriconi R, Cantoni C, Marcenaro S, Rivera P, Spaggiari GM, Dondero A, Carnemolla B, Reymond N et al. PVR (CD155) and Nectin-2 (CD112) as ligands of the human DNAM-1 (CD226) activating receptor: involvement in tumor cell lysis. Mol Immunol 2005; 42:463-9; PMID:15607800; http://dx.doi.org/10.1016/j.molimm.2004.07.028
- Brandt CS, Baratin M, Yi EC, Kennedy J, Gao Z, Fox B, Haldeman B, Ostrander CD, Kaifu T, Chabannon C et al. The B7 family member B7-H6 is a tumor cell ligand for the activating natural killer cell receptor NKp30 in humans. J Exp Med 2009; 206:1495-503; PMID:19528259; http://dx.doi.org/10.1084/jem.20090681
- Baychelier F, Sennepin A, Ermonval M, Dorgham K, Debre P, Vieillard V. Identification of a cellular ligand for the natural cytotoxicity receptor NKp44. Blood 2013; 122:2935-42; PMID:23958951; http://dx.doi.org/10.1182/blood-2013-03-489054
- Guerra N, Tan YX, Joncker NT, Choy A, Gallardo F, Xiong N, Knoblaugh S, Cado D, Greenberg NM, Raulet DH. NKG2D-deficient mice are defective in tumor surveillance in models of spontaneous malignancy. Immunity 2008; 28:571-80; PMID:18394936; http://dx.doi.org/10.1016/j.immuni.2008.02.016
- Gasser S, Orsulic S, Brown EJ, Raulet DH. The DNA damage pathway regulates innate immune system ligands of the NKG2D receptor. Nature 2005; 436:1186-90; PMID:15995699; http://dx.doi.org/10.1038/nature03884
- Lopez-Soto A, Quinones-Lombrana A, Lopez-Arbesu R, Lopez-Larrea C, Gonzalez S. Transcriptional regulation of ULBP1, a human ligand of the NKG2D receptor. J Biol Chem 2006; 281:30419-30; PMID:16901903; http://dx.doi.org/10.1074/jbc.M604868200
- Iannello A, Thompson TW, Ardolino M, Lowe SW, Raulet DH. p53-dependent chemokine production by senescent tumor cells supports NKG2D-dependent tumor elimination by natural killer cells. J Exp Med 2013; 210:2057-69; PMID:24043758; http://dx.doi.org/10.1084/jem.20130783
- Jung H, Hsiung B, Pestal K, Procyk E, Raulet DH. RAE-1 ligands for the NKG2D receptor are regulated by E2F transcription factors, which control cell cycle entry. J Exp Med 2012; 209:2409-22; PMID:23166357; http://dx.doi.org/10.1084/jem.20120565
- Lopez-Soto A, Huergo-Zapico L, Galvan JA, Rodrigo L, de Herreros AG, Astudillo A, Gonzalez S. Epithelial-mesenchymal transition induces an antitumor immune response mediated by NKG2D receptor. J Immunol 2013; 190:4408-19; PMID:23509364; http://dx.doi.org/10.4049/jimmunol.1202950
- Lopez-Soto A, Zapico LH, Acebes-Huerta A, Rodrigo L, Gonzalez S. Regulation of NKG2D signaling during the epithelial-to-mesenchymal transition. Oncoimmunology 2013; 2:e25820; PMID:24244906; http://dx.doi.org/10.4161/onci.25820
- Spies T. Regulation of NKG2D ligands: a purposeful but delicate affair. Nat Immunol 2008; 9:1013-5; PMID:18711442; http://dx.doi.org/10.1038/ni0908-1013
- Galluzzi L, Senovilla L, Zitvogel L, Kroemer G. The secret ally: immunostimulation by anticancer drugs. Nat Rev Drug Discov 2012; 11:215-33; PMID:22301798; http://dx.doi.org/10.1038/nrd3626
- Kepp O, Menger L, Vacchelli E, Locher C, Adjemian S, Yamazaki T, Martins I, Sukkurwala AQ, Michaud M, Senovilla L et al. Crosstalk between ER stress and immunogenic cell death. Cytokine Growth Factor Rev 2013; 24:311-8; PMID:23787159; http://dx.doi.org/10.1016/j.cytogfr.2013.05.001
- Axten JM, Medina JR, Feng Y, Shu A, Romeril SP, Grant SW, Li WH, Heerding DA, Minthorn E, Mencken T et al. Discovery of 7-methyl-5-(1-{[3-(trifluoromethyl)phenyl]acetyl}-2,3-dihydro-1H-indol-5-yl)-7H-p yrrolo[2,3-d]pyrimidin-4-amine (GSK2606414), a potent and selective first-in-class inhibitor of protein kinase R (PKR)-like endoplasmic reticulum kinase (PERK). J Med Chem 2012; 55:7193-207; PMID:22827572; http://dx.doi.org/10.1021/jm300713s
- Boyce M, Bryant KF, Jousse C, Long K, Harding HP, Scheuner D, Kaufman RJ, Ma D, Coen DM, Ron D et al. A selective inhibitor of eIF2alpha dephosphorylation protects cells from ER stress. Science 2005; 307:935-9; PMID:15705855; http://dx.doi.org/10.1126/science.1101902
- Chow J, Poon RY. DNA damage and polyploidization. Adv Exp Med Biol 2010; 676:57-71; PMID:20687469; http://dx.doi.org/10.1007/978-1-4419-6199-0_4
- Cerboni C, Fionda C, Soriani A, Zingoni A, Doria M, Cippitelli M, Santoni A. The DNA damage response: a common pathway in the regulation of NKG2D and DNAM-1 ligand expression in normal, infected, and cancer cells. Frontiers Immunol 2014; 4:508; PMID:24432022; http://dx.doi.org/10.3389/fimmu.2013.00508
- Sutherland J, Mannoni P, Rosa F, Huyat D, Turner AR, Fellous M. Induction of the expression of HLA class I antigens on K562 by interferons and sodium butyrate. Human Immunol 1985; 12:65-73; PMID:2578442; http://dx.doi.org/10.1016/0198-8859(85)90344-1
- Henney CS, Kuribayashi K, Kern DE, Gillis S. Interleukin-2 augments natural killer cell activity. Nature 1981; 291:335-8; PMID:6164929; http://dx.doi.org/10.1038/291335a0
- Tsavaris N, Kosmas C, Vadiaka M, Kanelopoulos P, Boulamatsis D. Immune changes in patients with advanced breast cancer undergoing chemotherapy with taxanes. Br J Cancer 2002; 87:21-7; PMID:12085250; http://dx.doi.org/10.1038/sj.bjc.6600347
- Hodge JW, Garnett CT, Farsaci B, Palena C, Tsang KY, Ferrone S, Gameiro SR. Chemotherapy-induced immunogenic modulation of tumor cells enhances killing by cytotoxic T lymphocytes and is distinct from immunogenic cell death. Inter J Cancer 2013; 133:624-36; PMID:23364915; http://dx.doi.org/10.1002/ijc.28070
- Chan OT, Yang LX. The immunological effects of taxanes. Cancer Immunology, Immunother 2000; 49:181-5; PMID:10941900; http://dx.doi.org/10.1007/s002620000122
- Carbone GM, Napoli S, Valentini A, Cavalli F, Watson DK, Catapano CV. Triplex DNA-mediated downregulation of Ets2 expression results in growth inhibition and apoptosis in human prostate cancer cells. Nucleic Acids Res 2004; 32:4358-67; PMID:15314206; http://dx.doi.org/10.1093/nar/gkh744
- Lopez-Soto A, Folgueras AR, Seto E, Gonzalez S. HDAC3 represses the expression of NKG2D ligands ULBPs in epithelial tumour cells: potential implications for the immunosurveillance of cancer. Oncogene 2009; 28:2370-82; PMID:19430493; http://dx.doi.org/10.1038/onc.2009.117
