
ABSTRACT
Therapies for cancer have traditionally been assessed with metrics such as the response rate, hazard ratio, or median survival. Such metrics have value in measuring the outcomes of conventional therapies, but may not be the most appropriate for new therapies. Immuno-oncology therapies offer a new approach to treating cancer by stimulating patients' immune systems to fight cancer. The value of these novel therapies has so far been assessed with traditional metrics, but the different ways in which immuno-oncology therapies work can mean the full value is not captured. Immuno-oncology therapies can produce longer survival times but this effect can be delayed or even preceded by an apparent phase of progression, which median survival or response rates may not reflect. This paper discusses a range of traditional and alternative metrics and their benefits or disadvantages in measuring the effects of immuno-oncology therapies, using examples of several novel drugs as case studies.
Introduction
In the last decade, therapies for cancer have evolved rapidly, from chemotherapies to targeted therapies to immuno-oncology (IO) therapies. Unlike chemotherapy agents which destroy cancer cells, or targeted therapies which interfere with the biologic processes causing cancer cells or later destroy cancer cells as well, IO therapies stimulate the natural capability of the patient's own immune system to fight cancer by targeting antigens expressed on cancer cells, making them detectable to host immune cells or certain immune regulatory checkpoints, offering a new approach to treatment.Citation1,Citation2 IO therapies alone or in combination can enhance innate or adaptive (T-cell) immune responses, or both.Citation3
In contrast to the early benefit often seen with chemotherapies, IO therapies exhibit delayed clinical effect,Citation4 and can also enable long-term survival in a subset of patients in certain cancer types.Citation3-5 Even in the absence of immunological response, however, IO therapies can offer an equilibrium phase that can be long-lasting and provide benefit to patients.
Several IO therapies are already approved and in use in the clinic, such as nivolumab and pembrolizumab for non-small cell lung cancer and malignant melanoma, and ipilimumab for malignant melanoma.Citation6-8 These agents were approved on the basis of durability of response and response rate, as with the accelerated approval of nivolumab and pembrolizumab;Citation6,Citation8 or an increase in overall survival time, as with ipilimumab,Citation9 an increase that has since been confirmed in the most recent pooled analysis of ipilimumab showing its durability.Citation10 In NSCLC specifically, nivolumab has been shown to have OS benefit, though pembrolizumab has not.Citation7,Citation11
These agents are also being investigated in other tumors, such as head and neck cancer, bladder cancer, renal cell carcinoma, and some hematological malignancies, including lymphoma and multiple myeloma. New agents are also in development, such as elotuzumab in multiple myeloma and tremelimumab in non-small cell lung cancer and head and neck cancer.
Efficacy of IO therapies has so far been assessed using conventional metrics, primarily response rate, the hazard ratio (HR), median overall survival (OS) and progression-free survival (PFS). Conventional metrics can have value in measuring outcomes of traditional therapies but may underestimate the value of agents such as IO therapies, with their different immune response and long-term survival benefit.Citation2,Citation12 Conventional survival and response metrics do not consider what happens to all patients, and particularly to survivors in the longer term, beyond trial completion.Citation13 Further, while payers in particular continue to focus on OS gains, additional dimensions are also important to patients, particularly the quality of survival, so toxicity burden and health-related quality of life (HRQL) are also important.Citation13 Presenting different metrics allows the survival benefit of an IO therapy to be assessed from multiple angles, and provides a more holistic picture than what can be shown by traditional metrics individually.Citation1,Citation14,Citation15
With the advent of a new era of cancer treatment in which IO therapies are emerging as an increasingly important option, it is important to consider how IO therapy clinical efficacy and safety may best be measured. This article reviews the types of metrics commonly used to assess cancer treatments in terms of survival, response, and adverse events, explains what these conventional metrics can and cannot measure in the clinical value of IO therapies, and describes potential alternative metrics that may be better suited to the evaluation of these new agents, using examples of IO therapies currently in development to illustrate the case.
Survival metrics
Median OS/PFS and HRs
The traditional metrics for survival are median OS and PFS, which is the time after initiation of treatment at which 50% of the patients remain alive or progression-free, respectively. Median survival is especially popular in trials, but these conventional survival metrics have several advantages and disadvantages.Citation12,Citation13 They can be used because they are reached relatively quickly, particularly in late-stage cancers, and are particularly useful in the context of traditional therapies, where the preponderance of patient benefit is largely observed before the median time point and survival after the median time point is relatively brief. Similarly the HR is a measure of the relative hazards of an event (e.g., progression or death), based on the hazards of the event for each treatment regimen in a clinical trial, for example.
However, with IO therapies this is not necessarily the case. First, as patients survive longer – in general, but also when treated with IO therapies – the median is harder to achieve without longer and larger clinical trials; second, there is evidence that immunological response can generate long-term survival benefit in the latter half of the survival distribution, who are typically comprised of patients achieving some sort of response and therefore, median OS and PFS do not help to measure or quantify the full value of a therapy, since because they do not consider what happens in the longer term to the remaining 50% of patients who are still alive, e.g., if the survival curves separate after the median OS.Citation12,Citation14 In the case of HRs, typically only one HR is reported, even though hazards – and therefore the spot-HR – change over time. However, the spot-HR can be a useful tool to present over time, similarly to landmark analyses, presented below. This can help to demonstrate relative benefit over time and illustrate, for example, tail effects in long-term survival with IO therapies.
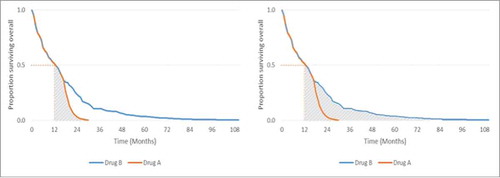
The survival distribution in uses a hypothetical example to show that median data only capture the front end of the distribution and provide no information on the tail end of the distribution.
Figure 1. Hypothetical survival curves for drugs with identical median OS but differing survival profiles. Left: The remaining 50% of patients on Drug A (represented by the shaded area under the Drug A curve) do not survive for long after 12 months. Right: Durable survival – the remaining 50% of patients on Drug B (represented by the shaded area under the Drug B curve) continue to survive after 12 months for an extended period of time.
Mean OS/PFS
Another option for evaluating survival is to use the mean rather than median. Mean survival is calculated by the total area under the survival curve, which captures the entirety of survival in all patients.Citation12 This can be illustrated using the same example from earlier; shows how using the mean can better differentiate therapies with divergent tails and greater survival later in the distribution.
Figure 2. Comparison of median and mean survival. Left: Area under the curve = mean OS of 12.2 months for Drug A. Right: Area under the curve = mean OS of 17.3 months for Drug B.
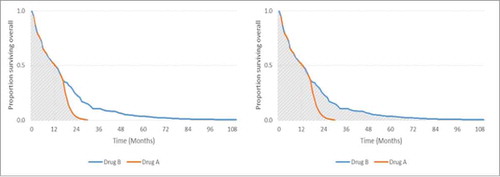
The median OS is the same from drugs A and B, but the mean OS is longer for drug B because the total area under the curve is greater.
Because most studies do not follow all patients until death, mean OS/PFS generated from trial-based data are restricted only to those observed (restricted mean). Restricted mean OS/PFS provides an accurate measure of trial-based survival because it is calculated entirely from observed data collected during the trial, and no additional assumptions or potential biases are introduced in its calculation. However, as with median data, restricted mean data cannot capture the benefit of a treatment that enables a subgroup of patients to survive for an extended period of time after the trial follow-up has ended.Citation12
It is possible to calculate a mean OS/PFS that is not restricted by the duration of follow up, and a variety of modeling methods allow post-trial OS/PFS to be extrapolated for all patients until death. This is known as an extrapolated mean. Using the same example from above, illustrates the restricted mean versus the extrapolated mean.
Figure 3. Comparison of restricted and extrapolated mean survival. Left: Area under the restricted curve = restricted mean OS of 14.7 months for Drug B. Right: Area under the entire curve = extrapolated mean OS of 17.3 months for Drug B.
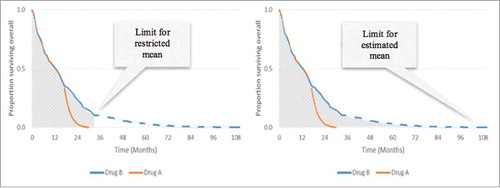
Restricted mean OS can be used as an alternative to the hazard ratio, and captures within-trial survival benefit; the estimated mean survival time captures tail effects.
The extrapolated mean OS/PFS is useful for IO therapies in that it is an average of the survival benefit for ‘all’ patients; however, because it is not based on ‘observed’ (i.e., trial-based) observed data, it is subject to any inherent biases from the extrapolation method used. Each method of extrapolation includes a set of underlying assumptions; therefore, each method generates slightly different results. It is therefore important to select the extrapolation method that provides the most accurate estimate of post-trial survival and survival time to ensure that the subsequently calculated mean data are also accurate.Citation12,Citation14 It is also important to understand that methods for calculating survival metrics that do not require assumptions are inherently more reliable; there is a trade-off between that reliability and the completeness of the full picture of survival benefit that extrapolation offers.
Davies and colleagues reported that long-term survival benefits experienced by some patients with melanoma can be greatly underestimated by median data.Citation12 To provide examples of the differences between median and mean OS, they used OS data from a pivotal ipilimumab clinical trial in patients with metastatic melanoma,Citation4 which showed median OS to be 10.1 months vs. 6.4 months with the comparator gp-100 gp100, a difference of 3.7 months. Extending this to consider mean data, the authors reported that the restricted mean survival difference at 48 months follow-up was 6.3 months, and extrapolated mean difference was 7 months using a log-normal parametric distribution method.Citation12
Landmark rates
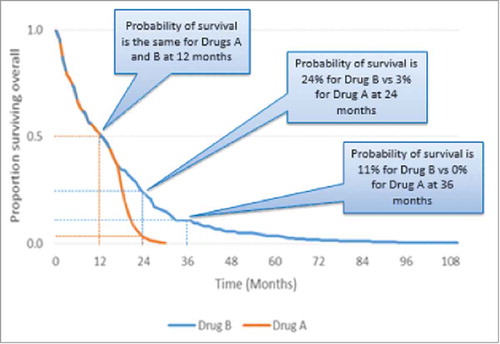
Beyond median and mean OS/PFS, another survival metric is landmark survival rates. These show the probability of survival at key time points, such as one year, and thus provide an alternative indicator of long-term durable survival, which can be easier to understand than mean and median OS. Landmark rates are ‘read’ from survival curves, and can therefore be taken from observed (trial-based Kaplan-Meier) or extrapolated survival data.
Landmark rates can also often be taken from observed data beyond the point at which median OS/PFS is reached, thereby providing an insight into longer term survival benefits, which is relevant for IO therapies.Citation13 This is demonstrated in published data from trials of ipilimumab, nivolumab, and pembrolizumab in melanoma. A meta-analysis of pooled data from ipilimumab trials reported landmark survival to be 22% at 3 years,Citation10 while nivolumab data showed that median OS was not reached in the nivolumab group but the 1 y survival rate was 72.9%.Citation16 In a trial of pembrolizumab vs. ipilimumab, the estimated 1 y survival rates were 74.1% (2 week doses) and 68.4% (3 week doses).Citation17 Where longer term landmark rates are taken from extrapolated survival curves, the data will be subject to any methodological assumptions and biases inherent to the method used to generate that curve, as noted earlier. provides an example of landmark survival rates to show the probability of survival with 2 different drugs at particular time points.
Figure 4. Use of landmark survival rates.
Number needed to treat
Number needed to treat (NNT) is a relatively easy to understand metric that can show value in the absence of obvious differences in mean/median OS between treatments. The NNT is calculated as the reciprocal of the absolute risk reduction;Citation18 for example, NNT to avoid one death = 1 ÷ (OS rate with intervention – OS rate with comparator). An NNT of 10 for Drug A over Drug B means that for every 10 patients treated with Drug A instead of Drug B, there is likely to be one death fewer.
By virtue of how it is derived, NNT is a relative metric as opposed to an absolute metric, because the result is the difference between 2 treatments. There is no threshold for NNT that has to be met in order for a drug to be considered clinically effective: lower positive values are better than higher positive values, indicating that fewer patients need to be treated for a death to be avoided. Negative values can also be obtained for NNT. An NNT of −10 for Drug A over Drug B means that for every 10 patients treated with Drug A instead of Drug B, there is likely to be one additional death.
It is important to note that NNT is a time-fixed metric (e.g., NNT at 6 months), like landmark rates, because relative risk changes with time. Changes in NNT over time can therefore be used to demonstrate that a drug is associated with better long-term survival than its comparator. NNT can also be used to calculate the population impact number (PIN) and the disease impact number (DIN), allowing comparison of the value of new therapies from a population perspective.Citation19 This approach can be used to bridge between cost-effectiveness and epidemiology models by better capturing the more dynamic aspects of value as the disease and patient population evolves over time.
Response metrics
Response classification and rates
Response rates are a commonly published metric that reflects the proportion of patients who achieve a specific type of response, such as complete or partial response, by a fixed time point. Response is important because it is conventionally taken to be an indicator of likelihood to achieve a survival benefit, but it also has direct value in terms of quality of life.Citation20
However, the mechanism of action with IO therapies is different to traditional chemotherapies or targeted agents, and this affects tumor response. It is now understood for solid tumors that in the immediate term, tumor volume may increase as a result of infiltration by immune and inflammatory cells, or new lesions may develop as a result of the delayed effect of treatment.Citation1,Citation13 Either scenario is followed by a reduction in tumor burden. For a given level of response, the response duration or benefits from immunological response have also been linked to greater PFS and OS benefit.Citation21 Using traditional measures of response the initial spike would have been classified as progressive disease, leading to premature discontinuation of treatment. The response rates would also have been affected, because patients who would ultimately have achieved an objective response would have been discontinued from the study.
This kind of response profile with the IO therapies prompted development of the immune-related response criteria (irRC) and the more recent combined irRC and RECIST (irRECIST) to enable better assessment of patient responses with IO therapies and the generation of more reliable data from studies.Citation22-24 The size of the tumor and character of tumor-infiltrating effector cells may both be monitored in this way. While efforts to redefine response criteria in line with the modality of IO therapies are beneficial, response rate may still undervalue the longer term benefits of IO therapies.Citation13 Rates are time-fixed metrics and hence, like restricted mean data, only capture data until the last time point that patients are followed up. Hence, response rates capture more value for treatments that elicit a rapid response but potentially undervalue IO therapies where response may be delayed, or where there are subgroups of patients who have stable disease for prolonged periods.Citation13 Consequently, response rates for IO therapies do not necessarily correlate well with survival benefit. As one example, data from a pivotal ipilimumab trial showed low objective response rates of 10.9% yet the 2 y survival rate was 23.5%.Citation4 Where objective response is achieved, landmark rates can provide more granularity to response data if presented for multiple time points (i.e., at 1, 2, 3 years, etc.), and can be an effective way to demonstrate sustained response.Citation25 While response per se should be considered an important decision-making tool for clinicians, it should not be considered a measure of the clinical benefits of IO therapies.
Time to response and duration of response
Time to response is typically measured as the duration from the start of therapy, or the start of randomization, to the time point at which a response is identified. Conventionally, this is presented as median time to response because it is an unbiased statistic and, as with survival, most trials do not follow all patients until a response (or death) occurs. The potential for delayed response to IO treatment means that time to response may undervalue the benefits of these therapies.Citation13
By contrast, duration of response is a measure of response durability irrespective of how quickly or slowly response is first observed and thus may be well suited to IO therapies. Combined, the 2 metrics represent PFS. Duration of response is also typically presented as a median. Duration of response is an important metric in cancers such as ALL and multiple myeloma that eventually relapse in the majority of patients, given the perception, if not the proven correlation, that relieving tumor burden for a substantial period could translate into improved HRQL and potentially survival.
However, duration of response is likely to exclude any patients whose disease remains stable or who achieve only a minimal response, as typically only patients who achieve a partial response or better are included in this analysis. In this scenario, time to progression (TTP) is an alternative metric that would capture the value of this therapy better than response rate or duration. It is worth noting here that PFS also captures the value of preventing progression but includes patients who die from any cause, whereas TTP censors patients who die, so the resultant data are representative of patients who remained alive but only up to the point of progression.
Adverse event metrics
Number needed to harm (NNH)
Adverse events (AEs) are an important part of assessing the value of any new treatment and are typically reported as rates, such as the percentage of patients in a trial who experienced an AE. Similar to NNT, the NNH is calculated as the reciprocal of the risk of an AE for a treatment, calculated as 1 ÷ (rate of AEs with intervention – rate of AEs with comparator). For example, if NNH = 10 for Drug A over Drug B, this is equivalent to saying that “for every 10 patients treated with Drug A instead of Drug B, there is likely to be one more AE.” Hence, the larger the NNH, the better for a given treatment. Negative values for NNH illustrate the inverse is true. For example, if NNH = −10 for Drug A over Drug B, this is equivalent to saying that “for every 10 patients treated with Drug A instead of Drug B, there is likely to be one less AE.” Like NNT, NNH is also a time-fixed metric and can also be used to calculate the PIN and DIN.
Combination metrics
The components of survival
It is important to remember that OS comprises 3 components: response, progression-free disease, and post-progression. Patients who are still alive must be in one of those states. Hence, response and progression-free disease can be used to unravel the underlying value within OS – how much of the OS period, including quality-adjusted survival, is spent in remission or progression-free, rather than post-progression. The progression-free period is typically characterized by lower treatment costs, higher activity and functioning, and better HRQL. shows OS, PFS, and complete response curves together, with the shaded areas indicating pre- and post-progression.
Figure 5. Comparison of OS, PFS, and complete response.
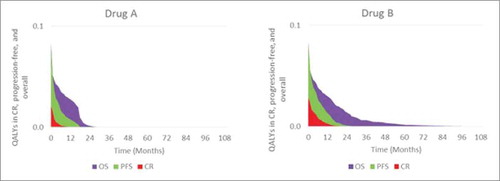
In this example, Drug B's quality-adjusted life-year (QALY) gains are a combination of improved survival and response
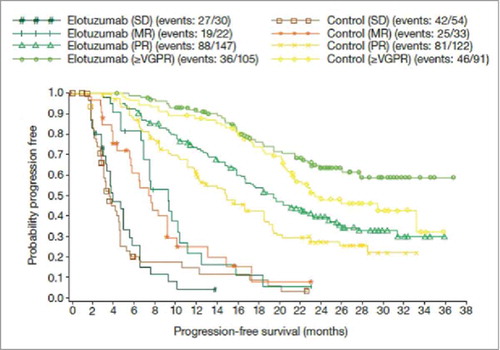
Another alternative is to consider the relationship between different types of response and survival. For example, IO therapies may achieve lower complete response or objective response rates in general, but the value of that complete response for the patient may differ depending on whether it is with an IO or conventional therapy, given the broader effect of the IO on the immune system; immunosurveillance for long-term phases of stable disease that may not be categorized as CR can also be seen to be important in this context. Mapping each individual response type to survival allows its value to be assessed irrespective of rates. illustrates survival by response type with carfilzomib, under investigation for relapsed multiple myeloma;Citation26 shows PFS by response type with elotuzumab, in development for relapsed or refractory multiple myeloma.Citation27
Figure 6. Survival according to response type with carfilzomib in relapsed multiple myeloma. Source: Stewart et al., 2015,Citation26 supplementary appendix. Abbreviations: CR, complete response; MR; minimal response; PD, progressive disease; PR, partial response; sCR, stringent complete response; SD, stable disease; VGPR, very good partial response.
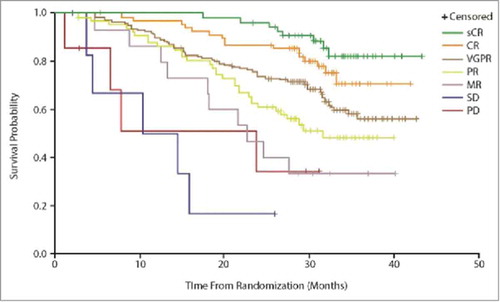
Figure 7. PFS according to response type with elotuzumab in relapsed/refractory multiple myeloma. Source: Stewart et al., 2015,Citation26 supplementary appendix. Abbreviations: MR; minimal response; PR, partial response; SD, stable disease; ≥VGPR, stringent complete response plus complete response plus very good partial response.
Cost of outcomes
New treatment modalities are often expensive, and the total drug acquisition cost per patient to healthcare systems is also often high because new therapies are often given longer as the patient survives longer. Cost, budget impact, and cost-effectiveness measures are therefore important to enable the relative cost of one treatment to be compared between treatments or with the clinical benefit for a single treatment. A common outcome of this calculation is the cost per quality-adjusted life-year (QALY) gained. The incremental cost-effectiveness ratio (ICER), which is based on incremental costs and incremental QALYs,Citation28 is used in health technology assessments in many countries.Citation29-32 However, the ICER is not obviously informative for many, including clinicians and their patients, and alternative metrics that provide a simple indication of costs in relation to clinical benefit can be useful.
Cost-based metrics that reflect budget impact include the cost of NNT, where NNT is multiplied by the average cost to treat to progression per patient. The more effective the treatment, the lower the NNT, and hence the lower the cost of preventing one death. As described earlier, NNT is a relative metric and hence the result of a cost of NNT calculation is also relative. For example, if the cost of treating one patient until disease progression is $1,000 for Drug A, and the NNT is 10 for Drug A over Drug B, the cost to prevent one death by using Drug A rather than Drug B would be $10,000.
Cost-based metrics that reflect costs relative to benefit include cost per progression-free month. This is generated by dividing the average cost of treatment per patient by the median or mean PFS (in months). In oncology, PFS rather than OS is often used for this metric because the majority of treatments are given until disease progression. This provides a simple way to relate the cost of a treatment to its PFS benefit, and therefore enables comparisons between treatments.
Implications for emerging IO therapies
summarizes the key clinical metrics discussed in this paper and their strengths and limitations.
Table 1. Strengths and limitations of metrics in the context of IO therapies.
The implications of choosing and valuing metrics in the context of IO therapies can be illustrated in the cases of new IO therapies that are in development for non-small cell lung cancer and multiple myeloma: tremelimumab and elotuzumab. Tremelimumab was first assessed for the treatment of melanoma but an early interim analysis did not show a survival benefit with the drug, resulting in a recommendation that the study be terminated on the basis of futility.Citation33 However, extended follow-up at 2 y showed that a subgroup of patients had survived significantly longer with tremelimumab, with patients with low baseline CRP (≤1.5 x ULN) showing a median OS of 19.1 months for tremelimumab vs. 12.7 months for chemotherapy (P = 0.0037).Citation34 Subset analysis showed a trend toward a more favorable treatment effect for tremelimumab in patients who had certain markers of advanced disease (Eastern Cooperative Oncology Group performance status 1 vs. 0, baseline LDH1–2 X ULN compared with ULN, and more than one disease site compared with only one disease site), compared with chemotherapy.Citation33 This case of tremelimumab highlights the importance of recognizing that traditional metrics may not sufficiently capture the value of IO therapies; in many cases other non-survival endpoints can point to clinical benefit – in this case in a subgroup of patients.
A further example is seen in elotuzumab, a novel IO therapy for the treatment of relapsed or refractory multiple myeloma. Recently published interim data from its pivotal study (ELOQUENT-2) indicate that OS benefit at the median may not be pronounced; however, PFS at 1 y was 68% with elotuzumab vs. 57% in the control group, and 41% vs. 27% respectively at 2 y.Citation27 Landmark analysis of PFS and OS both also show improvement at multiple time points, with more mature data than has been available for other therapies for multiple myeloma. That the effect of IO therapies in solid tumors is also seen in hematological cancers indicates the robustness of this modality and its potential application in all tumor types.
A final factor requiring consideration is adjustment for differences in study design or patient population. Using the example of elotuzumab again, the patient population in the ELOQUENT-2 study had a higher burden of disease, and poorer prognosis, than in other studies of refractory multiple myeloma; therefore, even with a comparator regimen that is the same across studies, absolute and relative value metrics should not be compared directly without adjustment.Citation35 This heterogeneity can affect both baseline prognosis and the measured treatment effect. This bias in measurement is already a known issue related to, for example, consideration of median and mean-based metrics, including the HR; however, it should be a factor considered when establishing any of the value metrics also discussed here.
Conclusions
Significant progress has been made in understanding IO therapies and their mechanism of action, as well as in more accurately classifying the type of outcomes that can be expected. This captures only the clinical value, and experience with IO therapies is still currently limited to melanoma and non-small cell lung cancer; therefore, and as such, clinicians and payers may be unfamiliar with assessing the total value of IO therapies in other tumor types, including hematological cancers.
Given that IO therapies are in development for an expanding range of cancer types, it is important to identify the most appropriate metrics able to capture the clinical and economic value of these therapies from a range of perspectives, including clinicians, patients, and budget-holders. We have demonstrated here that traditional metrics of median overall survival or hazard ratio provide only limited information and not the totality of survival or other benefits with IO therapies. Future clinical trials should be designed with more of these metrics in mind as trial endpoints, to better establish their performance; e.g., restricted mean OS or landmark OS rates rather than median OS could be used, or used in addition. Continued follow-up of existing trials also could help validate some of these measures. Additional metrics that are better suited to measuring the efficacy and safety of IO therapies can complement traditional endpoints and provide more information to payers, physicians, and patients about the impact of IO therapies on disease, patient survival and quality of life, as well as health systems.
Disclosure of potential conflicts of interest
This study was sponsored by Bristol-Myers Squibb.
Acknowledgments
PRMA Consulting provided medical writing services on behalf of Bristol-Myers Squibb.
References
- Ascierto PA, Marincola FM. What have we learned from cancer immunotherapy in the last 3 years? J Transl Med 2014; 12:141; PMID:24886164; https://doi.org/10.1186/1479-5876-12-141
- Chen TT. Statistical issues and challenges in immuno-oncology. J Immunother Cancer 2013; 1:18; PMID:24829754; https://doi.org/10.1186/2051-1426-1-18
- Antonia SJ, Larkin J, Ascierto PA. Immuno-oncology combinations: a review of clinical experience and future prospects. Clin Cancer Res 2014; 20:6258-68; PMID:25341541; https://doi.org/10.1158/1078-0432.CCR-14-1457
- Hodi FS, O'Day SJ, McDermott DF, Weber RW, Sosman JA, Haanen JB, Gonzalez R, Robert C, Schadendorf D, Hassel JC, et al. Improved survival with ipilimumab in patients with metastatic melanoma. N Engl J Med 2010; 363:711-23; PMID:20525992; https://doi.org/10.1056/NEJMoa1003466
- Robert C, Thomas L, Bondarenko I, O'Day S, Weber J, Garbe C, Lebbe C, Baurain JF, Testori A, Grob JJ, et al. Ipilimumab plus dacarbazine for previously untreated metastatic melanoma. N Engl J Med 2011; 364:2517-26; PMID:21639810; https://doi.org/10.1056/NEJMoa1104621
- FDA. Opdivo (nivolumab) injection, for intravenous use. 2015.
- FDA. Yervoy (ipilimumab) injection, for intravenous infusion. 2015.
- FDA. Keytruda (pembrolizumab) for injection, for intravenous use. 2015.
- Research CfDEa. Summary review: Ipilimumab. 2011.
- Schadendorf D, Hodi FS, Robert C, Weber JS, Margolin K, Hamid O, Patt D, Chen TT, Berman DM, Wolchok JD. Pooled analysis of long-term survival data from Phase II and Phase III trials of ipilimumab in unresectable or metastatic melanoma. J Clin Oncol 2015; 33:1889-94; PMID:25667295; https://doi.org/10.1200/JCO.2014.56.2736
- EMA. Nivolumab Summary of Product Characteristics. 2015.
- Davies A, Briggs A, Schneider J, Levy A, Ebeid O, Wagner S. The ends justify the mean: Outcome measures for estimating the value of new cancer therapies. Health Out Res Med 2012; 3:e25-e36; https://doi.org/10.1016/j.ehrm.2012.01.001
- Johnson P, Greiner W, Al-Dakkak I, Wagner S. Which metrics are appropriate to describe the value of new cancer therapies? Biomed Res Int 2015; 2015:865101; PMID:26161418
- Joulain F, Proskorovsky I, Allegra C, Tabernero J, Hoyle M, Iqbal SU, Van Cutsem E. Mean overall survival gain with aflibercept plus FOLFIRI vs placebo plus FOLFIRI in patients with previously treated metastatic colorectal cancer. Br J Cancer 2013; 109:1735-43; PMID:24045663; https://doi.org/10.1038/bjc.2013.523
- McDermott D, Lebbe C, Hodi FS, Maio M, Weber JS, Wolchok JD, Thompson JA, Balch CM. Durable benefit and the potential for long-term survival with immunotherapy in advanced melanoma. Cancer Treat Rev 2014; 40:1056-64; PMID:25060490; https://doi.org/10.1016/j.ctrv.2014.06.012
- Robert C, Long GV, Brady B, Dutriaux C, Maio M, Mortier L, Hassel JC, Rutkowski P, McNeil C, Kalinka-Warzocha E, et al. Nivolumab in previously untreated melanoma without BRAF mutation. N Engl J Med, 2014:320-30.
- Robert C, Schachter J, Long GV, Arance A, Grob JJ, Mortier L, Daud A, Carlino MS, McNeil C, Lotem M, et al. Pembrolizumab versus ipilimumab in advanced melanoma. N Engl J Med, 2015; 372:2521-32; PMID:25891173; https://doi.org/10.1056/NEJMoa1503093
- Cook RJ, Sackett DL. The number needed to treat: a clinically useful measure of treatment effect. BMJ 1995; 310:452-4; PMID:7873954; https://doi.org/10.1136/bmj.310.6977.452
- Attia J, Page J, Heller RF, Dobson AJ. Impact numbers in health policy decisions. J Epidemiol Comm Health 2002; 56:600-5; PMID:12118051; https://doi.org/10.1136/jech.56.8.600
- Glimelius B, Hoffman K, Graf W, P+Ñhlman L, Sj+Âd+®n P. Quality of life during chemotherapy in patients with symptomatic advanced colorectal cancer. Cancer 1994; 73:556-62; PMID:8299077; https://doi.org/10.1002/1097-0142(19940201)73:3%3c556::AID-CNCR2820730310%3e3.0.CO;2-8
- Clarke JM, Wang X, Ready NE. Surrogate clinical endpoints to predict overall survival in non-small cell lung cancer trials-are we in a new era? Transl Lung Cancer Res 2015; 4:804. PMID:26798592.
- Wolchok JD, Hoos A, O'Day S, Weber JS, Hamid O, Lebbe C, Maio M, Binder M, Bohnsack O, Nichol G, et al. Guidelines for the evaluation of immune therapy activity in solid tumors: Immune-related response criteria. Clin Cancer Res 2009; 15:7412-20; PMID:19934295; https://doi.org/10.1158/1078-0432.CCR-09-1624
- Bohnsack O, Hoos A, Ludajic K. Adaptation and modification of the immune related response criteria (IRRC): IrRECIST. ASCO, 2014:e22121.
- Nishino M. Immune-related response evaluations during immune-checkpoint inhibitor therapy: Establishing a "common language" for the new arena of cancer treatment. J Immunother Cancer 2016; 4:30; PMID:27330803; https://doi.org/10.1186/s40425-016-0134-0
- Hjorth-Hansen H, Stenke L, Soderlund S, Dreimane A, Ehrencrona H, Gedde-Dahl T, Gjertsen BT, Höglund M, Koskenvesa P, Lotfi K, et al. Dasatinib induces fast and deep responses in newly diagnosed chronic myeloid leukaemia patients in chronic phase: clinical results from a randomised phase-2 study (NordCML006). Eur J Haematol 2015; 94:243-50; PMID:25082346; https://doi.org/10.1111/ejh.12423
- Stewart AK, Rajkumar SV, Dimopoulos MA, Masszi T, Spicka I, Oriol A, Hájek R, Rosiñol L, Siegel DS, Mihaylov GG, et al. Carfilzomib, lenalidomide, and dexamethasone for relapsed multiple myeloma. N Engl J Med 2015; 372:142-52; PMID:25482145; https://doi.org/10.1056/NEJMoa1411321
- Lonial S, Dimopoulos M, Palumbo A, White D, Grosicki S, Spicka I, Walter-Croneck A, Moreau P, Mateos MV, Magen H, et al. Elotuzumab therapy for relapsed or refractory multiple myeloma. N Engl J Med 2015; 373(7):621-31; PMID:26035255; https://doi.org/10.1056/NEJMoa1505654
- Drummond MF, Sculpher MJ, Torrance GW, O'Brien BJ, Stoddart GL. Methods for the economic evaluation of health care programmes. Oxford: Oxford University Press, 2005.
- PBAC. Guidelines for preparing submissions to the Pharmaceutical Benefits Advisory Committee (Version 4.4). 2013.
- CADTH. HTA: Addendum to CADTH's guidelines for the economic evaluation of health technologies: specific guidance for oncology projects. 2009.
- CADTH. Guidelines for the economic evaluation of health technologies: Canada, 3rd edition. 2006.
- NICE. Guide to the methods of technology appraisal. 2013.
- Ribas A, Kefford R, Marshall MA, Punt CJ, Haanen JB, Marmol M, Garbe C, Gogas H, Schachter J, Linette G, et al. Phase III randomized clinical trial comparing tremelimumab with standard-of-care chemotherapy in patients with advanced melanoma. J Clin Oncol 2013; 31:616-22; PMID:23295794; https://doi.org/10.1200/JCO.2012.44.6112
- Marshall MA, Ribas A, Huang B. Evaluation of baseline serum C-reactive protein (CRP) and benefit from tremelimumab compared to chemotherapy in first-line melanoma. Journal of Clinical Oncology, ASCO Annual Meeting Abstracts, 2010:2609-; ; https://doi.org/10.1200/jco.2010.28.15_suppl.2609
- Signorovitch JE, Sikirica V, Erder MH, Xie J, Lu M, Hodgkins PS, Betts KA, Wu EQ. Matching-adjusted indirect comparisons: A new tool for timely comparative effectiveness research. Value Health 2012; 15:940-7; PMID:22999145; https://doi.org/10.1016/j.jval.2012.05.004