
ABSTRACT
How the tumor microenvironment educates dendritic cells (DCs) to promote tumorigenesis remains largely unknown, and the role of tumor-derived exosomes (TEXs) in tumorigenesis is controversial. Here, we report that in addition to the activation of DCs, TEXs induce DCs to produce increased interleukin-6 (IL-6), which dramatically promotes tumor invasion by increasing signal transducer and activator of transcription 3 (STAT3)-dependent matrix metalloproteinases 9 transcription activity in tumor cells. HSP72 and HSP105 on the TEX surface induce IL-6 secretion of DCs in a TLR2- and TLR4-dependent manner. In addition, HSP72 and HSP105 are predominantly present on exosomes from sera of tumor patients but not healthy people, indicating their value in tumor prediction. Furthermore, TEXs are powerful activators of DCs, and the depletion of IL-6 converts TEXs from tumor promoters to tumor inhibitors in vivo. Therefore, our results reveal a novel mechanism for the TEX-mediated education of DCs and shed light on the conundrum that TEXs present by playing dual roles in tumorigenesis.
KEYWORDS:
| Abbreviations | ||
| DC | = | dendritic cell |
| GM-CSF | = | granulocyte-macrophage colony stimulating factor |
| IL | = | interleukin |
| TEX | = | tumor-derived exosomes |
| HSP | = | heat shock protein |
Introduction
Dendritic cells (DCs) are the most important APCs to activate antitumor immunity in animals and humans, including processing tumor-specific and tumor-associated antigens, initiating robust and long-lasting tumor antigen-specific CD4+ and CD8+ T cell responses.Citation1 However, DCs can also be domesticated by tumors and lose their antitumor ability. Highly-tumorigenic melanomas overexpress soluble factors that alter the maturation and activation of DC, conferring a pro-tumorigenic phenotype to DC that may promote tumor outgrowth, metastasis, and immune escape.Citation2 Activated inflammatory DCs universally infiltrate tumor tissues, and these DCs can accelerate tumor growth through galectin-1 and interleukin-6 (IL-6).Citation3
Inflammatory mediators, such as IL-1β, TNF-α, IL-6 and PGE2, mediate the innate response and enhance the adaptive immune response to eliminate invading pathogens.Citation4 Inflammatory mediators are also closely associated with tumorigenesis. IL-6 can increase MMP-13 expression and motility in human chondrosarcoma cellsCitation5 and PGE2 can promote lung cancer invasion.Citation6 Tumor antigens can induce the activation and maturation of DCs, which favors the initiation of antitumor immunity.Citation7 Nevertheless, during activation and maturation, DCs can release high levels of inflammatory mediators, such as IL-6 and PGE2,Citation8,9 which is positive related to tumorigenesis.
Exosomes, with a size of 50 to 150 nm, are released into the extracellular environment after fusion of multivesicular endosomes with the plasma membrane.Citation10 The role of tumor-derived exosomes (TEXs) in tumor progress is disputed. On the one hand, TEXs can mediate immunosuppression through impairing DC differentiation and maturation, polarizing tumor-promoting macrophages, decreasing NK cell cytotoxicity and inducing regulatory T and B cells.Citation11 On the other hand, tumor antigen-containing TEXs have been demonstrated to induce efficient antitumor immunity.Citation12 TEXs are also shown to induce activation and maturation of DCs, followed by tumor-rejection T cell priming.Citation13 How these diametrically opposed results occur has yet to be explored. In addition, whether TEXs can induce the secretion of inflammatory mediators, accompanied by the activation and maturation of DCs, and their effect on tumorigenesis is still unknown.
In this study, we wanted to determine whether TEXs, along with promoting DC activation and maturation, could promote tumor progression by inducing DCs to produce inflammatory mediators. In addition, we elucidated how TEX-activated DCs (Ta-DCs) promote tumor progression.
Results
Ta-DCs secreted high levels of inflammatory mediators and promoted tumor cell invasion in vitro
Characterization of morphology of TEXs from B16-F10, 3LL and 4T1 cells (B16-F10-EXO, 3LL-EXO and 4T1-EXO) using electron microscopy, we found that all types of TEXs were membrane vesicles, primarily ranging in size from 80–150 nm (Fig. S1A). The size distribution of B16-F10-EXO, 3LL-EXO and 4T1-EXO was 120 ± 21 nm, 111 ± 12 nm and 112 ± 11 nm, respectively (Fig. S1B). These exosomes were positive for CD63, TSG101, Alix and HSP70 molecules, but negative for GRP94, Calnexin and GM130 (Fig. S1C). Consistent with previous report,Citation13 all types of TEXs were potentially capable of promoting bone marrow-derived DC (BMDC) maturation and IL-12 secretion (Fig. S1D and ).
Figure 1. Ta-DCs secreted high levels of inflammatory mediators and promoted the invasion of tumor cells in vitro. (A) BMDCs were stimulated with PBS or 5 μg/ml of B16-F10-EXO, 3LL-EXO or 4T1-EXO for 6 h. Production of IL-6 and PGE2 from BMDCs was measured by ELISA (n = 3). (B) B16-F10, 3LL or 4T1 tumor cells were cultured in supernatant from corresponding exosome-stimulated BMDCs for 24 h, and the cells were plated in the top chamber of a Transwell plate. Twenty-four hours later, the cells on the bottom of the Transwell filter were imaged and quantified. (C) The results of (B) were statistically analyzed (n = 5). (D) B16-F10, 3LL or 4T1 tumor cells were cultured in supernatant from corresponding exosome-stimulated BMDCs for 24 h, and the cells were plated in the top chamber, precoated with 50 μl of Matrigel. Forty-eight hours later, the cells on the bottom of the Transwell filter were imaged and quantified. (E) The results of (D) were statistically analyzed (n = 5). (F) B16-F10, 3LL or 4T1 tumor cells were cultured in supernatant from corresponding exosome-stimulated BMDCs for 24 h, and the cells were then collected and re-cultured in fresh medium. The proliferation of tumor cells was measured using an alamarBlue assay at 24 h, 48 h and 72 h (n = 5). (A, C, E, F) The results are shown as the mean ± SEM of 3 independent experiments. (B, D) One representative image out of 5 is shown (Magnification: 200 ×). P values were generated by one-way ANOVA, followed by a Tukey-Kramer multiple comparison test; ***p < 0.001.
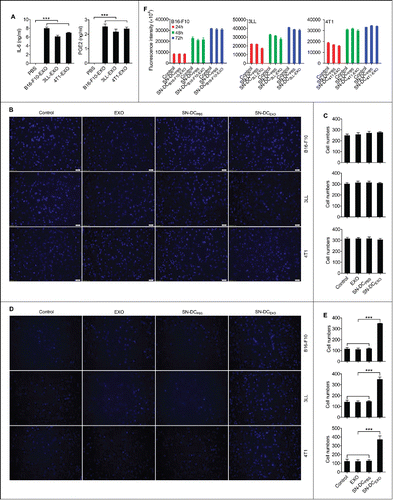
Then, we determined whether TEXs could simultaneously trigger DCs to secrete inflammatory mediators. After stimulation with TEXs, DCs produced higher levels of IL-6 and PGE2 than those without TEX stimulation (). PGE2 has been reported to present in TEXs.Citation14 To exclude that the IL-6 and PGE2 were from the TEXs, we measured IL-6 and PGE2 in TEXs and found neither were detectable (data not shown). Moreover, the levels of IL-1β and TNF-α were also markedly increased in TEX-treated DCs (data not shown). These results suggest that TEXs induce not only activation and maturation but production of inflammatory mediators of DCs.
Inflammatory mediators increase tumor metastasis.Citation15,16 Therefore, we interrogated whether inflammatory mediators secreted by Ta-DCs can affect the motility and invasive ability of tumor cells. To elucidate this point, migration and invasion assays were performed in vitro. In comparison with tumor cells cultured in supernatant from PBS-treated DCs (SN-DCPBS), tumor cells cultured in supernatant from B16-F10-EXO, 3LL-EXO or 4T1-EXO-activated DCs (termed as SN-DCB16-F10-EXO, SN-DC3LL-EXO or SN-DC4T1-EXO, respectively) showed no change in motility in the migration assay, and TEXs alone did not affect the motility of tumor cells ( and ). However, in the invasion assay, each type of tumor cells cultured in supernatant from corresponding TEX-activated DCs showed enhanced invasive ability. TEXs alone neither affect the invasive ability of tumor cells ( and ).
Inflammatory mediators are reported to induce proliferation of tumor cells.Citation17 To exclude that the increased invasive ability of tumor cells may be due to enhanced proliferation of tumor cells, we tested the proliferation of tumor cells after culture in supernatant from TEX-activated DCs. As shown in , none of the tested tumor cell types exhibited differences in proliferation between the untreated tumor cells and tumor cells treated with supernatant from TEX-activated and non-activated DCs. Together, these data demonstrate that Ta-DCs promote the invasive ability of tumor cells in vitro.
IL-6 from Ta-DCs promoted tumor cell invasion through upregulation of MMP9 expression
IL-6 and PGE2 promote tumor cell invasion.Citation18 To determine whether Ta-DCs promoted tumor cell invasion entailed IL-6 and PGE2, SN-DCB16-F10-EXO was treated with IL-6 or PGE2-neutralizing monoclonal anbibodies (mAbs). Increased tumor cell invasion induced by SN-DCB16-F10-EXO was completely abolished after IL-6 blockage but showed no change after PGE2 blockage (). To further confirm this, the ability of SN-DCB16-F10-EXO from IL-6−/− mice (SN-DCB16-F10-EXO-IL-6−/−) in promoting tumor cell was examined. Expectedly, SN-DCB16-F10-EXO-IL-6−/− failed to enhance tumor cell invasion while SN-DCB16-F10-EXO from wild-type mice (SN-DCB16-F10-EXO-WT) did (). These results suggest that the Ta-DC-mediated increase in tumor cell invasion is IL-6 dependent.
Figure 2. IL-6 from Ta-DCs promoted tumor cell invasion through upregulation of MMP9 expression. (A-C) B16-F10 cells were cultured in supernatant from PBS- or B16-F10-EXO (5 μg/ml for 6 h)-stimulated BMDCs in the presence of 30 μg/ml of anti-IL-6, PGE2 or isotype control (ISO) mAbs (A), or BMDCs of WT or IL-6−/− mice (B) for 24 h. Their invasive ability was measured using an in vitro invasive assay (n = 5) (A, B). The MMP2, MMP9 and MMP13 protein levels in each supernatant-treated B16-F10 cells were detected by Western blot (C). (D, E) B16-F10 cells were cultured in supernatant from B16-F10-EXO (5 μg/ml for 6 h)-stimulated BMDCs from WT or IL-6−/− mice for 24 h, and the MMP9 protein level was detected by Western blot (D), or in the presence of 600 nm MMP9 inhibitor for 24 h. Then, the invasive ability of B16-F10 cells was measured using an in vitro invasive assay (n = 5) (E). (A, B, E) The results are shown as the mean ± SEM of 3 independent experiments. (C, D) One representative of 3 independent experiments is shown. Numbers indicate the ratio of gray values of the corresponding protein to that of β-Actin. P values were generated by one-way ANOVA, followed by a Tukey-Kramer multiple comparison test; **p < 0.01; ***p < 0.001; NS, not significant.
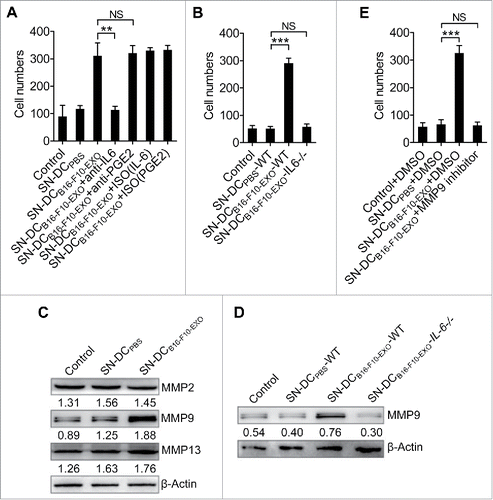
Matrix metalloproteinases (MMPs) play critical roles in tumor invasion because of their proteolytic activities, which are required to degrade the extracellular matrix and basement membrane.Citation19 It has been reported that IL-6 can induce MMP2, MMP9 and MMP13 expression to increase tumor cell invasion.Citation20–22 To better understand the effect of IL-6 on the process of the Ta-DC-mediated increased tumor cell invasion, we investigated MMP2, MMP9 and MMP13 expression in B16-F10 cells treated with SN-DCB16-F10-EXO. The mRNA levels of MMP9 but not MMP2 and MMP13 in B16-F10 cells were highly increased after treatment with SN-DCB16-F10-EXO (Fig. S2A). Likewise, only the MMP9 protein level substantially increased in B16-F10 cells after treatment with SN-DCB16-F10-EXO (). Gelatin zymography also confirmed a high increase of MMP9 but not MMP2 activity in supernatant from SN-DCB16-F10-EXO- rather than SN-DCPBS-treated B16-F10 cells (Fig. S2B). To elucidate whether IL-6 was responsible for the increased expression of MMP9, B16-F10 cells were treated with SN-DCB16-F10-EXO-IL-6−/−, and the increase in the MMP9 protein level could no longer be observed (). Again, gelatin zymography showed similar results (Fig. S2C). To confirm that the increased invasive ability of tumor cells induced by SN-DCB16-F10-EXO was mediated by MMP9, we treated B16-F10 cells with SN-DCB16-F10-EXO in the presence of MMP9 inhibitor. The increased invasive ability of B16-F10 cells induced by SN-DCB16-F10-EXO was completely abrogated (). Similarly, when MMP9 expression was knocked down by MMP9 siRNA, the invasive ability of B16-F10 cells, with or without SN-DCB16-F10-EXO treatment, exhibited no differences (Fig. S2D and E).
Altogether, these results demonstrate that IL-6 mediates Ta-DCs to promote tumor cell invasion in an MMP9-dependent fashion.
Activation of STAT3 by IL-6 from Ta-DCs increased transcription of MMP9
IL-6 signaling leads to activation of STAT3.Citation23 Then, we detected the STAT3 activation in B16-F10 cells and found that SN-DCB16-F10-EXO but not SN-DCB16-F10-EXO-IL-6−/− induced STAT3 activation (). After treatment with a STAT3-specific inhibitor, neither MMP9 mRNA or protein expression in B16-F10 cells could be induced by SN-DCB16-F10-EXO ( and ). Furthermore, after inhibition of STAT3 activity, SN-DCB16-F10-EXO also failed to induce MMP9 activity (). In concert with the inability to induce MMP9 activity, SN-DCB16-F10-EXO could not enhance the invasive ability of B16-F10 cells after STAT3 activity was inhibited ().
Figure 3. Activation of STAT3 by IL-6 from Ta-DCs increased transcription of MMP9. (A, B) B16-F10 cells were cultured in supernatant from PBS-stimulated BMDCs of WT mice or B16-F10-EXO (5 μg/ml for 6 h)-stimulated BMDCs of WT or IL-6−/− mice for the indicated time points. Then, the p-STAT3 and STAT3 protein levels were detected by Western blot (A), or with or without 2 μM of Stattic for 6 h. Then, the MMP9 mRNA level was detected by real-time PCR (B). (C-E) B16-F10 cells were cultured in supernatant from PBS- or B16-F10-EXO (5 μg/ml for 6 h)-stimulated BMDCs with or without 2 μM of Stattic for 24 h. Then, the MMP9 protein level was detected by Western blot (C), or the cells were collected and cultured in serum-free DMEM media for another 24 h. The MMP2 and MMP9 activity in the supernatant was detected by gelatin zymography (D), or the invasive ability of B16-F10 cells was measured using an in vitro invasive assay (n = 5) (E). (F) B16-F10 cells were stimulated with or without 10 ng/ml of IL-6 for 24 h, and the binding of STAT3 and the MMP9 promoter was examined by ChIP assay. (G) NIH-3T3 cells were transfected with MMP9-luc, along with STAT3 plasmids, with or without 10 ng/ml of IL-6 stimulation. Twenty-four hours later, luciferase activity was analyzed and normalized to that of Renilla luciferase. (A, C) Numbers indicate the ratio of gray values of the corresponding protein to that of STAT3 or β-Actin. (A, C, D) One representative of 3 independent experiments is shown. (B, E-H) The results are shown as the mean ± SEM of 3 independent experiments (n = 3). P values were generated by one-way ANOVA, followed by a Tukey-Kramer multiple comparison test; *p < 0.05; **p < 0.01; ***p < 0.001.
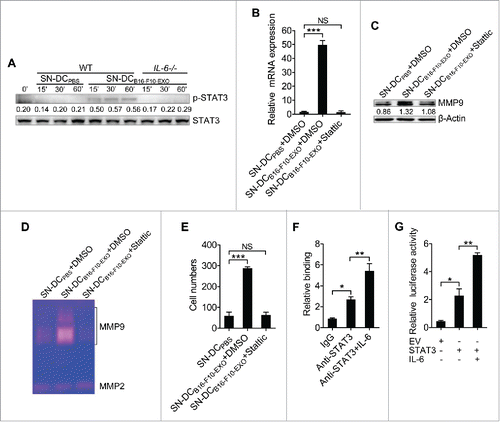
Phosphorylated STAT3 usually binds to the γ-interferon activation sequence (GAS)-like element in the promoter region of targeted genes.Citation24 Sequence analysis revealed that the MMP9 promoter region, from position −1999 to +100, harbors 12 GAS-like elements (TT(N4–6)AA) (Fig. S3). We therefore determined whether STAT3 bound to the MMP9 promoter in B16-F10 cells. Chromatin immunoprecipitation (ChIP) confirmed binding of STAT3 to the MMP9 promoter at position −1865 to −1858, and IL-6 stimulation further augmented this binding ().
To determine whether STAT3 can regulate MMP9 promoter activity, we cloned a murine MMP9 promoter (382 bp) into a luciferase reporter plasmid, which was named MMP9-luc. The construct was transfected into NIH-3T3 cells, and the activity was assessed with or without IL-6 stimulation. Transfection of the STAT3 vector but not the empty vector (EV) enhanced MMP9 promoter activity, and IL-6 stimulation further augmented this effect ().
Altogether, these results demonstrate that IL-6 from Ta-DCs phosphorylates STAT3 and, subsequently, that phosphorylated STAT3 promotes MMP9 transcription by binding to the MMP9 promoter.
HSP72 and HSP105 on the surface of TEXs mediated TLR2- and TLR4-dependent IL-6 secretion of DCs
Activation of TLR signaling plays a pivotal role in the secretion of inflammatory mediators by DCs.Citation25 After stimulation with B16-F10-EXO, increased phosphorylation of ERK, JNK, p38 and NF-κB in DCs was observed indicating activation of TLR signaling (Fig. A4A). TEX-induced IL-6 production of DCs was partially inhibited by TLR2 or TLR4 neutralizing mAbs, and completely abolished by TLR2 and TLR4 neutralizing mAbs (). These results indicate that TEXs induce DCs to produce increased IL-6 through activating TLR2 and TLR4 signaling.
Figure 4. HSP72 and HSP105 on the surface of TEXs mediated TLR2- and TLR4-dependent IL-6 secretion of DCs. (A) BMDCs were pre-incubated with anti-TLR2, TLR4 or both mAbs at a concentration of 30 μg/ml for 1 h, and BMDCs were stimulated with 5 μg/ml B16-F10-EXO for 6 h. IL-6 production from BMDCs was measured by ELISA. (B, C) Exosomes from B16-F10 cells transfected with HSP72, HSP105 or HSC70 siRNA, or NC siRNA were isolated. The HSP protein knockdown effect was detected by Western blot (B). BMDCs were stimulated with 5 μg/ml of the indicated B16-F10-EXO for 6 h, and IL-6 production from BMDCs was measured by ELISA (C). (D, E) After adsorption onto latex beads (D) or anti-CD63-coated latex beads (E), HSP72 and HSP105 on exosomes were detected by flow cytometry. (F, G) BMDCs were pretreated with 2.5 μg/ml cytochalasin D for 30 min, and co-cultured with CFSE-labeled B16-F10-EXO for 6 h. The uptake of B16-F10-EXO by BMDCs was detected by confocal microscopy (F), or stimulated with B16-F10-EXO for 6 h. IL-6 production by BMDCs was measured by ELISA (G). (B) Numbers indicate the ratio of gray values of the corresponding protein to that of CD63. (A, C, G) The results are shown as the mean ± SEM of 3 independent experiments (n = 3). (B, D, E, F) One representative of 3 independent experiments is shown. P values were generated by one-way ANOVA, followed by a Tukey-Kramer multiple comparison test; *p < 0.05 and ***p< 0.001 versus B16-F10-EXO in A.
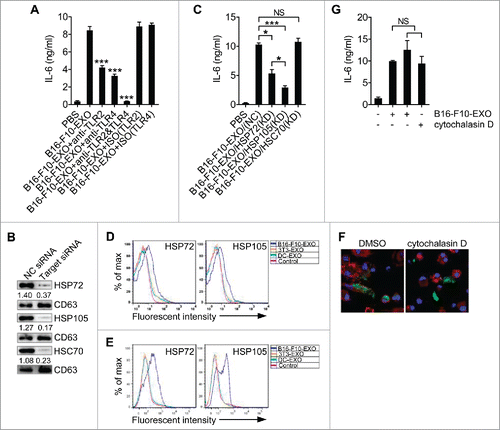
Next, we wanted to identify which TEX components were responsible for TLR2 and TLR4 activation and IL-6 secretion of DCs. Several HSP family members have been confirmed to be ligands of both TLR2 and TLR4,Citation26 which are enriched in exosomes. To clarify the role of HSPs in the TEX-induced IL-6 secretion of DCs, we isolated B16-F10-EXO from heat-stressed B16-F10 cells (HS-B16-F10-EXO), which have been reported to produce exosomes carrying higher levels of HSPs.Citation27 Compared with B16-F10-EXO, HS-B16-F10-EXO induced DCs to produce a strikingly higher level of IL-6 (Fig. S4B). In contrast, an HSP inhibitor, which decreased HSC70, HSP72 and HSP105 levels in B16-F10 cells and B16-F10-EXO (Fig. S4C), markedly inhibited IL-6 production of DCs (Fig. S4D). To clarify which HSP participated in TEX-induced IL-6 secretion of DCs, we knocked down (KD) HSC70, HSP72 or HSP105 in B16-F10 cells with corresponding siRNA and isolated B16-F10-EXO with lower HSC70, HSC72 or HSP105 (). B16-F10-EXO/HSP72(KD)- and B16-F10-EXO/HSP105(KD)- but not B16-F10-EXO/HSC70(KD)-treated DCs secreted decreased IL-6 compared with B16-F10-EXO(NC)-treated DCs (). In addition, B16-F10-EXO/HSP105(KD)-treated DCs secreted a lower amount of IL-6 than B16-F10-EXO/HSP72(KD)-treated DCs (). In contrast, exosomes from B16-F10 cells with HSP72 and HSP105 but not HSC70 OE (termed as B16-F10-EXO/HSP72(OE), B16-F10-EXO/HSP105(OE) or B16-F10-EXO/HSC70(OE), respectively) were more efficient in inducing IL-6 secretion of DCs, and B16-F10-EXO/HSP105(OE) induced more IL-6 than B16-F10-EXO/HSP72(OE) (Fig. S4E and F).
HSP72 on the surface of TEXs mediates a STAT3-dependent immunosuppressive function in mouse and human myeloid-derived suppressor cells.Citation28 We wanted to determine whether it was also HSP72 and HSP105 on the surface of B16-F10-EXO that mediated IL-6 secretion of DCs. Exosomes were directly adsorbed onto latex beads and HSP72 and HSP105 on the surface of exosomes were detected. We found that B16-F10-EXO contained higher levels of membrane-associated HSP72 than exosomes from 3T3 murine fibroblasts (3T3-EXO) or from DCs (DC-EXO), and membrane-associated HSP105 could only be detected on B16-F10-EXO (). To exclude that the increased levels of HSP72 and HSP105 we detected were not contaminated by soluble HSPs adsorbed onto the latex beads, we used anti-CD63-coated latex beads to capture exosomes and then detected the levels of HSP72 and HSP105. By this way, we got the similar results (). In addition, decreased membrane-associated HSP72 or HSP105 on B16-F10-EXO/HSP72(KD) or B16-F10-EXO/HSP105(KD) and increased membrane-associated HSP72 or HSP105 on B16-F10-EXO/HSP72(OE) or B16-F10-EXO/HSP105(OE) could also be detected (Fig. S4G). To elucidate it was HSP72 and HSP105 on the surface of B16-F10-EXO that induced DCs to secrete IL-6, we prevented DCs from taking up B16-F10-EXO with cytochalasin D (). Inhibition of B16-F10-EXO uptake showed no effect on B16-F10-EXO-induced IL-6 production of DCs, and cytochalasin D alone did not affect DC IL-6 production (). These results suggest that direct interaction but not fusion of TEXs and DCs is sufficient for B16-F10-EXO to induce IL-6 secretion by DCs.
Altogether, these results indicate that the capacity of TEXs to promote DC secretion of IL-6 depends on the activation of TLR2 and TLR4 signaling, which is membrane-associated HSP72- and HSP105-dependent.
HSP105 acts as a ligand of TLR2 and TLR4 to induce DC IL-6 production
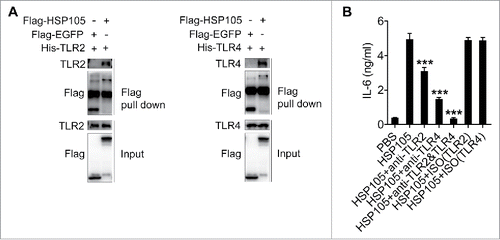
HSP72 has been reported to be the ligand of TLR2 and TLR4.Citation28,29 We wanted to know whether HSP72 or HSP105 on TEXs activate TLR2 signaling, TLR4 signaling, or both in DCs. Both TLR2 and TLR4 neutralizing mAbs reduced the B16-F10-EXO/HSP72(OE)-induced IL-6 increase of DCs (Fig. S5A). Moreover, TLR2 and TLR4 neutralizing mAbs also reduced the B16-F10-EXO/HSP105(OE)-induced IL-6 increase of DCs (Fig. S5B). HSP105 has been revealed to upregulate HSP72 gene expression,Citation30 and the B16-F10-EXO/HSP105(OE)-induced increase in IL-6 expression of DCs showed a similar inhibitory tendency as B16-F10-EXO/HSP72(OE) after TLR2 and TLR4 blockage (Fig. S5). Therefore, HSP105-mediated TLR2 and TLR4 signaling activation of DCs may not be direct but may instead be HSP72-dependent. To answer this question, we tested the interaction of HSP105 and TLR2 or TLR4. A pull-down assay confirmed that HSP105 protein directly interacted with both TLR2 and TLR4 (). In addition, endotoxin-free HSP105 protein directly stimulated DCs to secrete IL-6, and this effect was partially abrogated by TLR2 or TLR4 neutralizing mAbs and completely abolished by combined usage of TLR2 and TLR4 neutralizing mAbs (). These results indicate that HSP105 is a natural ligand for TLR2 and TLR4, which can directly activate TLR2 and TLR4 signaling in DCs.
Figure 5. HSP105 acts as a ligand of TLR2 and TLR4 to induce DC IL-6 production. (A) Affinity precipitation of recombinant His-TLR2 or His-TLR4 protein with Flag-EGFP or Flag-HSP105 protein, captured by anti-FLAG® M2 magnetic beads and analyzed by immunoblot analysis with Abs against TLR2 and TLR4. (B) BMDCs were pre-incubated with anti-TLR2, TLR4 or both mAbs at a concentration of 30 μg/ml for 1 h, and then stimulated with 2 μg/ml endotoxin-free Flag-EGFP or Flag-HSP105 protein for 6 h. IL-6 production was measured by ELISA (n = 3). (A) One representative of 3 independent experiments is shown. (B) The results are shown as the mean ± SEM of 3 independent experiments. P values were generated by one-way ANOVA, followed by a Tukey-Kramer multiple comparison test; *p < 0.05; **p < 0.01; ***p < 0.001.
Exosomes from tumor patients with increased membrane-associated HSP72 and HSP105 promoted DCs to induce tumor cell invasion via IL-6 in vitro
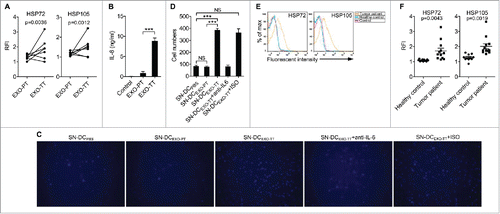
Next, we investigated whether exosomes from tumor patients could educate DCs to promote tumor invasion. First, we examined membrane-associated HSP72 and HSP105 on exosomes from tumor tissue (EXO-TT) and paracancerous tissue (EXO-PT) from 7 breast cancer patients whose information is summarized in Supplemental Table 1. We found that the relative fluorescence intensity (RFI) of HSP72 and HSP105 on EXO-TT was significantly higher than that on EXO-PT (). In line with their abundance of membrane-associated HSP72 and HSP105, EXO-TT but not EXO-PT markedly induced DCs to secrete IL-6 (). Expectedly, EXO-TT- but not EXO-PT-activated DCs substantially enhanced the invasive ability of MDA-MB-435S breast tumor cells in vitro ( and ). In addition, this effect was IL-6-dependent because IL-6 neutralizing mAbs completely abolished the effect ( and ). Together, these results indicate that EXO-TT, with high levels of membrane-associated HSP72 and HSP105, can educate DCs to promote tumor cell invasion via IL-6.
Figure 6. Exosomes from tumor patients with increased membrane-associated HSP72 and HSP105 induced DCs to promote tumor cell invasion via IL-6 in vitro. (A) After adsorption onto latex beads, HSP72 and HSP105 on EXO-PT and EXO-TT were detected by flow cytometry. RFI was calculated by dividing mean fluorescence intensity of samples staining with detection Abs by that of sample staining with ISO Abs (n = 7). (B) Human DCs were induced from PBMCs and stimulated with 5 μg/ml of EXO-PT or EXO-TT from breast tumor tissues for 6 h. The IL-6 production was measured by ELISA (n = 3). (C) MDA-MB-435S cells were cultured in supernatant from PBS-, EXO-PT- or EXO-TT (5 μg/ml for 6 h)-stimulated DCs with or without 30 μg/ml of anti-IL-6 or ISO mAbs for 24 h. Then, their invasive ability was measured using an in vitro invasive assay, and the cells on the bottom of the Transwell filter were imaged and quantified (Magnification: 200 ×). (D) The results of (C) were statistically analyzed (n = 5). (E, F) After adsorption onto latex beads, HSP72 and HSP105 on exosomes from sera of breast tumor patients or healthy controls were detected by flow cytometry. One representative result of 12 is shown (E). RFI was calculated and statistically analyzed (F). (B, D) The results are shown as the mean ± SEM of 3 independent experiments. (C) One representative of 3 independent experiments is shown. P values were generated by 2-tail student's t-test in A, F, and by one-way ANOVA, followed by a Tukey-Kramer multiple comparison test in B, D; ***p < 0.001.
Given that membrane-associated HSP72 and HSP105 are increased on EXO-TT, we questioned whether tumors could be predicted by measuring HSP72 and HSP105 on exosomes from sera of tumor patients. Sera from 11 healthy volunteers and 12 breast tumor patients were collected for analysis, and their information is summarized in Supplemental Table 2. Notably, exosomes from sera of breast tumor patients had more membrane-associated HSP72 and HSP105 than exosomes from sera of healthy volunteers (). The RFI of HSP72 and HSP105 on exosomes from sera of breast tumor patients was also significantly higher than that from sera of healthy volunteers (). To confirm increased levels of membrane-associated HSP72 and HSP105 are a general feature of neoplastic diseases, we also detected that on exosomes from sera of 13 lung tumor patients, whose information is summarized in Supplemental Table 2. The RFI of HSP72 and HSP105 on exosomes from sera of lung tumor patients was also significantly higher than that from sera of healthy volunteers (Fig. S6). In addition, we collected sera from 16 non-tumor patients with an acute infection grouped by C-reactive protein higher than 10 mg/l. The RFI of HSP72 and HSP105 on exosomes from sera of acute infection patients was not significantly higher than that from sera of healthy volunteers (Fig. S6), suggesting that increased levels of membrane-associated HSP72 and HSP105 on serous exosomes probably are tumor specific. Altogether, these results strongly demonstrate that membrane-associated HSP72 and HSP105 on serous exosomes are promising predictors of tumors.
HSP72- and HSP105-mediated Ta-DCs promoted B16-F10 tumor lung metastasis via an IL-6/MMP9 pathway in vivo
To investigate the effect of Ta-DCs on tumor metastasis in vivo, we performed tumor metastasis experiments with a B16-F10 cell-induced murine lung metastasis model. We found that SN-DCB16-F10-EXO-WT markedly promoted B16-F10 cell lung metastasis, as demonstrated by gross morphology of the lungs () and the number of invasive nodules (). Similar to the effect on tumor cell invasion in vitro, SN-DCB16-F10-EXO-IL-6−/− had no effect on promoting B16-F10 cell lung metastasis ( and ). Histological assessment of the lungs revealed a similar metastatic appearance (Fig. S7). In addition, we obtained the similar results from the 4T1 cell-induced murine lung metastasis model (Fig. S8). To elucidate the role of MMP9 in this process, we established B16-F10 cells with stable MMP9 knockdown (B16-F10-MMP9 (KD)) and confirmed the knockdown effect of MMP9 in B16-F10 cells (). When B16-F10-MMP9 (KD) were used in the lung metastasis model, SN-DCB16-F10-EXO no longer promoted tumor lung metastasis ( and ). In addition, we found that both SN-DCB16-F10-EXO/HSP72(OE) and SN-DCB16-F10-EXO/HSP105(OE) showed a much greater ability to promote B16-F10 cell lung metastasis than did SN-DCB16-F10-EXO/(EV) ( and ). Consistent with their relative abilities to induce IL-6 production of DCs, the effect on promotion of B16-F10 cell lung metastasis of SN-DCB16-F10-EXO/HSP105(OE) was stronger than SN-DCB16-F10-EXO/HSP72(OE) ( and ). Together, these results provide substantial evidence that Ta-DCs promote tumor lung metastasis via an IL-6/MMP9 pathway in vivo depending on HSP72 and HSP105.
Figure 7. HSP72 and HSP105 mediated Ta-DCs promotion of B16-F10 tumor lung metastasis via an IL-6/MMP9 pathway in vivo. (A, B) B16-F10 cells were cultured in supernatant from PBS-stimulated BMDCs of WT mice, or B16-F10-EXO (5 μg/ml for 6 h)-stimulated BMDCs of WT or IL-6−/− mice for 24 h. Then, 5 × 10⁵ tumor cells were intravenously injected into mice, and these mice were killed 15 d later. Representative gross morphology of the lungs is shown (A). Numbers of invasive nodules in the lungs were counted and statistically analyzed (B). (C) The MMP9 protein level in B16-F10-MMP9(KD cells was detected by Western blot. (D, E) B16-F10-MMP9(KD) cells were cultured in supernatant from B16-F10-EXO (5 μg/ml for 6 h)-stimulated BMDCs for 24 h. Then, 5 × 10⁵ tumor cells were intravenously injected into mice, and these mice were killed 15 d later. Representative gross morphology of the lungs is shown (D). Numbers of invasive nodules in the lungs were counted and statistically analyzed (E). (F, G) B16-F10 cells were cultured in supernatant from B16-F10-EXO/(EV)-, B16-F10-EXO/HSP72(OE)- or B16-F10-EXO/HSP105(OE) (5 μg/ml for 6 h)-stimulated BMDCs for 24 h. Then, 5 × 10⁵ tumor cells were intravenously injected into mice, and these mice were killed 15 d later. Representative gross morphology of the lungs is shown (F). Numbers of invasive nodules in the lungs were counted and statistically analyzed (G). (C) Numbers indicate the ratio of gray values of MMP9 to that of β-Actin. (A, C, D, F) One representative of 3 independent experiments is shown. (B, E, G) The results are shown as the mean ± SEM of 3 independent experiments (n = 5). P values were generated by one-way ANOVA, followed by a Tukey-Kramer multiple comparison test; **p < 0.01; ***p < 0.001. Control indicates B16-F10 cells without any treatment.
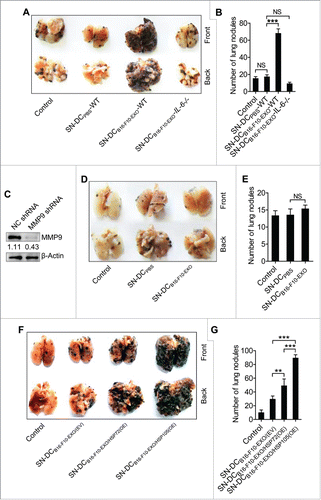
Figure 8. Depletion of IL-6 signaling converted TEXs from promoters to inhibitors of tumor metastasis in vivo. (A, B) Mice were intravenously injected with 100 μl of PBS or 10 μg/100 μl of B16-F10-EXO labeled with or without PKH26 and killed 24 h later. Then, DCs and nuclei in the sections of spleens were stained with CD11c and DAPI, respectively. The binding of DCs and B16-F10-EXO was detected with an immunofluorescence assay. Arrows indicate the binding (A). DCs in splenocytes were isolated. The expression of MHC-II, CD80, CD86 and CD40 molecules on DCs were detected by flow cytometry (B). (C, D, E) Mice with an intravenous injection of 5 × 10⁵ B16-F10 or B16-F10/OVA cells on day 0, were intravenously injected with 100 μl of PBS, 10 μg/100 μl of B16-F10-EXO or B16-F10/OVA-EXO on days 4, 7 and 10. Mice were killed and numbers of invasive nodules in the lungs were counted and statistically analyzed on day 15 (n = 5) (C). The OVA257–264 peptide specific CD8+ T cells in the lungs were detected by Tetramer assay (D). Data in (D) were statistically analyzed (n = 3) (E). (A, B, D) One representative of 3 (A, B) or 2 (D) independent experiments is shown. (C, E) The results are shown as the mean ± SEM of 3 independent experiments. P values were generated by a 2-tail student's t-test.
Depletion of IL-6 signaling converted TEXs from promoters to inhibitors of tumor metastasis in vivo
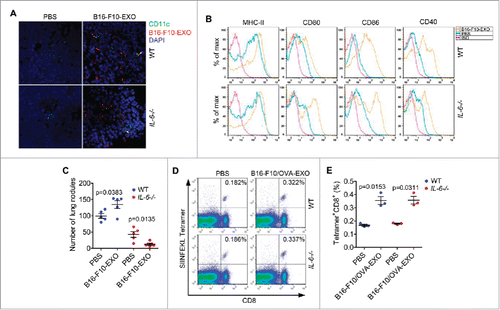
As described above, TEXs induced DC maturation, which is beneficial for antitumor immune responses. We interrogated whether TEXs could activate DCs in vivo. We found that B16-F10-EXO could directly bind spleen DCs in WT and IL-6−/− mice after in vivo administration (). We also observed increased MHC-II, CD80, CD86 and CD40 expression on DCs from both splenocytes of WT and IL-6−/− mice treated with B16-F10-EXO in vivo (). The capability to induce DC maturation in vivo was partially but not completely inhibited when administration with B16-F10-EXO/HSP72(KD) or B16-F10-EXO/HSP105(KD) (Fig. S9), suggesting B16-F10-EXO-induced DC maturation is HSP72 or HSP105 dependent. Based on the above results, we speculated that by blocking the tumor-promoting effect mediated by IL-6, TEXs may exhibit antitumor effects. To test our hypothesis, we transferred B16-F10-EXO into WT or IL-6−/− mice, along with B16-F10 cells. We found that the basic level of B16-F10 cell lung metastasis in IL-6−/− mice was lower than that in WT mice (), indicating the pivotal role of IL-6 in tumor metastasis. As expected, B16-F10-EXO substantially promoted B16-F10 cell lung metastasis in WT mice. However, B16-F10-EXO significantly inhibited B16-F10 cell lung metastasis in IL-6−/− mice (). To further confirm that TEXs could stimulate antitumor immune responses in vivo, we established tumor lung metastasis model by using B16-F10 cells stable overexpression of ovalbumin (OVA) protein (B16-F10/OVA). We observed the similar lung metastasis tendency in WT and IL-6−/− mice after exosomes from B16-F10/OVA cells (B16-F10/OVA-EXO) administration (data not shown). Then we detected the percentage of OVA257–264 (SIINFEKL) peptide specific CD8+ T cells in the lungs and found that the percentage increased in both WT and IL-6−/− mice treated with B16-F10/OVA-EXO when compared with that without B16-F10/OVA-EXO treatment. In addition, there was no difference in the increased percentage between WT and IL-6−/− mice (, ). These results indicate that blocking IL-6 signaling reversed the effect of TEXs on tumor metastasis.
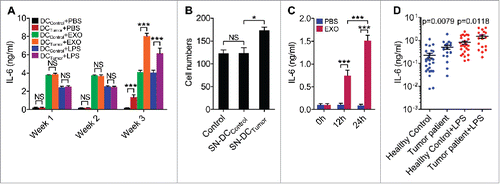
Figure 9. DCs with enhanced IL-6-secretion capacity were found in tumor-bearing mice and patients. (A, B) Mice were subcutaneously inoculated with 5 × 10⁵ B16-F10 cells, and mice without tumor inoculation were used as controls. Then, DCs from splenocytes were isolated 1 week, 2 weeks or 3 weeks later and stimulated with PBS, 5 μg/ml B16-F10-EXO or 100 ng/ml of LPS for 6 h. IL-6 production by DCs was detected by ELISA (n = 3) (A). DCs from splenocytes were isolated 3 weeks later and cultured in vitro for 6 h. Culture supernatant was collected and B16-F10 cells were cultured in this supernatant for 24 h. Then, the invasive ability of B16-F10 cells was measured (n = 5). Control indicates B16-F10 cells without any treatment (B). SN-DCPBS or SN-DCtumor denotes supernatant from DCs of healthy control mice or tumor mice, respectively. (C) Mice were intravenously injected with 100 μl of PBS or 10 μg/100 μl of B16-F10-EXO. Then, DCs from splenocytes were isolated 12 or 24 h later and cultured in vitro for 6 h. IL-6 production by DCs was detected by ELISA (n = 3). (D) Human DCs were isolated from PBMCs from healthy volunteers (n = 27) or breast tumor patients (n = 18) and cultured in vitro for 6 h with or without 100 ng/ml LPS. IL-6 production by DCs was detected by ELISA. The results are shown as the mean ± SEM of 3 independent experiments or of all detected samples. P values were generated by a 2-tail student's t-test.
DCs with enhanced IL-6-secretion capacity could be found in tumor-bearing mice and patients
As tumors progress, more TEXs may be released, which would induce DCs to secrete high levels of IL-6. We isolated DCs from splenocytes of mice that were inoculated with tumors for different lengths of time and detected their ability to secrete IL-6. Three weeks after inoculation with the tumor, DCs secreted higher levels of IL-6 than those from mice without tumor inoculation (). In addition, DCs from tumor mice showed a stronger potential to secrete IL-6 when restimulated with TEXs or lipopolysaccharide (LPS) in vitro (). Because DCs from tumor mice secreted higher levels of IL-6, we then examined their ability to induce tumor invasion. As expected, DCs from tumor mice mediated increased B16-F10 tumor cell invasion when compared with those from healthy mice (). To reveal whether TEXs could induce DCs to secrete IL-6 in vivo, we intravenously transferred B16-F10-EXO into mice and detected the IL-6-secretion ability of DCs from splenocytes. DCs from mice injected with B16-F10-EXO for both 12 h and 24 h exhibited significantly increased IL-6 production (). These results reveal that TEXs induce DCs of tumor-bearing mice to secrete high levels of IL-6, which will promote tumor invasion.
Finally, we evaluated the IL-6-secreting ability of DCs from breast tumor patients and healthy volunteers. The information of the tumor patients and healthy volunteers is summarized in Supplemental Tables 3. DCs from tumor patients secreted a higher level of IL-6 than those from healthy volunteers with or without LPS stimulation (). These results indicate that DCs from tumor patients have an increased capacity to produce IL-6.
Discussion
DC-based vaccines are a promising approach to cancer immunotherapy. Almost 1000 clinical trials have been performed to evaluate the effect of DC-based antitumor vaccines, and clinical responses were observed in approximately half of the trials.Citation31 However, despite the original intention of scientists to design an antitumor DC vaccine, many tumor patients are insensitive to these vaccines. Furthermore, in some cases, tumors might increase in size and new lesions might appear in the early phase of DC-vaccine treatment,Citation32 suggesting the possibility that DC vaccines accelerate tumor progress. In this study, we found that Ta-DCs enhanced IL-6 production, which promoted tumor metastasis via MMP9. DC vaccines are likely activated by TEXs and are potentially capable of converting tumor inhibitors into tumor promoters after injection into patients. Thus, blockage of IL-6 is an advisable strategy to improve the antitumor efficacy of DC-based vaccines.
In the primary tumor, in addition to TEXs, tumor cells can also mediate improvement of their own invasive ability by activating DCs. Therefore, TEXs may primarily amplify this effect of tumor cells in solid tumors. TEXs can be detected in the serum of pancreatic cancer patients at a very early stage.Citation33 It can be imagined that before detachment from the primary tumor and migration into the circulatory system, tumor cells can also activate DCs to secrete IL-6 by releasing exosomes. In addition, in contrast to tumor cells, which need to degrade the basement membrane to achieve remote metastasis, TEXs can easily pass through the basement membrane because of their size advantage. Therefore, TEXs can enter metastatic organs ahead of tumor cells and activate DCs residing in the organs to secrete IL-6, which favors the formation of a pre-metastatic niche for tumors. In all these process, TEXs have unique functions and exert effects that tumor cells cannot achieve.
Since TEXs were first determined to have potent antitumor effects,Citation34 accumulating evidence has strengthened the prospective of using TEXs in tumor therapy.Citation35–37 However, TEXs have also been revealed to promote tumor development.Citation38,39 More than that, exosomes from the murine mammary carcinoma cell line TS/A are reported to possess completely opposite effect on tumor growth.Citation34,40 Why these diametrically opposed results were observed is still unknown. Unlike a cytokine or a drug, which probably shows a single effect on tumors, TEXs contain many components, including a variety of proteins and genetic information from parental cells. Among these components, a portion of them are tumor inhibitory and another portion are tumor synergic. Collectively, the role of TEXs in tumor progression is likely determined by which portion of the force is predominant in vivo. In our tumor metastatic model, depletion of IL-6 in the host converted TEXs from tumor promoters to inhibitors. At the same time, we also found that TEXs could induce more antigen-specific CD8+ T cells in the lungs regardless of IL-6, which may result from similar maturation of DCs from WT and IL-6−/− mice induced by TEXs in vivo. These results suggest that, without IL-6 depletion, the tumor invasion-promoting effect mediated by IL-6 is overwhelming, and the apparent effect of TEXs on the tumor is promotion of tumor metastasis. Once this effect is abolished, the activation and maturation effect of TEXs on DCs and the subsequent antitumor T cell responses elicited by DCs become dominant, resulting in TEXs to show ability in inhibiting tumor metastasis, which was previously hidden. As potent immunosuppressive cytokines, IL-10 and TGF-β1 have been demonstrated to be the mediators of TEX promotion of tumor development.Citation41–43 Building on our hypothesis, abolishment of their expression in parental cells can produce TEXs without IL-10 and/or TGF-β1, which likely convert tumor-promoting TEXs to tumor-inhibitory TEXs. In addition, in this way, TEXs with original antitumor effects might greatly increase their antitumor effect.
Although HSP105 has been revealed to upregulate HSP72 gene expression,Citation30 and the B16-F10-EXO/HSP105(OE)-induced increase in the IL-6 expression of DCs showed a similar inhibitory tendency to B16-F10-EXO/HSP72(OE) after TLR2 and TLR4 blockage. HSP105 on B16-F10-EXO appeared to be more potent in inducing IL-6 secretion of DCs. In addition, we confirmed that HSP105 could directly interact with TLR2 and TLR4, and HSP105 induced IL-6 secretion of DCs through TLR2 and TLR4. Therefore, for the first time, we reveal that HSP105 acts as a ligand of TLR2 and TLR4. Though HSP72 and HSP105 on TEXs are implicated in TLR2 and TLR4 signaling activation of DCs, based on our current data, we could not distinguish the individual roles of HSP72 or HSP105 on B16-F10-EXO in the TLR2 and/or TLR4 signaling activation of DCs. Furthermore, the possibility that other molecules on TEXs may also mediate TLR2 and TLR4 signaling activation of DCs cannot be excluded.
Notably, there were barely any HSP72 and HSP105 molecules on exosomes from normal cells. In addition, the levels of HSP72 and HSP105 on EXO-TT were significantly higher than those on EXO-PT. These data suggest that the presence of HSP72 and HSP105 on exosomes is related to tumors. Although the levels of membrane-associated HSP72 or HSP105 on exosomes from sera of tumor patients alone were not absolutely higher than those of healthy people, in the samples we examined, there were no patients whose serum exosomes had lower amounts of both membrane-associated HSP72 and HSP105 than healthy people. Therefore, combined examination of HSP72 and HSP105 on serum exosomes is likely a sensitive protocol for tumor prediction. To further elucidate the value of this protocol, discrimination of the levels of HSP72 and HSP105 on serum exosomes of early-stage tumor patients and healthy people is necessary.
In summary, our data reveal that, consistent with HSP72, HSP105 is also a ligand of TLR2 and TLR4. Membrane-associated HSP72 and HSP105 of TEXs synergistically induce IL-6 secretion of DCs, which is dependent on TLR2 and TLR4. This, subsequently, promotes tumor metastasis through enhancing MMP9 expression in a STAT3-dependent manner (Fig. S10). Depletion of IL-6 converts TEXs from promoters to inhibitors of tumor metastasis in vivo. Furthermore, our results also hint at the possibility of HSP72 and HSP105 on serum exosomes as markers for tumor prediction. Altogether, our results reveal a novel mechanism for tumor metastasis, mediated by TEXs, and the complexity of TEXs in tumor development.
Materials and methods
Reagents and Abs
Matrigel matrix basement membrane was purchased from BD Biosciences. Recombinant mouse and human granulocyte/macrophage colony-stimulating factor (GM-CSF), mouse PGE2 ELISA kits, recombinant His-TLR2, His-TLR4/MD-2 complex, and mouse (MAB406) and human (MAB2061R) neutralizing IL-6 mAbs were purchased from R&D Systems. Anti-PGE2 Ab (2B5) was purchased from Cayman Chemical. Mouse IL-4, IL-6 and human IL-4 were purchased from PeproTech. Primary Abs against p-p65 (#3033), p-p38 (#4511), p-ERK1/2 (#4370), p-JNK (#9255), p-IRF3 (#4947), p-STAT3 (#9145), STAT3 (#9139), β-actin (#4970), and HRP-linked secondary Abs, were purchased from Cell Signaling Technology. Primary Abs against GRP94 (ab3674), Calnexin (ab22595), GM130 (ab52649), Alix (ab117600), CD63 (ab193349), TSG101 (ab83), HSC70 (ab51052), HSP70/72 (ab181606), HSP105 (ab108625), CD11c (ab33483), goat anti-Armenian Hamster IgG H&L (Texas Red®) and goat anti-Armenian Hamster IgG H&L (Alexa Fluor® 488) were from Abcam. Primary Abs against MMP2 (10373–2-AP), MMP9 (10375–2-AP), and MMP13 (18165–1-AP) were from Proteintech Group, Inc. Rat anti-mouse TLR4-MD2 complex (117608) and mouse anti-mouse/human TLR2 (309710) were obtained from BioLegend. F(ab’)2 anti-rabbit IgG FITC (11–4839–81), PE-conjugated anti-mouse CD40 (12–0401–81), CD80 (12–0801–81), CD86 (12–0862–81), MHC-II (12–5321–81), mouse and human IL-6, and mouse IL12p70 ELISA kits were purchased from eBioscience. Transfection reagents, JetPEI® and INTERFERin@, were purchased from Polyplus Transfection. CD11c microbeads were purchased from Miltenyi Biotec. Human pan-DC pre-enrichment kit was from StemCell Technologies. ToxinEraser™ Endotoxin Removal Kit was purchased from GenScript. SB-3CT (MMP9 inhibitor) and Stattic (STAT3 inhibitor) were purchased from Selleck Chemicals. Heat shock protein inhibitor I and cytochalasin D were purchased from Santa Cruz Biotechnology. Gelatin was from aMRESCO. Anti-FLAG® M2 magnetic beads, FLAG® peptide and PKH26 red fluorescent cell linker midi kit were from Sigma-Aldrich. MHC I-Strep H-2 Kb; Ovalbumin; SIINFEKL were from IBA Lifesciences.
Human samples
Human blood samples from healthy controls and cancer patients, as well as human PTs and TTs, were obtained from the Zhejiang Cancer Hospital. Human blood samples from patients with an acute infection were from the Second Affiliated Hospital, Zhejiang University. The blood samples of tumor patients were collected before chemotherapy, radiotherapy or surgery treatment. The collection of human samples was approved by the local Ethical Committee and the Review Board of the Zhejiang Cancer Hospital and the Second Affiliated Hospital, Zhejiang University. All the patients were informed of the use of the samples and consent forms were obtained.
Mice and cell lines
Female C57BL/6J (6- to 8-week-old) mice were purchased from Joint Ventures Sipper BK Experimental Animal Co. IL6−/− mice were purchased from Jackson Laboratory. Mice were housed in a specific pathogen-free facility, and the experimental protocols were approved by the Animal Care and Use Committee of the School of Medicine, Zhejiang University. Murine B16-F10, 3LL and 4T1 tumor cells and human MDA-MB-435S breast tumor cells were purchased from American Type Culture Collection. B16-F10/OVA cells were established and preserved in our laboratory. B16-F10, B16-F10/OVA and NIH-3T3 cells were cultured in exosome-free DMEM supplemented with 10% FBS; 3LL, 4T1 cells and MDA-MB-435S cells were maintained in exosome-free RPMI 1640 medium supplemented with 10% FBS.
DC generation
Murine BMDCs were prepared as described previously.Citation44 Briefly, bone marrow mononuclear cells were prepared from mouse (6 – 8 weeks old) tibia and femur suspensions by depletion of red cells and cultured at a density of 2 × 10⁶ cells/ml in 6-well plates in RPMI 1640 medium supplemented with 10% FBS, 10 ng/ml recombinant murine GM-CSF and 1 ng/ml mouse IL-4. Non-adherent cells were gently washed out after 48 h of culture; the remaining loosely adherent clusters were cultured for another 48 h and harvested for subsequent experiments. To generate human DCs, peripheral blood mononuclear cells (PBMCs) from healthy volunteers were isolated by density centrifugation of heparinized blood on LSM® (MP Biomedicals), resuspended in culture medium and allowed to adhere in 6-well plates. After 2 h at 37°C, nonadherent cells were removed and adherent cells were cultured in 3 ml of medium containing GM-CSF (10 ng/ml) and IL-4 (1 ng/ml). After 3 days, 1.5 ml of medium was removed and replaced by the same volume of fresh medium containing GM-CSF and IL-4. After 7 d of culture, DCs were harvested, washed, and used for subsequent experiments.
Exosome isolation
B16-F10, B16-F10/OVA, 3LL and 4T1 cell culture supernatants were collected. Human TTs and PTs from breast tumor patients were homogenized in PBS and subjected to centrifugation to collect supernatants. The cell culture supernatants, TT or PT supernatant and sera of tumor patients, patients with an acute infection or healthy people were differentially centrifuged at 300 × g for 10 min, 1,200 × g for 20 min, and 10,000 × g for 30 min at 4°C. The supernatants from the final centrifugation were ultracentrifuged at 100,000 × g for 1 h at 4°C. After removing the supernatants, the exosomal pellets were washed in a large volume of ice-cold PBS and centrifuged at 100,000 × g for another 1 h at 4°C. The final pellets were resuspended in PBS. All exosomes were free of endotoxin, as confirmed by a Limulus amebocyte lysate assay (Lonza), with a detection sensitivity of 0.1 EU/ml. The amount of exosomal proteins recovered was measured by a BCA assay (Thermo Fisher).
Transmission electron microscopy
Exosomes were isolated and diluted in 100 μl of PBS, and 20 μl of the suspension was placed onto formvar carbon-coated copper grids at RT for 1 min. The excess suspension was removed using filter paper. Exosomes were stained by 2% phosphotungstic acid at RT for 5 min. The grids were then fixed with 2.5% glutaraldehyde at RT for 5 min, followed by rinsing with PBS 3 thrice. Images were observed with a Philips Tecnai-10 transmission electron microscope operating at 80kV (Phillips Electronic Instruments).
Western blot and flow cytometry analysis
A total of 20 μg of exosomes or crude proteins extracted from cell lysates was separated by 12% SDS-PAGE and transferred onto a polyvinylidene difluoride membrane (Millipore). The membrane was blocked with 5% BSA in TBST and then incubated with corresponding primary Abs overnight at 4°C. After incubating with HRP-coupled secondary Abs for 1 h, the membranes were scanned using a Tanon 4500 Gel Imaging System. The gray value of each band was measured by Image J 1.8.0 software (NIH). For flow cytometry analysis, exosomes were coated onto 4-μm-diameter aldehyde/sulfate latex beads, as described previously.Citation45 To determine the expression of MHC-II, CD80, CD86 and CD40 on DCs after TEX treatment in vivo, mice were intravenously injected with 100 μl of PBS, 10 μg/100 μl of B16-F10-EXO, B16-F10-EXO/HSP72(KD), B16-F10-EXO/HSP105(KD) or B16-F10-EXO(NC) and killed 24 h later. Then, DCs in splenocytes were isolated using CD11c microbeads, according to the manufacturer's instructions, followed by staining with corresponding fluorescence-labeled Abs on ice for 30 min. The levels of MHC-II, CD80, CD86 and CD40 on DCs were detected by a FACSCalibur flow cytometer (Becton Dickinson).
Real-time PCR
Total RNA was extracted using TRIzol reagent (Thermo Fisher Scientific), following the manufacturer's protocol. The cDNAs were synthesized using a cDNA synthesis kit (Takara), following the manufacturer's instructions. Real-time PCR was conducted using SYBR Green (Takara). The following PCR conditions were used: 1 cycle at 95°C for 30s and then 40 cycles of 5s at 95°C and 34s at 60°C. Real-time PCR was performed on an Applied Biosystems 7500 real-time PCR system. The following primers were used for real-time PCR:
Mouse MMP2, F: 5′-CAAGGATGGACTCCTGGCACAT-3′, R: 5′-TACTCGCCATCAGCGTTCCCAT-3′;
Mouse MMP9, F: 5′-GCTGACTACGATAAGGACGGCA-3′, R: 5′-TAGTGGTGCAGGCAGAGTAGGA-3′;
Mouse MMP13, F: 5′-GATGACCTGTCTGAGGAAGACC-3′, R: 5′-GCATTTCTCGGAGCCTGTCAAC-3′;
Mouse β-actin, F: 5′-CGTTGACATCCGTAAAGACC-3′, R: 5′-AACAGTCCGCCTAGAAGCAC-3′.
Measurement of cytokines
After 7 d of culture, 5 × 10⁵ BMDCs of WT or IL-6−/− mice and human DCs were cultured in RPMI 1640 medium, supplemented with 10% FBS, in a 24-well plate for 6 h at 37°C. BMDCs were stimulated with PBS or 5 μg/ml B16-F10-EXO, 3LL-EXO or 4T1-EXO for 6 h. For specific experiments, BMDCs were pre-incubated with 30 μg/ml anti-TLR2, TLR4 or both neutralizing mAbs for 1 h before B16-F10-EXO stimulation. Human DCs were stimulated with 5 μg/ml EXO-PT or EXO-TT for 6 h. The levels of mouse IL-6, PGE2, IL-12p70 and human IL-6 in the supernatants were measured by ELISA, according to the manufacturer's instructions. To determine the IL-6 production of DCs from tumor mice, DCs were isolated with CD11c microbeads from splenocytes of mice that were subcutaneously inoculated with 5 × 10⁵ B16-F10 cells for 1 week, 2 weeks or 3 weeks. Then, DCs were stimulated with PBS, 5 µg/ml of B16-F10-EXO or 100 ng/ml of LPS for 6 h. Human DCs were isolated from PBMCs using a human pan-DC pre-enrichment kit and cultured with or without 100 ng/ml LPS for 6 h in vitro. Mouse or human IL-6 levels in the culture supernatants were measured by ELISA.
Construction of expression plasmids
HSC70, HSP72 and HSP105 genes were amplified from B16-F10 cells by reverse transcription PCR and ligated into pcDNA3.1-Flag to construct Flag-tagged expression plasmids; STAT3 was amplified from B16-F10 cells by reverse transcription PCR and ligated into pCMV-Tag 2B to construct STAT3 expression plasmids.
Plasmid and siRNA transfection
B16-F10 and NIH-3T3 cells were transfected with plasmids using JetPEI® Transfection Reagent, according to the manufacturer's protocol. B16-F10 cells were transfected with targeted siRNA or NC siRNA, as follows, using INTERFERin@ Transfection Reagent, according to the manufacturer's instructions.
HSC70 siRNA, F: 5′-CCCGCUUACUUCAAUGACUdTdT-3′, R: 5′-AGUCAUUGAAGUAAGCGGGdTdT-3′;
HSP72 siRNA, F: 5′-CAAUCAAGUCCUAGACUUAdTdT-3′, R: 5′-UAAGUCUAGGACUUGAUUGdTdT -3′;
HSP105 siRNA, F: 5′-CCAUGCUGCUGACUAAGUUAAdTdT-3′, R: 5′-UUAACUUAGUCAGCAGCAUGGdTdT -3′;
MMP9 siRNA, F: 5′-AAGGACGGCAAAUUUGGUUUCdTdT-3′, R: 5′-GAAACCAAAUUUGCCGUCCUUdTdT-3′;
NC siRNA, F: 5′-UUCUCCGAACGUGUCACGUdTdT-3′,R: 5′-ACGUGACACGUUCGGAGAAdTdT-3′.
Cell proliferation assay
Supernatants of BMDCs stimulated with PBS, 5 μg/ml of B16-F10-EXO, 3LL-EXO or 4T1-EXO for 6 h were collected. Then, B16-F10, 3LL or 4T1 tumor cells were cultured in the corresponding supernatant for 24 h. The cells (2.5 × 10⁵/ml) were collected and cultured in a 96-well plate in 200 μl of fresh medium for another 24, 48, or 72 h, and 20 μl of alamarBlue (Thermo Fisher Scientific) was added per well for 6 h. The fluorescence intensity was detected using a DTX 880 multimode detector (Beckman Coulter).
Migration assay
B16-F10, 3LL or 4T1 cells (1 × 10⁶/ml) were cultured in supernatant from corresponding 5 μg/ml exosome-stimulated BMDCs for 24 h at 37°C. Then, 2 × 10⁴ B16-F10, 1 × 10⁴ 3LL or 2 × 10⁴ 4T1 cells in 100 μl of serum-free media were seeded into the top chamber. The bottom chamber was filled with 800 μl of medium containing 20% serum. After being cultured for 18 h at 37°C, cells were fixed with methanol for 20 min and washed with PBS 3 times. The fixed cells were stained with 10 μg/ml DAPI for 30 min and washed with PBS. The stained cells were examined using a fluorescence microscope.
Invasion assay
After rehydration using a 6-fold volume of serum-free media, 50 μl of Matrigel was added on an 8-μm polycarbonate membrane in 24-well Transwell plates, and the Matrigel was solidified at 37°C. Then, 2 × 10⁵ B16-F10, 3 LL, 4T1 or MDA-MB-435S cells were cultured in supernatant from corresponding exosome-stimulated BMDCs in a 24-well plate for 24 h at 37°C. Then, 5 × 10⁴ B16-F10, 2 × 10⁴ 3LL, 5 × 10⁴ 4T1 or 5 × 10⁴ MDA-MB-435S cells in 100 μl of serum-free media were seeded into the top chamber. The bottom chamber was filled with 800 μl of medium containing 20% FBS. After being cultured for 48 h at 37°C, cells were fixed with methanol for 20 min and washed with PBS 3 times. The fixed cells were stained with 10 μg/ml DAPI for 30 min and washed with PBS. The stained cells were examined using a fluorescence microscope. To confirm the roles of IL-6, PGE2, STAT3 and MMP9 in tumor invasion, 30 μg/ml anti-mouse or human IL-6 neutralizing mAbs, 30 μg/ml anti-mouse PGE2 neutralizing mAbs, 2 μM STAT3 inhibitor or 600 nm MMP9 inhibitor was added to the culture medium from corresponding exosome-stimulated BMDCs in 24-well Transwell plates for 24 h at 37°C. To confirm the roles of STAT3 and MMP9 in the invasion of B16-F10 cells, STAT3 and MMP9 were knocked down by corresponding siRNA before exosome stimulation. In some experiments, BMDCs of IL6−/−mice were used. To assess the invasive ability of DCs from mice subcutaneously inoculated with B16-F10 cells for 3 weeks, DCs were isolated from splenocytes with CD11c microbeads, followed by culture for 6 h in vitro. Then, the culture supernatant was collected, and B16-F10 cells were cultured in this supernatant for 24 h.
Gelatin zymography assay
B16-F10 cells were cultured in supernatant from B16-F10-EXO-stimulated BMDCs for 24 h, washed twice with PBS, and incubated in serum-free DMEM. After 24 h, conditioned medium was collected and concentrated to 35 μl with a 50K centrifugal filter (Millipore) at 4,000 × g for 25 min. Gels (SDS-PAGE, 8%) were co-polymerized with 1 mg/ml of gelatin. Twenty μl of concentrated B16-F10 supernatant was mixed with 5 μl of loading buffer for 15 min at room temperature (RT) and then loaded onto the gel. After electrophoresis, gels were washed in renaturing buffer (2.5% Triton X-100 in 50mM Tris-HCl, PH7.5) for 1 h at RT with gentle agitation. The zymograms were incubated at 37°C for 42 h in developing buffer (5mM CaCl2, 3mM NaN3 in 50mM Tris-HCl, PH7.5). Gels were then stained in 0.5% (w/v) Coomassie brilliant blue R-250 for 60 min and destained in destaining solution (30% methanol and 10% acetic acid). Then, the gels were photographed.
Luciferase assay
The sequence of the mouse MMP9 gene promoter from nucleotides −1,992 to −1,611 was amplified from B16-F10 genomic DNA and subcloned into a pGL3 luciferase promoter vector from Promega. NIH-3T3 cells were transfected with MMP9-luc, along with STAT3 plasmids with or without 10 ng/ml of IL-6 stimulation using JetPEI® Transfection Reagent, following the manufacturer's instructions. After 24 h, luciferase activity in cell lysates was detected by a Dual-luciferase Reporter Assay System (Promega) and normalized according to Renillaluciferase activity of cotransfected pRL-cytomegalovirus (CMV). Empty pCR-CMV vector was used to adjust the total amount of vector DNA for transfection.
ChIP assay
B16-F10 cells were stimulated with or without 10 ng/ml of IL-6 for 3 h before crosslinking protein-DNA complexes with 1% formaldehyde for 10 min at RT. ChIP was performed using a ChIP Assay Kit (Millipore), as per the manufacturer's instructions, with the following modifications. DNA was sheared with an ultrasound unit at a 30% amplitude energy setting and 30 second on/off pulses. The cycle was repeated for 15 min, resulting in a total sonication time of 15 min to obtain chromatin fragments of 200–500 base pairs. The lysates were incubated with 10 μl of anti-STAT3 Abs overnight. A real-time PCR reaction was then performed on the immunoprecipitated DNA fragments with the following mouse MMP9 primers, F: 5′-GACTCTGAGACAGGGTTACCA-3′ and R: 5′- CACACATCCATGACTGCCAAG-3′. Enrichment of STAT3 at the MMP9 promoter was expressed as a percentage of input DNA.
Confocal microscopy
BMDCs were pretreated with cytochalasin D for 30 min and stimulated with 2.5 μg/ml of CFSE-labeled B16-F10-EXO for 6 h. The cells were then fixed with 4% paraformaldehyde, permeabilized with 0.1% Triton-X-100 for 5 min and blocked in 5% BSA with 0.1% Tween-20. The cells were incubated at 4°C overnight with Abs against CD11c. Subsequently, all cells were incubated with secondary Abs at RT for 1 h. The cells were counterstained with DAPI to label DNA. To determine the binding of TEXs and DCs in vivo, mice were intravenously injected with 100 μl of PBS or 10 μg/100 μl of PKH26 labeled B16-F10-EXO and killed 24 h later. The spleens were detached and coated with embedding medium. They were sectioned into 8-μm-thick slices and applied on glass slides. After fixed with 100% methanol for 5 min and incubated in 3% BSA in PBS for 1 h to block non-specific protein-protein interactions, the slices were incubated at 4°C overnight with Abs against CD11c. Then the slices were incubated with secondary Abs at RT for 1 h followed by nuclei staining with DAPI. The stained cells or sections were viewed under an Olympus FluoView FV1000 confocal microscope and imaged using an Olympus FluoView version 1.4a viewer (Olympus Corp).
Lung invasion assay of tumor cells in vivo
A total of 5 × 10⁵ B16-F10, B16-F10/OVA or 4T1 tumor cells, with different treatments, were injected into 8-week-old WT mice or IL6−/− mice via the tail vein. Fifteen days after injection, mice were killed, and the lungs were detached. After the numbers of lung tumor nodules were counted, the lungs were excised, photographed and fixed in 10% formaldehyde for further hematoxylin and eosin staining. To detect OVA257–264 peptide specific CD8+ T cells in the lungs of mice injected with B16-F10/OVA cells, lung tissues were collected, cut into small pieces, and incubated in dissociation solution with 2 mg/ml collagenase type I (Sigma), 2 mg/ml collagenase type IV (Sigma), and 1 mg/ml DNase (Sigma). The solution was pipetting every 10 min during the incubation and suspension was dispersed through a 70-μm cell strainer. Then the single-cell suspensions from lungs were stained with Tetramer assay according to the manufacturer's instructions.
Establishment of HSC70-, HSP72- and HSP105-overexpressing B16-F10 cell lines
B16-F10 cells transfected with pcDNA3.1-Flag-HSC70, pcDNA3.1-Flag-HSP72 or pcDNA3.1-Flag-HSP105 were cultured in DMEM medium supplemented with 10% FBS in the presence of 500 µg/ml G418 for 7 d. Then, G418 resistant B16-F10 cell clones were selected by limiting dilutions and overexpression of HSC70, HSP72 or HSP105 were confirmed by Western blot.
Pull down assay
The fusion proteins of Flag-HSP105 or Flag-EGFP were expressed in HEK293T cells and purified according to standard protocols.Citation46 For the Flag pull down assay, approximately 3 µg of Flag-HSP105 or Flag-EGFP fusion proteins bound to M2 beads were mixed with His-TLR2 or His-TLR4 and incubated at 4°C with gentle mixing. After an overnight incubation, the beads were washed 3 times with a cell lysis buffer, separated with an SDS sample buffer and analyzed with a Western blot.
Statistical analysis
Data are expressed as the mean ± SEM. Comparisons between 2 groups were performed using 2-tailed Student's t-test, and comparisons between multiple groups were performed by one-way ANOVA and Tukey-Kramer multiple test, using GraphPad Prism 5. Statistical significance was determined at p < 0.05.
Competing financial interests
The authors declare no competing financial interests.
Author contributions
Y.S., D.G., L.W., W.S. and M.Z. performed experiments. Y.Y. and P.W. provided the human samples. J.W. and Z.C. designed and supervised the research. Y.S. and Z.C. wrote the paper.
2017ONCOIMM0332R-s02.docx
Download MS Word (1.9 MB)Acknowledgments
This work was supported by grants from the National Key Basic Research Program of China (2015CB943301), the Natural Science Foundation of Zhejiang Province (LY13H100001), and the National Natural Science Foundation of China (31470874, 31370902, 31400749 and 81470212).
References
- Gilboa E. DC-based cancer vaccines. J Clin Invest. 2007;117:1195-203. doi:10.1172/JCI31205. PMID:17476349
- Hargadon KM. The extent to which melanoma alters tissue-resident dendritic cell function correlates with tumorigenicity. Oncoimmunology. 2016;5:e1069462. doi:10.1080/2162402X.2015.1069462. PMID:26942090
- Tesone AJ, Rutkowski MR, Brencicova E, Svoronos N, Perales-Puchalt A, Stephen TL, Allegrezza MJ, Payne KK, Nguyen JM, Wickramasinghe J, et al. Satb1 Overexpression Drives Tumor-Promoting Activities in Cancer-Associated Dendritic Cells. Cell Rep. 2016;14:1774-86. doi:10.1016/j.celrep.2016.01.056. PMID:26876172
- Iwasaki A, Medzhitov R. Toll-like receptor control of the adaptive immune responses. Nat Immunol. 2004;5:987-95. doi:10.1038/ni1112. PMID:15454922
- Tang CH, Chen CF, Chen WM, Fong YC. IL-6 increases MMP-13 expression and motility in human chondrosarcoma cells. J Biol Chem. 2011;286:11056-66. doi:10.1074/jbc.M110.204081. PMID:21278254
- Dohadwala M, Luo J, Zhu L, Lin Y, Dougherty GJ, Sharma S, Huang M, Pold M, Batra RK, Dubinett SM. Non-small cell lung cancer cyclooxygenase-2-dependent invasion is mediated by CD44. J Biol Chem. 2001;276:20809-12. doi:10.1074/jbc.C100140200. PMID:11320076
- Sheng KC, Pietersz GA, Wright MD, Apostolopoulos V. Dendritic cells: activation and maturation–applications for cancer immunotherapy. Curr Med Chem. 2005;12:1783-800. doi:10.2174/0929867054367248. PMID:16029147
- Verhasselt V, Buelens C, Willems F, De Groote D, Haeffner-Cavaillon N, Goldman M. Bacterial lipopolysaccharide stimulates the production of cytokines and the expression of costimulatory molecules by human peripheral blood dendritic cells: evidence for a soluble CD14-dependent pathway. J Immunol. 1997;158:2919-25. PMID:9058830
- Monrad SU, Kojima F, Kapoor M, Kuan EL, Sarkar S, Randolph GJ, Crofford LJ. Genetic deletion of mPGES-1 abolishes PGE2 production in murine dendritic cells and alters the cytokine profile, but does not affect maturation or migration. Prostaglandins Leukot Essent Fatty Acids.. 2011;84:113-21. doi:10.1016/j.plefa.2010.10.003. PMID:21190819
- Tkach M, Thery C. Communication by Extracellular Vesicles: Where We Are and Where We Need to Go. Cell. 2016;164:1226-32. doi:10.1016/j.cell.2016.01.043. PMID:26967288
- Liu Y, Gu Y, Cao X. The exosomes in tumor immunity. Oncoimmunology. 2015;4:e1027472. doi:10.1080/2162402X.2015.1027472. PMID:26405598
- Wolfers J, Lozier A, Raposo G, Regnault A, Thery C, Masurier C, Flament C, Pouzieux S, Faure F, Tursz T, et al. Tumor-derived exosomes are a source of shared tumor rejection antigens for CTL cross-priming. Nat Med. 2001;7:297-303. doi:10.1038/85438. PMID:11231627
- Dai S, Wan T, Wang B, Zhou X, Xiu F, Chen T, Wu Y, Cao X. More efficient induction of HLA-A*0201-restricted and carcinoembryonic antigen (CEA)-specific CTL response by immunization with exosomes prepared from heat-stressed CEA-positive tumor cells. Clin Cancer Res. 2005;11:7554-63. doi:10.1158/1078-0432.CCR-05-0810. PMID:16243831
- Xiang X, Poliakov A, Liu C, Liu Y, Deng ZB, Wang J, Cheng Z, Shah SV, Wang GJ, Zhang L, et al. Induction of myeloid-derived suppressor cells by tumor exosomes. Int J Cancer. 2009;124:2621-33. doi:10.1002/ijc.24249. PMID:19235923
- Lewis AM, Varghese S, Xu H, Alexander HR. Interleukin-1 and cancer progression: the emerging role of interleukin-1 receptor antagonist as a novel therapeutic agent in cancer treatment. J Transl Med. 2006;4:48. doi:10.1186/1479-5876-4-48. PMID:17096856
- Hussain SP, Harris CC. Inflammation and cancer: an ancient link with novel potentials. Int J Cancer. 2007;121:2373-80. doi:10.1002/ijc.23173. PMID:17893866
- Liao Q, Zeng Z, Guo X, Li X, Wei F, Zhang W, Li X, Chen P, Liang F, Xiang B, et al. LPLUNC1 suppresses IL-6-induced nasopharyngeal carcinoma cell proliferation via inhibiting the Stat3 activation. Oncogene. 2014; 33, 2098–109. doi:10.1038/onc.2013.161. PMID:23708661
- Sun Q, Liu Q, Zheng Y, Cao X. Rapamycin suppresses TLR4-triggered IL-6 and PGE(2) production of colon cancer cells by inhibiting TLR4 expression and NF-kappaB activation. Mol Immunol. 2008;45:2929-36. doi:10.1016/j.molimm.2008.01.025. PMID:18343502
- Egeblad M, Werb Z. New functions for the matrix metalloproteinases in cancer progression. Nat Rev Cancer. 2002;2:161-74. doi:10.1038/nrc745. PMID:11990853
- Gu FM, Li QL, Gao Q, Jiang JH, Zhu K, Huang XY, Pan JF, Yan J, Hu JH, Wang Z, et al. IL-17 induces AKT-dependent IL-6/JAK2/STAT3 activation and tumor progression in hepatocellular carcinoma. Mol Cancer. 2011;10:150. doi:10.1186/1476-4598-10-150. PMID:22171994
- Liu Q, Li G, Li R, Shen J, He Q, Deng L, Zhang C, Zhang J. IL-6 promotion of glioblastoma cell invasion and angiogenesis in U251 and T98G cell lines. J Neurooncol. 2010;100:165-76. doi:10.1007/s11060-010-0158-0. PMID:20361349
- Hou CH, Hsiao YC, Fong YC, Tang CH. Bone morphogenetic protein-2 enhances the motility of chondrosarcoma cells via activation of matrix metalloproteinase-13. Bone. 2009;44:233-42. doi:10.1016/j.bone.2008.09.021. PMID:19038372
- Akira S. IL-6-regulated transcription factors. Int J Biochem Cell Biol. 1997;29:1401-18. doi:10.1016/S1357-2725(97)00063-0. PMID:9570135
- Aaronson DS, Horvath CM. A road map for those who don't know JAK-STAT. Science. 2002;296:1653-5. doi:10.1126/science.1071545. PMID:12040185
- Takeda K, Kaisho T, Akira S. Toll-like receptors. Annu Rev Immunol. 2003;21:335-76. doi:10.1146/annurev.immunol.21.120601.141126. PMID:12524386
- Vabulas RM, Wagner H, Schild H. Heat shock proteins as ligands of toll-like receptors. Curr Top Microbiol. 2002;270:169-84. doi:10.1007/978-3-642-59430-4_11. PMID:12467251
- Chen TY, Guo J, Yang MJ, Zhu XH, Cao XT. Chemokine-Containing Exosomes Are Released from Heat-Stressed Tumor Cells via Lipid Raft-Dependent Pathway and Act as Efficient Tumor Vaccine. J Immunol. 2011;186:2219-28. doi:10.4049/jimmunol.1002991. PMID:21242526
- Chalmin F, Ladoire S, Mignot G, Vincent J, Bruchard M, Remy-Martin JP, Boireau W, Rouleau A, Simon B, Lanneau D, et al. Membrane-associated Hsp72 from tumor-derived exosomes mediates STAT3-dependent immunosuppressive function of mouse and human myeloid-derived suppressor cells. J Clin Invest. 2010;120:457-71. doi:10.1172/JCI40483. PMID:20093776
- Galloway E, Shin T, Huber N, Eismann T, Kuboki S, Schuster R, Blanchard J, Wong HR, Lentsch AB. Activation of hepatocytes by extracellular heat shock protein 72. Am J Physiol Cell Physiol. 2008;295:C514−20. doi:10.1152/ajpcell.00032.2008. PMID:18508912
- Yamagishi N, Fujii H, Saito Y, Hatayama T. Hsp105beta upregulates hsp70 gene expression through signal transducer and activator of transcription-3. FEBS J. 2009;276:5870-80. doi:10.1111/j.1742-4658.2009.07311.x. PMID:19754877
- Ridgway D. The first 1000 dendritic cell vaccinees. Cancer Invest. 2003;21:873-86. doi:10.1081/CNV-120025091. PMID:14735692
- Palucka K, Banchereau J. Cancer immunotherapy via dendritic cells. Nat Rev Cancer. 2012;12:265-77. doi:10.1038/nrc3258. PMID:22437871
- Melo SA, Luecke LB, Kahlert C, Fernandez AF, Gammon ST, Kaye J, LeBleu VS, Mittendorf EA, Weitz J, Rahbari N, et al. Glypican-1 identifies cancer exosomes and detects early pancreatic cancer. Nature. 2015;523:177-82. doi:10.1038/nature14581. PMID:26106858
- Wolfers J, Lozier A, Raposo G, Regnault A, Thery C, Masurier C, Flament C, Pouzieux S, Faure F, Tursz T, et al. Tumor-derived exosomes are a source of shared tumor rejection antigens for CTL cross-priming. Nat Med. 2001;7:297-303. doi:10.1038/85438. PMID:11231627
- Mignot G, Roux S, Thery C, Segura E, Zitvogel L. Prospects for exosomes in immunotherapy of cancer. J Cell Mol Med. 2006;10:376-88. doi:10.1111/j.1582-4934.2006.tb00406.x. PMID:16796806
- Rao Q, Zuo B, Lu Z, Gao X, You A, Wu C, Du Z, Yin H. Tumor-derived exosomes elicit tumor suppression in murine hepatocellular carcinoma models and human in vitro. Hepatology. 2016; 64, 456–72. doi:10.1002/hep.28549. PMID:26990897
- Koh E, Lee EJ, Nam GH, Hong Y, Cho E, Yang Y, Kim IS. Exosome-SIRPalpha, a CD47 blockade increases cancer cell phagocytosis. Biomaterials. 2017;121:121-9. doi:10.1016/j.biomaterials.2017.01.004. PMID:28086180
- Whiteside TL. Exosomes and tumor-mediated immune suppression. J Clin Invest. 2016;126:1216-23. doi:10.1172/JCI81136. PMID:26927673
- Costa-Silva B, Aiello NM, Ocean AJ, Singh S, Zhang HY, Thakur BK, Becker A, Hoshino A, Mark MT, Molina H, et al. Pancreatic cancer exosomes initiate pre-metastatic niche formation in the liver. Nat Cell Biol. 2015;17:816-26. doi:10.1038/ncb3169. PMID:25985394
- Liu CR, Yu SH, Zinn K, Wang JH, Zhang LM, Jia YJ, Kappes JC, Barnes S, Kimberly RP, Grizzle WE, et al. Murine mammary carcinoma exosomes promote tumor growth by suppression of NK cell function. J Immunol. 2006;176:1375-85. doi:10.4049/jimmunol.176.3.1375. PMID:16424164
- Clayton A, Mitchell JP, Court J, Linnane S, Mason MD, Tabi Z. Human tumor-derived exosomes down-modulate NKG2D expression. J Immunol. 2008;180:7249-58. doi:10.4049/jimmunol.180.11.7249. PMID:18490724
- Wang YZ, Yi J, Chen XG, Zhang Y, Xu M, Yang ZX. The regulation of cancer cell migration by lung cancer cell-derived exosomes through TGF-beta and IL-10. Oncol Lett. 2016;11:1527-30. doi:10.3892/ol.2015.4044. PMID:26893774
- Clayton A, Mitchell JP, Court J, Mason MD, Tabi Z. Human tumor-derived exosomes selectively impair lymphocyte responses to interleukin-2. Cancer Res. 2007;67:7458-66. doi:10.1158/0008-5472.CAN-06-3456. PMID:17671216
- Zhang MH, Tang H, Guo ZH, An HZ, Zhu XJ, Song WG, Guo J, Huang X, Chen T, Wang J, et al. Splenic stroma drives mature dendritic cells to differentiate into regulatory dendritic cells. Nat Immunol. 2004;5:1124-33. doi:10.1038/ni1130. PMID:15475957
- Cai Z, Zhang W, Yang F, Yu L, Yu Z, Pan J, Wang L, Cao X, Wang J. Immunosuppressive exosomes from TGF-beta1 gene-modified ?dendritic cells attenuate Th17-mediated inflammatory autoimmune disease by inducing regulatory T cells. Cell Res. 2012;22:607-10. doi:10.1038/cr.2011.196. PMID:22157651
- Baillat D, Hakimi MA, Naar AM, Shilatifard A, Cooch N, Shiekhattar R. Integrator, a multiprotein mediator of small nuclear RNA processing, associates with the C-terminal repeat of RNA polymerase II. Cell. 2005;123:265-76. doi:10.1016/j.cell.2005.08.019. PMID:16239144