
ABSTRACT
Background: Tumor PD-L1 levels have predictive value in PD-1/PD-L1 checkpoint blockade therapies, yet biopsies can only provide baseline information. Whether PD-L1 expression on circulating tumor cells (CTCs) could serve as an alternative biomarker is of great interest.
Design: We established an immunofluorescence assay for semi-quantitative assessment of the PD-L1 expression levels on CTCs with four categories (PD-L1negative, PD-L1low, PD-L1medium and PD-L1high). 35 patients with different advanced gastrointestinal tumors were enrolled in a phase 1 trial of a PD-1 inhibitor, IBI308. The CTC numeration and the PD-L1 expression levels were analyzed.
Results: Prior the treatment of IBI308, 97% (34/35) patients had CTCs, ranging from1 to 70 (median 7). 74% (26/35) had PD-L1positive CTCs, and 60% (21/35) had at least one PD-L1high CTCs. The disease control (DC) rate in PD-L1high patients (48%) is much higher than the others (14%). The group with at least 20% abundance of PD-L1high CTCs had even higher DC rate of 64% (9/14), with only 14% DC rate for the rest (3/21). We also observed that the count changes of total CTC, PD-L1postive CTC and PD-L1high CTC correlate quite well with disease outcome (P<0.001, P = 0.002 and 0.007, respectively). In addition, the abundance of PD-L1high CTCs at baseline had predicative significance for progression free survival (PFS).
Conclusions: We revealed that the abundance of PD-L1high CTCs at baseline might serve as a predictor to screen patients for PD-1/PD-L1 blockade therapies and measuring the dynamic changes of CTC could indicate the therapeutic response at early time.
Introduction
PD-1/PD-L1 checkpoint blockade immunotherapy is revolutionizing the therapeutic strategy of malignancies by restoring the immune system.Citation1 Since US Food and Drug Administration (FDA) approved Pembrolizumab and Nivolumab for advanced melanoma in 2014, there has been a flourishing surge in the development and availability of PD1/PD-L1 checkpoint inhibitors for multiple cancers types. For now, 5 available PD-1/PD-L1 inhibitors (Pembrolizumab, Nivolumab, Atezolizumab, Durvalumab, and Avelumab) have been approved by FDA for the treatment of RCC, NSCLC, metastatic melanoma, urothelial carcinoma, SCCHN and/or Hodgkin Lymphoma.Citation2-Citation7 In China, there are five domestic PD-1/PD-L1 inhibitors under phase 1 trials by now (Table S1). Despite the significant survival benefit obtained during these checkpoint blockade therapies, only a small subset of patients showed responses. Given the special mechanisms on effector immune cells and the late but durable response induced by immunotherapy, the conventionally evaluated criteria of Response Evaluation Criteria in Solid Tumors (RECIST) is not very accurate for the assessment of responses to PD-1/PD-L1 inhibitors.Citation6 Therefore, it is challenging but very important to distinguish the populations that most likely benefit from and to tell whether they truly response to these immune checkpoint blockade therapies at early stage of the treatment.
Currently, PD-L1 is the best studied and plausible immune biomarker for PD-1/PD-L1 checkpoint blockade therapies. FDA has approved four immunohistochemistry (IHC)-based assays as companion diagnostics for risk/benefit assessment of PD-1/PD-L1 inhibitors.Citation8 However, it is still controversial for the predicative value of PD-L1 IHC as some patients with PD-L1 negative tumors also benefits from anti-PD-1 therapy in metastatic melanoma, squamous-NSCLC, and RCC or no significant correlation between response and PD-L1 status was observed in some studies.Citation9,Citation10 Moreover, the heterogeneous expressions between primary and metastatic tumors and the dynamic changes at different points further limit the feasibility of PD-L1 IHC as biopsy at one site could not represent the metastatic signatures.Citation11
As metastasis-driven precursors, circulating tumor cells (CTCs) carry over the characteristics of the primary tumor cells or probably also metastatic cells, and provide important complementary information on therapeutic responses.Citation12-Citation15 A previous study has found that PD-L1 had similar expressions on CTCs and primary tumors in oral squamous cell carcinoma (OSCC) patients, which implying the possibility of following treatment using CTCs.Citation16 Wang et al have proposed that PD-L1 positive CTCs are easier to escape from the immune system, which might bring new insight of immunotherapy.Citation17 Moreover, the frequently expression of PD-L1 on CTCs and their potential role in monitor and evaluation of immune checkpoint blockade therapy have been further supported by lots of studies.Citation18-Citation22
To investigate the PD-L1 expression distribution, we established a scoring system for PD-L1 evaluation in CTCs isolated with Pep@MNPs, which is a highly sensitive method based on EpCAM (+) enrichment,Citation23 and further explored the feasibility of PD-L1 quantitation on CTCs in predicting and monitoring PD-1 blockade therapies by applying this system to a phase I trial of PD-1 inhibitor, IBI308. It has been proved that Pep@MNPs assay could be utilized to isolated CTCs from MBC patients and serve as a prognostic biomarker.Citation24 In the present study, we successfully detected CTCs with different PD-L1 levels in the same patient and demonstrated that Pep@MNPs could isolate CTCs from patients with varied gastrointestinal tumors. Moreover, statistical results suggest the notion that PD-L1 assessment on CTCs might be e a potential predicator to identify patients who most likely benefit from PD-1/PD-L1 inhibition and the dynamic changes of PD-L1 expression on CTCs could help evaluating the therapeutic response.
Results
PD-L1 antibody assessment
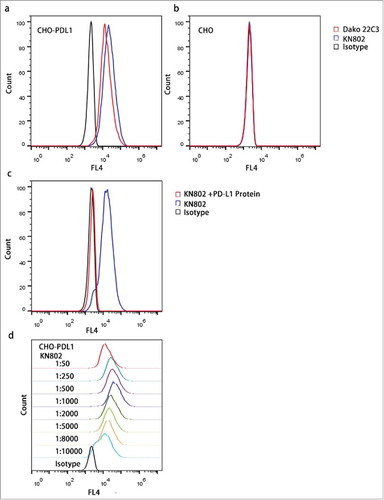
It has been proved that PD-L1 is highly expressed in placenta.Citation25-Citation28 Therefore, to validate the specificity of the PD-L1 antibody KN802, we tested KN802 on placenta tissue using another anti-PD-L1 monoclonal antibody Dako Clone 22C3 as a positive control. Both KN802 and 22C3 showed positive signals on pathological sections of placenta (Fig. S1). Next, we tested KN802, 22C3 and the species-matched isotype controls on PD-L1 overexpressed CHO-PDL1 and PD-L1 negative CHO cell lines. As shown by flow cytometry, both PD-L1 mAbs presented strong signals on CHO-PDL1 cells and simultaneous no significant signal on CHO cells compared with IgG1 controls (). Furthermore, binding of KN802 to CHO-PDL1 cells was dramatically blocked by co-incubating with PD-L1 proteins (). The sensitivity of KN802 was further evaluated with concentration gradients and the optimal antibody condition (1:1000) was chosen given the highest mean fluorescence intensity (MFI) (). These results indicated that anti-PD-L1 mAb KN802 possesses high specificity and sensitivity.
Figure 1. Specificity and sensitivity assessment of the PD-L1 mAb KN802. (a, b) KN802, the available PD-L1-specific antibody Dako 22C3 and species-matched isotype negative control were tested in PD-L1 overexpressed CHO-PDL1 and negative CHO cell lines with FCM. (c) Active binding sites of KN802 were blocked by co-incubation with PD-L1 recombinant protein. In parallel, unblocked KN802 and corresponding isotype were tested as positive and negative control, respectively. (d) KN802 was titrated to determine the sensitivity in a series concentration. The highest signal was observed at the diluted concentration of 1: 1000, which was chosen as the optimal working concentration.
Establishment of PD-L1 quantitative analysis
We evaluated PD-L1 expressions in a series of cell lines with FCM (Fig. S2). And for the establishment of quantitative analysis, we specifically selected three lung cancer-derived cell lines with different levels of PD-L1 expression: A549, NCI-H1650 and NCI-H1975. The graded PD-L1 expression profile was: NCI-H1975> NCI-H1650 > A549 (). The confocal results further demonstrated that PD-L1 expression varied in membrane of these cell lines and the fluorescence intensity distribution consisted with FCS results (Fig. S3).
Figure 2. Development of PD-L1 quantitative assay. (a) PD-L1 levels in three lung-cancer derived cell lines were determined using FCM, with low for A549, medium for NCI-H1650 and strong for NCI-H1975. (b) Construction of the PD-L1 quantitative system. Three cell lines with different PD-L1 levels were spiked into blood samples from health donors and recovered by Pep@MNPs. The staining signals were observed under fluorescence microscope. (c) MFI of the recovered cells. The MFI of A549, NCI-H1650, NCI-H1975 is 55.24±33.36, 113.07±48 and 160.87±44.86, respectively.
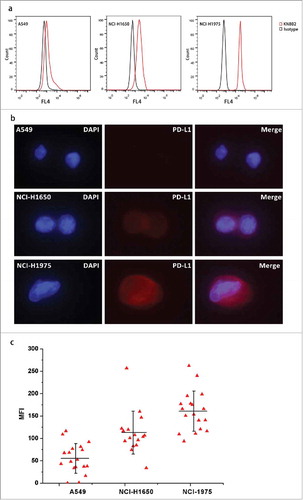
Next, A549, NCI-H1650 and NCI-H1975 cells were spiked into 2ml blood from healthy donors and enumerated with Pep@MNPs. PD-L1 expressions of recovered tumor cells were detected under fluorescence microscope (). According to the MFI of recovered cells, we defined a PD-L1 quantitative system: negative (-, MFI lower than 50, Score 0), low expression (+, 50≤MFI<100, Score 1), medium expression (++, 100≤MFI<150, Score 2) and strong expression (+++, MFI≥150, Score 3) ().
CTC enumeration
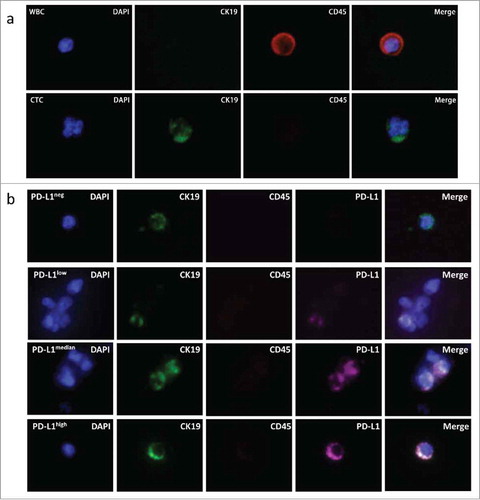
Blood samples were obtained from 35 patients undergoing IBI308 PD-1 monoclonal antibody treatment. CTCs were enumerated with the prior established Pep@MNPs isolated system and characterized as CK19+ DAPI+ CD45- (). PD-L1 expressions were quantified and analyzed using our established fluorescence quantitative system. As shown in , we could detect CTCs with different PD-L1 expressions in the same patient.
Figure 3. Assessment of PD-L1 expression on CTCs. (a) Represent CTC enriched with Pep@MNPs. WBC: white blood cell, characterized by DAPI+ CK19- CD45+; CTC: circulating tumor cell, characterized by DAPI+ CK19+ CD45-. (b) Represent CTCs with different PD-L1 levels isolated from one patient. In order from top to bottom, it was PD-L1 negative (PD-L1neg), lowly expressed (PD-L1low), medially expressed (PD-L1medium) and strongly expressed (PD-L1high) CTC, respectively.
Ratio distribution of PD-L1 positive CTCs prior IBI308 treatment and drug response
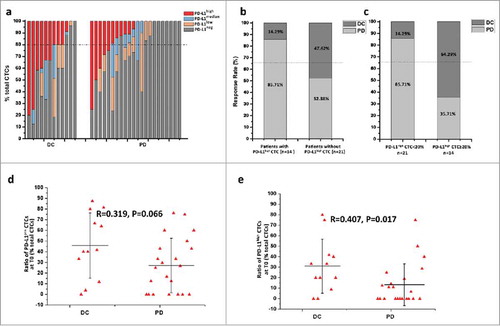
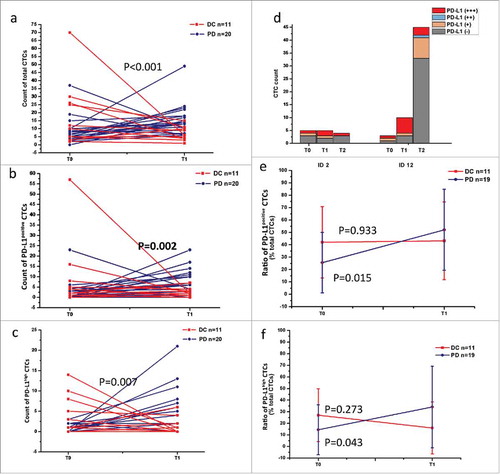
35 patients were enrolled in the study and the detailed cancer types were listed in the . 5 patients were unavailable for the second blood draw but had clinical radiographic-evaluated results. Among the 35 patients, 23 experienced a progressed disease (PD), 12had a disease control (DC) with stable disease (SD) in 9 patients and partial response (PR) in the other 3 patients (Table). Before the treatment of PD-1 inhibitor IBI308, CTCs were detected in 34 of 35 patients (Fig. S4). PD-L1 positive CTCs were found in 74% patients (26/35). 92% DC patients (11/12) and 65% PD patients (15/23) had PD-L1positive CTCs at baseline (). We specially examined the distribution of PD-L1high CTCs, and found the presence in 21 patients (). Among patients without PD-L1high CTCs, only 14% patients (2/14) showed response to IBI308, which occurred in 48% patients with PD-L1high CTCs (10/21) (). Specifically, we observed the ratio distribution of PD-L1high CTCs and defined a cutoff value of 20%. The objective response rate (ORR) above and below this value was 64% and 14%, respectively. To determine whether PD-L1positive CTC levels, especially PD-L1high CTCs, could influence the patients’ response to PD-1 inhibitor, we analyzed the correlation between baseline percentage of PD-L1 positive CTCs/PD-L1high CTCs and disease status. Among the 34 patients with CTCs at baseline, the average baseline ratios of PD-L1 positive CTCs in DC and PD group were 45.85 ± 30.45% (0∼87.5%) and 27.12 ± 25.50% (0∼76.19%), respectively (); And no significant correlation was observed between baseline proportion of PD-L1 positive CTCs and drug response (R = 0.319, P = 0.066). The average baseline ratio of PD-L1high CTCs in DC group was much higher than that in PD group (31.01 ± 25.80% versus 13.33 ± 19.85%). A higher ratio of PD-L1high CTCs at baseline is positively correlated to a disease benefit (R = 0.407, P = 0.017) (), which implies that the distribution of PD-L1high CTCs might be utilized to predict the therapeutic response to PD-1 inhibitor.
Table 1. PD-L1 status in CTCs of patients before and after initiation of IBI308 therapy.
Figure 4. Correlation between baseline proportions of total PD-L1pos CTC/PD-L1high CTC counts and disease status.(a) PD-L1 distribution on CTCs from advanced cancer patients before initiation of IBI308 therapy. DC: disease control, refer to patients showed response (PR and SD); PD: progressive disease, refer to patients showed no response. Patients are ordered according to the percentage of PD-L1high CTCs. The dash dot line refers to the cutoff proportion of PD-L1high CTCs. (b) Response rate of patients with/without PD-L1high CTCs at baseline. (c) Response rate of patients above or below the cutoff value. (d) Percentage distribution of total PD-L1pos CTCs at baseline before IBI308 therapy. The ratio ranged from 0 to 87.5% in DC group, with an average value of 45.85±30.45%. And PD group showed a range from 0 to 76.19% and the average value was 27.12 ± 25.50%. No significant correlation was observed between baseline proportion of PD-L1 positive CTCs and drug response (R = 0.319, P = 0.066). (e) Ratio distribution of PD-L1high CTCs at baseline from patients before IBI308 therapy. The ratio ranged from 0 to 80% in DC group, with a mean value of 31.01 ± 25.80%. And PD group showed a range from 0 to 50% and the average value was 13.33 ± 19.85%. A higher ratio of PD-L1high CTCs at baseline is positively correlated to a better drug response (R = 0.407, P = 0.017).
Dynamic changes of PD-L1 expression on CTCs during IBI308 treatment
To evaluate the surveillance value of PD-L1 distribution on CTCs, we analyzed the changes in CTC counts and PD-L1 expressions on CTCs using this semi-quantitative method (Fig. S4). Among the 30 patients available for the second blood draw, a decrease of total CTCs was observed in 73% (8/11) DC patients and 11% (2/19) PD patients. In PD-L1 expression analysis, 55% DC patients (6/11) showed a decline of total PD-L1positive CTCs, while an increase occurred in 95% (18/19) PD patients (P = 0.002) (). As for PD-L1high CTC count, a reduction was observed in 64% DC patients (7/11), and 84% PD patients showed a raise or stayed unchanged (16/19) (P = 0.007) (). These results suggest that the reduction in total CTC, PD-L1posive CTC and PD-L1high CTC counts may reflect a benefit response to PD-1 inhibitor. 1 SD patient (ID 12) who showed an increase in total CTCs at T1 was available for the third blood draw 1 month later, when PD occurred. The total CTC count dramatically rose to 45, and PD-L1positive CTCs also had a minor rise to 12, while PD-L1high CTCs decreased to 3 from 6 compared to the second measurement (). Another PD patient (ID 2) who showed no significant changes in CTC count was proved as a pseudoprogression and began to response to IBI308 subsequently. A reduction was observed 7 months later (). These attractive observations might provide a little implication about the real time therapy-monitoring significance of PD-L1 assessment on CTCs, as PD-1/PD-L1 checkpoint inhibitors could specifically induce a slow but durable response. We further assessed the ratio changes of PD-L1positive CTCs/PD-L1high CTCs. As shown in , an augment was observed in PD group at T1 compared to T0 (from 25.60 ± 24.39% to 52.12 ± 32.76%, P = 0.015), and DC group also showed a negligible increase from 42.06 ± 28.82% to 43.20 ± 31.37% (P = 0.933). The average ratios of PD-L1high CTCs in two groups showed different drifts, with an increase from 14.44 ± 21.50% to 34.10 ± 35.15% in PD group and a decrease from 27.01 ± 22.82% to 16.01 ± 22.42% in DC group (P = 0.273 and 0.043, respectively) (). This might be explained by the simultaneous changes of both PD-L1 positive and negative CTCs. Therefore, unlike dynamic changes in PD-L1 positive CTC count that showed an obvious monitoring value, the surveillent significance of PD-L1 positive CTC ratio need further evaluation.
Figure 5. Dynamic changes in PD-L1 distribution on CTCs before and after treatment. (a) Changes of total CTC count in DC and PD patients. An increase (≥0) was observed in 27.27% (3/11) DC patients and 89.47% (17/19) PD patients. P<0.001. (b) Changes of total PD-L1positive CTC count in DC and PD patients. 54.55% DC patients (6/11) showed a decline of total PD-L1 positive CTCs, while an increase occurred in 18 of 19 PD patients. P = 0.002. (c) Changes of PD-L1high CTC count in DC and PD patients. A decline was observed in 63.64% DC patients (7/11) while an augment was found in 84.21% PD patients (16/19). P = 0.007. (d) Changes of CTC count in two specific cases. For a triple bar of one patient, it was CTCs enumerated at T0, T1 and T2 in order from left to right. (e) Ratio distribution of PD-L1positive CTCs at T0 (baseline) and T1 (after treatment). An obviously increase was observed both in PD group at T1 compared with T0 (from 25.60 ± 24.39% to 52.12 ± 32.76%, P = 0.015); and DC group showed no significant ratio change (from 42.06 ± 28.82% to 43.20 ± 31.37%, P = 0.933). (f) Ratio distribution of PD-L1high CTCs at T0 (baseline) and T1 (after treatment). Two separate drifts were observed between DC and PD groups. At T1, the average proportion of PD-L1high CTCs showed a dramatic augment in PD group (from 14.44 ± 21.50% to 34.10 ± 35.15%, P = 0.043) and a decline in DC group (from 27.01 ± 22.82% to 16.01 ± 22.42%, P = 0.273).
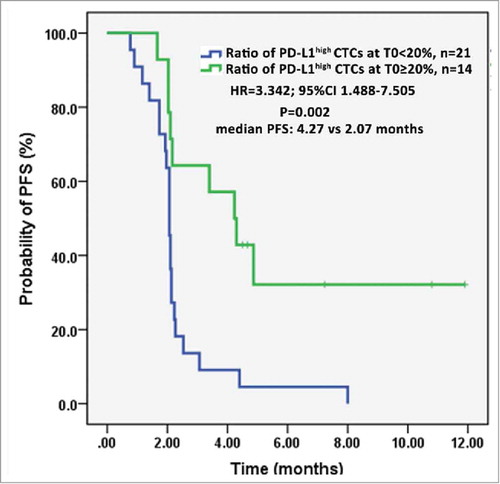
PD-L1high CTCs as a potential prognostic indicator of PFS
Emerging evidences have proved that patients with PD-L1 overexpressed tumors obtain improved clinical outcomes during PD-1/PD-L1 blockade therapy.Citation29,Citation30 To explore whether PD-L1high CTCs have any prognostic significance, we analyzed the PFS of patients based on the ratio of PD-L1high CTCs at T0 and number of PD-L1high CTCs at T1. As shown in , patients above the cutoff value at T0 had an obviously longer PFS compared with those below the value (HR = 3.342; 95%CI 1.488-7.505; median 4.27 vs 2.07 months, P = 0.002). And patients with PD-L1high CTCs <2 at T1 significantly trend to better PFS than patients with PD-L1high CTCs ≥2 (HR = 0.412; 95%CI 0.177-0.962; median 3.4 vs 2.1 months, P = 0.031) (Fig. S5a). However, no significant difference was observed between PFS of patients with ratio of PD-L1high CTCs ≥20% and patients with the ratio <20% (HR = 0.567; 95%CI 0.245-1.312; median 2.53 vs 2.1 months, P = 0.185) (Fig. S5b). This could be explained by the indiscriminately killing effect from T cells when PD-1/PD-L1 interaction was blocked.Citation31 These data suggest that both baseline proportion and post-therapeutic number of PD-L1high CTCs could serve as prognostic indicators.
Figure 6. Kaplan–Meier estimates of PFS of patients with abundance of PD-L1high CTCs ≥ or < 20% at T0.
Discussion
In the present study, we established a fluorescent quantitative system for semi-quantitative analysis of PD-L1 expressions. With this evaluating system, we successfully demonstrated variety of PD-L1 levels in CTCs from patients with varied advanced carcinomas. Furthermore, we provided evidence that evaluating PD-L1 expressions on CTCs might help choosing patients for PD-1/PD-L1 checkpoint blockade immunotherapy and monitoring the dynamic changes in the distribution might assist evaluating the therapeutic efficiency. To our best knowledge, this is the first exploration demonstrating that PD-L1 quantitation in CTCs correlated with response to PD-1 inhibited therapies, since Panabières et al found PD-L1 frequently expressed on CTCs and can be used in future clinical trials for stratification and monitoring of cancer patients undergoing immune checkpoint blockade.Citation20 Due to transient worsening and different unique response from RECIST criteria, it is quite challenging to assess benefit in patients receiving immunotherapy.Citation32 So far, PD-L1 and microsatellite instability (MSI) are two plausible biomarker help defining patients who are most likely to benefit from PD-1/PD-L1 blockade therapy, as many studies have proved that patients with PD-L1 positive tumors achieved better responses to immunotherapy than those with PD-L1 negative tumorsCitation33-Citation36 and MSI-H/MMR deficient cancers are more sensitive to PD-1/PD-L1 blockade therapy.Citation37 However, tumor heterogeneity, especially in metastatic patients, has challenged the assessment of PD-L1 expression and MSI status. And the MMR deficiency is present in only 15–20% of colon cancer and 20–30% of endometrial cancer, the prevalence in other advanced disease patients is much less.Citation38 As an alternative, the feasibility of PD-L1 expression assessment in CTCs has been previously described in several papers.Citation20-Citation22, Citation39 By monitoring the dynamic changes of PD-L1 expression in CTCs, we could obtain the first-hand knowledge and paramount information of anti-PD-1/PD-L1 therapy.
KN802 is a PD-L1 MAb that is screened recently and still commercially unavailable. Therefore we evaluated its specificity and sensitivity using PD-L1 overexpressed CHO-PDL1 cells and PD-L1 negative CHO cells, both of which have been used for the evaluation of PD-L1 MAb.Citation40 Distribution of fluorescent signals in CHO-PDL1 and CHO cells demonstrated that KN802 is a highly specific PD-L1 MAb. Moreover, to establish a protein expression quantitated system like IHC, we screened cell lines to explore PD-L1 variety. The dynamic ranges in expression levels further indicated a high sensitivity of KN802 assay. Given most of the cell lines having relative lower PD-L1 expression, we chose 3 lung-cancer derived ones with different PD-L1 levels (A549<NCI-H1650<NCI-H1975) as the foundation for our quantitative system. By spiking these cells into blood sample from health donors and recovering them, we simulated the environment of CTCs and established a quantitative system with thresholds might most appropriate for CTCs analysis. By using Pep@MNPs, we further investigated the clinical utility and feasibility of this PD-L1 quantitative system in patients with advanced cancers. Frequent and varied expressions of PD-L1 on CTCs were clearly observed in our assessment, which implicates that our PD-L1 quantitative system is plausible. The “PD-L1 immunoscore” defined in a previous report further supported the feasibility of our findings.Citation20
The clinical significances of PD-L1 expression in immune checkpoint blockade therapies have been approved in many trials and FDA has approved several PD-L1 IHC assays for companion diagnostics in anti PD-1/PD-L1 therapies. However, analysis of PD-L1 expression in solid tumors showed limited predicative values as separate expression patterns were observed in matched primary versus distant metastasis sites and a paradigm shift in oncology occurred during immunotherapy. CTC analysis is an alternative method with minimal invasion and assessment of PD-L1 dynamic changes in CTCs could help monitoring the oncologic shifts induced by PD-1/PD-L1 inhibitors. Many studies have pronounced the importance of PD-L1 assessment as a predictor to identify patients who most likely benefit from checkpoint blockade.Citation34,Citation36 And several clinical trials found that a much higher disease control rate was observed in patients with locally determined dMMR/MSI-H cancers.Citation41,Citation42 However, it also suggested that only a subgroup of metastatic MSI patients might benefit from checkpoint blockade therapies and MSS patients with tumors highly infiltrated with immune cells could also benefit from the therapy.Citation43 In the present study, we explored the predictive significance of quantifying PD-L1 expression on CTCs from patients treated with the PD-1 inhibitor IBI308 using the quantitative system. Among the 35 patients undergoing blockade therapy of IBI308, 34 had CTCs before the initiation of therapy and PD-L1 positive CTCs were found in most of the patients (26/35). To determine whether PD-L1 quantitation on CTCs could serve as a diagnostic approach for PD-1/PD-L1 blockade therapy, we performed correlation analysis between PD-L1 distribution on CTCs prior treatment and therapeutic response. No obvious association was found between PD-L1 positive CTCs and disease status. However, we did observe that patients with PD-L1high CTCs had a higher response than PD-L1high CTC-negative patients. Moreover, compared with PD patients, the average percentage of PD-L1high CTCs on total CTCs in DC patients was striking higher. Together, these observations suggest that, rather than PD-L1 positive CTCs, the presentation and the ratio distribution of PD-L1high CTCs might be a more appropriate biomarker to screen patients who most likely benefit from PD-1 inhibitor treatment and help predicting the relatively therapeutic response. Furthermore, by estimating the PFS, we demonstrated for the first time that the absence of PD-L1high CTCs at baseline correlates with a higher risk for progression during anti-PD-1 therapy. This further highlights the underlying predicative value of PD-L1 assement on CTCs to assist decisions of PD-1/PD-L1 blockade therapy.
Checkpoint inhibitors reactivate immune system to block therapy escape induced by PD-1/PD-L1 interaction.Citation44 The time required for the immune system restoring results in delayed but durable responses and inappropriate efficacy evaluation with traditional standard criteria.Citation45 Therefore, reliable biomarkers are in urgent need to evaluate immunotherapeutic responses. Due to the availability of resampling, the dynamic changes of PD-L1 positive CTCs might mirror a response status in real time. Nicolazzo et al. has proved that persistent presence of PD-L1 (+) CTCs at the evaluation-time point is associated to poor outcome in treatment of PD-1 inhibitor Nivolumab.Citation21 In our study, a decline of total CTC count was found in 72.73% (8/11) DC patients and 10.53% (2/9) PD patients, which is consistent with the prior findings that dynamic changes of total CTCs might be a real-time monitor for cancer therapies.Citation46,Citation47 In PD-L1 expression analysis, we did observe that total PD-L1pos CTCs, especially PD-L1high CTCs, reduced in most patients who obtained benefit, while increases occurred in most patients with a progressed disease. Thus, semi-quantitative analysis of PD-L1 on CTCs might provide real-time knowledge of therapeutic efficacy during PD-1/PD-L1 blockade therapy. However, the dynamic changes in average ratio of PD-L positive and PD-L1high CTCs showed no obvious significance, although different drifts occurred in DC and PD groups. This might be illuminated by the changes of both PD-L1 positive and negative CTCs numbers during the treatment. And this finding was further supported by a previous opinion that the fraction of PD-L1 positive CTCs depends on the number of detected CTCsCitation20 and the presence of PD-L1 does not confer a selective advantage when interactions between PD-L1 and PD-1 are blocked.Citation31
Although we indeed gain a profound perception into the predicted and surveillent significance of PD-L1 expression on CTCs, the biggest limitation is the variation of cancer types in the safety-evaluated trial of IBI308. We have 35 patients divided into 11 tumor types. Given the biological and clinicopathologic heterogeneities among different tumors and individuals, the prospective value of PD-L1 quantitation on CTCs needs to be further explored in a larger cohort with a unitary tumor type.
Except the variation of tumor types involved, there are several more limitations for this study, such as (i) the small populations, (ii) the inconformity in treatment cycles, (iii) lack of PD-L1 expression information in the primary tumors, (iv) short follow-up time as PD-1/PD-L1 blockade needs time to reactivate the immune system.Citation21,Citation44 Therefore, a multicenter prospective study involved multi-type of tumors is necessary to support the potential clinical feasibility of PD-L1 quantitation on CTCs.
Materials and methods
Reagents and cell lines
CD45-phycoerythrin (PE) (Catalog#ab134202), CK19-fluorescein isothiocyanate (FITC) (Catalog#ab87014) were purchased from Abcam, monoclonal anti-PD-L1 antibody KN802 was supplied by Beijing Kohnoor Science & Technology Company. Cell lines of breast cancer MDA-MB-231, MCF-7, MDA-MB-468; colorectal cancer HT-29, Caco2; cholangiocarcinoma HCCC9810, QBC939, RBE; lung cancer A549, NCI-H1650, NCI-H1975; glioma U87, U251; hepatocarcinoma HepG2 were stored in our lab. CHO-PDL1cells, PD-L1 negative CHO cells and PD-L1 recombinant protein were kindly from Professor Yongjun Dang in Fudan University. Placenta sample was provided by Affiliated Hospital Cancer Center, Academy of Military Medical Sciences.
Assessment of anti-PD-L1 antibody
Anti-PD-L1 antibody KN802 was conjugated with AlexaFluor 647 using a protein labeling kit (catalog A20173, Invitrogen) and Nanodrop was used to assess the labeling efficiency. To determine the best working concentration of KN802, PD-L1 overexpressed CHO-PDL1 cells were stained with KN802-AlexaFluor 647 in a series of concentrations (1:50, 1:250, 1:500, 1:1000, 1:2000, 1:5000, 1:8000 and 1:10000) and FCM was used to collect the information. In this assay, an AlexaFluor 647 labeled normal isotype (Catalog#115-605-003, Jackson ImmunoResearch Laboratories) works as a control. To further confirm the specificity of KN802, we use PD-L1 recombinant protein to block the active binding sites of KN802 by co-incubation for 30 min. Then the co-incubated product was used to stain CHO-PDL1 cells with untreated KN802 as control. For further specificity determination, unlabeled KN802 was analyzed in placenta sample, PD-L1 overexpressed CHO-PDL1 and PD-L1 negative CHO cells, with monoclonal mouse anti-human PD-L1 antibody 22C3 (Dako North America) served as a positive control (1:200).
Flow cytometry (FCM)
To choose cell lines for the establishment of immunoscoring system, we use FCM to test the distribution of PD-L1 in 15 cell lines stored in our lab. 10^6 cells were harvested and collected, following fixation in 4% paraformaldehyde for 15 min. After blocking for 30 min, cells were incubated with anti-PD-L1 antibody or a mouse isotype control (Catalog#MAB002, R&D Systems) for 1 h. Afterwards, cells were rinsed with PBS for twice and incubated with an AlexaFluor 647 labeled secondary antibody for 30 min, following wash with PBS for twice. BD flow cytometer (BD Accuri™ C6) was used to record the cells with at least 20,000 events and the data were analyzed using Flowjo software (Tree Star).
Immunocytochemistry
3 cell lines with different PD-L1 levels were seeded into a 24 well plate (Catalog#3524, Corning) or confocal dish (Catalog#P06-1.5 H-N, In Vitro Scientific) and cultured for 24 h. Then cells were fixed in 4% paraformaldehyde for 15 min and subsequently blocking with 5% BSA in PBST for 30 min, following incubated with KN802-AlexaFluor 647 for 1 h. After wash with PBS for 3 times, the staining results were obtained under OLYMPUS IX73 fluorescence microscope or Zeiss LSM-710 confocal microscope system.
CTC isolation and identification
CTCs were isolated and enumerated with the Pep@MNPs method as previously described.Citation24 Pep@MNPs was iron oxide magnetic nanoparticles (MNPs) linked with peptides targeted to EPCAM via biotin-avidin interaction. For each detection, 10ul Pep@MNPs was added into 2.0 ml peripheral blood, following incubation at 37℃ for 1h to make sure CTCs bind to Pep@MNPs. The Pep@MNPs captured CTCs were isolated under a magnetic field. After incubation with DAPI and multi antibodies, CTCs were identified as cells with the phenotype of CK19+/DAPI/CD45- under OLYMPUS IX73 fluorescence microscope.
Construction of Semi-quantitative system for PD-L1 on CTCs by spiking experiments
3 cell lines with different PD-L1 levels (low, medium and high) were chosen for the construction of PD-L1 evaluated system. 10^4 cells stained with DAPI were spiked into 2.0 ml blood obtained from healthy donors and recovered using Pep@MNPs. The mean fluorescent intensity (MFI) of PD-L1 on recovered cells was calculated using ImageJ software (Version of 1.8.0_112) to set the thresholds for semi-quantitation. At least 5 fields were analyzed for each sample. The PD-L1 levels were characterized as following, negative: MFI < MFI of low-PD-L1 cells; low: MFI of low-PD-L1 cells ≤MFI< MFI of medium-PD-L1 cells; medium: MFI of medium PD-L1 cells ≤MFI< MFI of high-PD-L1 cells; high: MFI> MFI of high-PD-L1 cells.
Blood sample collection
IBI308 (Innovent Biologics) is a PD-1 inhibitor under phase 1 clinical trial in China. 35 patients with advanced gastrointestinal tumors were enrolled in this prospective study from October 2016 to November 2017, which belongs to the efficacy and safety trial of IBI308 (NCT02937116). All patients are from Affiliated Hospital Cancer Center, Academy of Military Medical Sciences and have failed to standard therapies prior PD-1 inhibition. In this trial, the PD-1 inhibitor IBI308 was administrated through intravenous drip in different doses: 1 mg/kg, 3 mg/kg, 10 mg/kg or 200 mg. 10 types of gastrointestinal tumors were involved; including neuroendocrine tumors derived from 6 different sites, right adrenal neuroblastoma, hepatocellular carcinoma (HCC), colorectal carcinoma (CC), intrahepatic cholangiocarcinoma, pancreatic carcinoma, esophageal carcinoma, ampullary adenocarcinoma, small intestinal stromal tumor and esophageal small-cell carcinoma (). For CTC evaluation, 4.0 ml peripheral blood samples were collected and analyzed before PD-1 treatment as baseline (T0). And the second blood draws were collected at 9 weeks after the initiation of therapy (T1), when the drug response was evaluated. All methods used in this study were performed in accordance with approved Medical Ethics regulations from Affiliated Hospital Cancer Center, Academy of Military Medical Sciences.
i) Statistical analysis
The statistical package SPSS (version 20.0; IBM, New York, NY, USA) was applied for significance analysis. The correlation between increase status in total CTC/ PD-L1positive CTC/PD-L1high CTC count (≥0 or <0) and disease status was analyzed using a Pearson coefficient. Significance of the average changes in proportion of PD-L1positive CTCs/PD-L1high CTCs was determined by a paired Student's T-test. For predicative value assessment, a Spearman rank correlation coefficient was utilized to analyze the correlation between baseline proportion of total PD-L1positive CTC /PD-L1high CTCs and disease status. PFS distributions were estimated using the Kaplan–Meier test. A P value <0.05 was considered as significant.
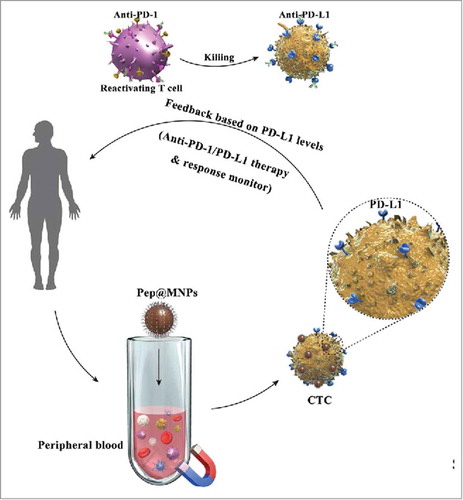
Scheme 1. Schematic illustration of PD-L1 positive CTCs as a biomarker in PD-1/PD-L1 blockade therapy.
Conflict of interest
Z.H. and Y.Y. are co-founders of Nanopep and hold stocks in the company. Y.Y. is on the board of directors and Z.H. is chairman. J.X., N.L., and D.L. are employees of Nanopep.
supplemental_materials.docx
Download MS Word (1.9 MB)Acknowledgments
This study was supported by the Key Research Program of the Chinese Academy of Sciences (No. KFZD-SW-210), Beijing Municipal Science and Technology Project (No.Z171100002017013), “Strategic Priority Research Program” of Chinese Academy of Sciences (XDA09040300), National Natural Science Foundation of China (No.21775031, 81500900 & 21503054), Beijing Talents Fund (No. 2015000021223ZK36) and Beijing Municipal Natural Science Foundation (No.L172035 & 2172056).
Additional information
Funding
References
- Zou W, Wolchok JD, Chen L. PD-L1 (B7-H1) and PD-1 pathway blockade for cancer therapy: Mechanisms, response biomarkers and combinations. Sci Translational Med. 2016;8:328rv4–rv4. doi:10.1126/scitranslmed.aad7118
- Chiavenna SM, Jaworski JP, Vendrell A. State of the art in anti-cancer mAbs. J Biomed Sci. 2017;24:15. doi:10.1186/s12929-016-0311-y. PMID:28219375.
- Hwang YY, Khong PL, Kwong YL. Low-dose nivolumab induced remission in refractory classical Hodgkin lymphoma. Ann Hematol. 2017;96:1219–20. doi:10.1007/s00277-017-3007-9. PMID:28434018.
- Weinstock C, Khozin S, Suzman D, Zhang L, Tang S, Wahby S, Goldberg KB, Kim G, Pazdur R. U.S. food and drug administration approval summary: Atezolizumab for metastatic non-small cell lung cancer. Clin Cancer Res. 2017;23(16):4534–4539. doi:10.1158/1078-0432.CCR-17-0540. PMID:28611199.
- Maraz A, Geczi L. [The role of immunotherapy in the modern treatment of urothelial carcinoma]. Magyar Onkologia. 2017;61:139–46. PMID:28585615.
- Beckermann KE, Johnson DB, Sosman JA. PD-1/PD-L1 blockade in renal cell cancer. Expert Rev Clin Immunol. 2017;13:77–84. doi:10.1080/1744666X.2016.1214575. PMID:27426025.
- Hahn AW, Gill DM, Agarwal N, Maughan BL. PD-1 checkpoint inhibition: Toxicities and management. Urol Oncol. 2017;35(12):701–707. doi:10.1016/j.urolonc.2017.08.005. PMID:28889921.
- Liu D, Wang S, Bindeman W. Clinical applications of PD-L1 bioassays for cancer immunotherapy. J Hematol Oncol. 2017;10:110. doi:10.1186/s13045-017-0479-y. PMID:28514966.
- Chakravarti N, Prieto VG. Predictive factors of activity of anti-programmed death-1/programmed death ligand-1 drugs: immunohistochemistry analysis. Translational Lung Cancer Res. 2015;4:743–51.
- Gandini S, Massi D, Mandalà M. PD-L1 expression in cancer patients receiving anti PD-1/PD-L1 antibodies: A systematic review and meta-analysis. Critical Rev Oncol/Hematol. 2016;100:88–98. doi:10.1016/j.critrevonc.2016.02.001
- McLaughlin J, Han G, Schalper KA, Carvajal-Hausdorf D, Pelekanou V, Rehman J, Velcheti V, Herbst R, LoRusso P, Rimm DL. Quantitative assessment of the heterogeneity of PD-L1 expression in non-small-cell lung cancer. JAMA Oncol. 2016;2:46–54. doi:10.1001/jamaoncol.2015.3638. PMID:26562159.
- Bardelli A, Pantel K. Liquid Biopsies, What We Do Not Know (Yet). Cancer Cell. 2017;31:172–9. doi:10.1016/j.ccell.2017.01.002. PMID:28196593.
- Khoo BL, Grenci G, Jing T, Lim YB, Lee SC, Thiery JP, Han J, Lim CT. Liquid biopsy and therapeutic response: Circulating tumor cell cultures for evaluation of anticancer treatment. Sci Adv. 2016;2:e1600274. doi:10.1126/sciadv.1600274. PMID:27453941.
- Mu Z, Benali-Furet N, Uzan G, Znaty A, Ye Z, Paolillo C, Wang C, Austin L, Rossi G, Fortina P, et al. Detection and characterization of circulating tumor associated cells in metastatic breast cancer. Int J Mol Sci. 2016;17:E1665. doi:10.3390/ijms17101665. PMID:27706044.
- Wang Y, Zhou Y, Hu Z. The functions of circulating tumor cells in early diagnosis and surveillance during cancer advancement. J Translational Int Med. 2017;5:135–8.
- Oliveira-Costa JP, de Carvalho AF, da Silveira GG, Amaya P, Wu Y, Park K-JJ, Gigliola MP, Lustberg M, Buim ME, Ferreira EN, et al. Gene expression patterns through oral squamous cell carcinoma development: PD-L1 expression in primary tumor and circulating tumor cells. Oncotarget. 2015;6:20902–20. doi:10.18632/oncotarget.3939. PMID:26041877.
- Wang X, Sun Q, Liu Q, Wang C, Yao R, Wang Y. CTC immune escape mediated by PD-L1. Medical Hypotheses. 2016;93:138–9. doi:10.1016/j.mehy.2016.05.022. PMID:27372873.
- Anantharaman A, Friedlander T, Lu D, Krupa R, Premasekharan G, Hough J, et al. Programmed death-ligand 1 (PD-L1) characterization of circulating tumor cells (CTCs) in muscle invasive and metastatic bladder cancer patients. BMC Cancer. 2016;16:744. doi:10.1186/s12885-016-2758-3.
- Kulasinghe A, Perry C, Kenny L, Warkiani ME, Nelson C, Punyadeera C. PD-L1 expressing circulating tumour cells in head and neck cancers. BMC Cancer. 2017;17:333. doi:10.1186/s12885-017-3316-3. PMID:28511705.
- Mazel M, Jacot W, Pantel K, Bartkowiak K, Topart D, Cayrefourcq L, Rossille D, Maudelonde T, Fest T, Alix-Panabières C. Frequent expression of PD-L1 on circulating breast cancer cells. Mol Oncol. 2015;9:1773–82. doi:10.1016/j.molonc.2015.05.009. PMID:26093818.
- Nicolazzo C, Raimondi C, Mancini M, Caponnetto S, Gradilone A, Gandini O, Mastromartino M, Del Bene G, Prete A, Longo F, et al. Monitoring PD-L1 positive circulating tumor cells in non-small cell lung cancer patients treated with the PD-1 inhibitor Nivolumab. Sci Rep. 2016;6:31726. doi:10.1038/srep31726. PMID:27553175.
- Satelli A, Batth IS, Brownlee Z, Rojas C, Meng QH, Kopetz S, Li S. Potential role of nuclear PD-L1 expression in cell-surface vimentin positive circulating tumor cells as a prognostic marker in cancer patients. Sci Rep. 2016;6:28910. doi:10.1038/srep28910. PMID:27363678.
- Bai L, Du Y, Peng J, Liu Y, Wang Y, Yang Y, et al. Peptide-based isolation of circulating tumor cells by magnetic nanoparticles. J Materials Chem B. 2014;2:4080–8. doi:10.1039/C4TB00456F
- Liu XR, Shao B, Peng JX, Li HP, Yang YL, Kong WY, Song GH, Jiang HF, Liang X, Yan Y. Identification of high indepen-dent prognostic value of nanotechnology based circulating tumor cell enumeration in first-line chemotherapy for metastatic breast cancer patients. Breast. 2017;32:119–25. doi:10.1016/j.breast.2017.01.007. PMID:28157583.
- Wang W, Li H, Xu F, Du H, Li X, Yi J, Wang G, Luan X. [IFN-gamma up-regulates PD-L1 expression in human placenta mesenchymal stem cells and enhances cell ability to induce the differentiation of IL-10+ T cells from cord blood- and peripheral blood-derived T cells]. Xi Bao Yu Fen Zi Mian Yi Xue Za Zhi. 2016;32:191–5. PMID:26927379.
- Li H, Wang W, Wang G, Hou Y, Xu F, Liu R, Wang F, Xue J, Hu T, Luan X. Interferon-gamma and tumor necrosis factor-alpha promote the ability of human placenta-derived mesenchymal stromal cells to express programmed death ligand-2 and induce the differentiation of CD4(+)interleukin-10(+) and CD8(+)interleukin-10(+)Treg subsets. Cytotherapy. 2015;17:1560–71. doi:10.1016/j.jcyt.2015.07.018. PMID:26432559.
- Poreau B, Sartelet H. Placenta avec mélanome métastatique: un nouveau cas avec expression de PDL1. Annales De Pathologie. 2017;37:338. doi:10.1016/j.annpat.2017.05.005. PMID:28754220.
- Veras E, Kurman RJ, Wang TL, Shih IM. PD-L1 Expression in Human Placentas and Gestational Trophoblastic Diseases. Int J Gynecol Pathol. 2017;36:146–53. PMID:27362903.
- Meng X, Huang Z, Teng F, Xing L, Yu J. Predictive biomarkers in PD-1/PD-L1 checkpoint blockade immunotherapy. Cancer Treatment Rev. 2015;41:868–76. doi:10.1016/j.ctrv.2015.11.001
- Patel SP, Kurzrock R. PD-L1 Expression as a Predictive Biomarker in Cancer Immunotherapy. Mol Cancer Therapeutics. 2015;14:847–56. doi:10.1158/1535-7163.MCT-14-0983
- Manguso RT, Pope HW, Zimmer MD, Brown FD, Yates KB, Miller BC, Collins NB, Bi K, LaFleur MW, Juneja VR, Weiss SA, et al. In vivo CRISPR screening identifies Ptpn2 as a cancer immunotherapy target. Nature. 2017;547:413–8. doi:10.1038/nature23270. PMID:28723893.
- Swaika A, Hammond WA, Joseph RW. Current state of anti-PD-L1 and anti-PD-1 agents in cancer therapy. Mol Immunol. 2015;67:4–17. doi:10.1016/j.molimm.2015.02.009. PMID:25749122.
- Abdel-Rahman O. Correlation between PD-L1 expression and outcome of NSCLC patients treated with anti-PD-1/PD-L1 agents: A meta-analysis. Critical Rev Oncol Hematol. 2016;101:75–85. doi:10.1016/j.critrevonc.2016.03.007
- Fehrenbacher L, Spira A, Ballinger M, Kowanetz M, Vansteenkiste J, Mazieres J, Park K, Smith D, Artal-Cortes A, Lewanski C, et al. Atezolizumab versus docetaxel for patients with previously treated non-small-cell lung cancer (POPLAR): a multicentre, open-label, phase 2 randomised controlled trial. Lancet (London, England). 2016;387:1837–46. doi:10.1016/S0140-6736(16)00587-0. PMID:26970723.
- Gandini S, Massi D, Mandala M. PD-L1 expression in cancer patients receiving anti PD-1/PD-L1 antibodies: A systematic review and meta-analysis. Critical Rev Oncol/Hematol. 2016;100:88–98. doi:10.1016/j.critrevonc.2016.02.001
- Herbst RS, Baas P, Kim DW, Felip E, Perez-Gracia JL, Han JY, et al. Pembrolizumab versus docetaxel for previously treated, PD-L1-positive, advanced non-small-cell lung cancer (KEYNOTE-010): a randomised controlled trial. Lancet (London, England) 2016; 387:1540–50. doi:10.1016/S0140-6736(15)01281-7. PMID:26712084.
- Dudley JC, Lin MT, Le DT, Eshleman JR. Microsatellite instability as a biomarker for PD-1 blockade. Clin Cancer Res. 2016;22:813–20. doi:10.1158/1078-0432.CCR-15-1678. PMID:26880610.
- Efficacy of PD-1 blockade in tumors with MMR deficiency. Immunotherapy. 2016;8:1–3. doi:10.2217/imt.15.97. PMID:26643016.
- Lu D, Krupa R, Premasekharan G, Hough J, Edwards M, Paz R, et al. BMC Cancer.
- Chatterjee S, Lesniak WG, Gabrielson M, Lisok A, Wharram B, Sysa-Shah P, et al. A humanized antibody for imaging immune checkpoint ligand PD-L1 expression in tumors. Oncotarget. 2016;7:10215–27. doi:10.18632/oncotarget.7143. PMID:26848870.
- Overman MJ, McDermott R, Leach JL, Lonardi S, Lenz H-J, Morse MA, Desai J, Hill A, Axelson M, Moss RA, et al. Nivolumab in patients with metastatic DNA mismatch repair-deficient or microsatellite instability-high colorectal cancer (CheckMate 142): an open-label, multicentre, phase 2 study. Lancet Oncol. 2017; 18:1182–91. doi:10.1016/S1470-2045(17)30422-9. PMID:28734759.
- Le DT, Uram JN, Wang H, Bartlett BR, Kemberling H, Eyring AD, Skora AD, Luber BS, Azad NS, Laheru D, et al. PD-1 Blockade in Tumors with Mismatch-Repair Deficiency. N Engl J Med. 2015;372:2509–20. doi:10.1056/NEJMoa1500596. PMID:26028255.
- Mlecnik B, Bindea G, Angell HK, Maby P, Angelova M, Tougeron D, Church SE, Lafontaine L, Fischer M, Fredriksen T, et al. Integrative analyses of colorectal cancer show immunoscore is a stronger predictor of patient survival than microsatellite instability. Immunity. 2016;44:698–711. doi:10.1016/j.immuni.2016.02.025. PMID:26982367.
- Hoos A. Evolution of end points for cancer immunotherapy trials. Ann Oncol. 2012;23 Suppl 8:viii47–52. doi:10.1093/annonc/mds263. PMID:22918928.
- Topalian SL, Sznol M, McDermott DF, Kluger HM, Carvajal RD, Sharfman WH, et al. Survival, durable tumor remission, and long-term safety in patients with advanced melanoma receiving nivolumab. J Clin Oncol. 2014;32:1020–30. doi:10.1200/JCO.2013.53.0105. PMID:24590637.
- Alix-Panabieres C, Pantel K. Clinical applications of circulating tumor cells and circulating tumor DNA as liquid biopsy. Cancer Discov. 2016;6:479–91. doi:10.1158/2159-8290.CD-15-1483. PMID:26969689.
- Alix-Panabières C, Schwarzenbach H, Pantel K. Circulating tumor cells and circulating tumor DNA. Ann Rev Med. 2012;63:199–215. doi:10.1146/annurev-med-062310-094219. PMID:22053740.