
ABSTRACT
We previously demonstrated that neurotensin (NTS) induces local inflammation and promotes tumor invasion in hepatocellular carcinoma (HCC). However, the underlying molecular mechanisms are not clear. In this study, positive correlations between NTS and interleukin (IL)-8 were identified at both the mRNA and protein levels in 71 fresh HCC tissues and 100 paraffin-embedded HCC tissues. Furthermore, significant correlations were determined among the co-expression of NTS and IL-8, infiltration of inflammatory cells and enhanced epithelial-mesenchymal transition (EMT) of HCC cells. NTS-induced IL-8 production was associated with activation of the mitogen-activated protein kinase (MAPK) and nuclear factor-kappa B (NF-κB) pathways rather than the protein kinase C (PKC) and phosphoinositide-3 kinase (PI3K) pathways, whose specific antagonists significantly inhibited activation of the NTS/IL-8 pathway. IL-8, which promoted EMT and HCC invasion both in vitro and in vivo, was produced by NTS-induced HCC cells and was effectively attenuated by blocking IL-8 receptors in vitro. Moreover, HCC-derived IL-8 attracted more CD68+ tumor-associated macrophages (TAMs) and CD66b+ polymorphonuclear neutrophils (PMNs) to the local microenvironment, displaying enhanced cytokine secretion and phagocytosis. IL-8 stimulated the M2 polarization of TAMs, which promoted the EMT and invasive potential of HCC cells. Blockage of the IL-8 receptor, NTR1 receptor or both significantly reduced HCC metastases in tumor-bearing mouse models via inhibiting EMT. In summary, aberrant activation of the NTS/IL-8 pathway in HCC dramatically stimulated the invasive potential of HCC cells. HCC-derived IL-8 promoted a pro-oncogenic inflammatory microenvironment by inducing M2-type TAMs and indirectly promoting EMT, which might be a valuable therapeutic target to prevent tumor progression.
Introduction
Hepatocellular carcinoma (HCC) represents one of the most common causes of cancer-related death, with the third highest mortality rate worldwide.Citation1 With the development of surgical resection and interventional therapy, the prognosis of early HCC has improved. However, the 5-year survival rate has been sustained at a low rate of 5–6% because of the high incidence of recurrence and metastasis after surgery. Therefore, gaining a further understanding of the regulatory mechanisms underlying tumor invasion and progression will help to improve the poor clinical outcome of HCC patients.
Chronic inflammation, especially pathogen-induced inflammation, has been identified as a factor that promotes tumor invasion and progression in HCC.Citation2,Citation3 However, the pro-carcinogenic effects of the non-pathogenic inflammatory micro- environment in HCC have not been elucidated yet. In our previous study, we conducted a whole-genomic expression profiling assay in 71 HCC tissue samples using human genome U133 plus2 arrays and distinguished three subtypes with different molecular signatures and clinical prognosis via unsupervised principal components analysis (PCA) (Fig. S1). There was no difference in hepatitis B virus (HBV) infection status, inflammation or immunological response-related pathways found to be enriched in patients showing a relatively poor outcome, which implied that the non-pathogenic inflammatory microenvironment might play a vital role in promoting HCC progression.
Recently, neuropeptides were identified as a new category of proinflammatory molecules in the liver. Neuropeptides are the largest group of cell-cell signaling molecules comprising more than 100 types of small-molecule peptides that regulate a number of diverse physiological processes.Citation4 Some neuropeptides were reported to promote the development and progression of HCC via participation in the generation of the inflammatory microenvironment.Citation5-Citation7 Our previous study observed the ectopic expression of neurotensin (NTS), a special neuropeptide in HCC, correlated with significant tumor invasion and poor clinical outcome in HCC patients.Citation8,Citation9 Furthermore, NTS overexpression was accompanied by enhanced inflammatory responses and epithelial-mesenchymal transition (EMT) features in situ. However, the major molecular mechanisms involved were not disclosed.
NTS is an endogenous neuropeptide comprising 13 amino acids and was first isolated from extracts of the bovine hypothalamus in 1973.Citation10 NTS is widely expressed in the central nervous system and gastrointestinal tract of humans and animals and is involved in digestion-related hormonal and neurocrine regulatory processes such as inhibition of small bowel motility and gastric acid secretions, stimulation of pancreatic and biliary secretions, and facilitation of fatty acid absorption.Citation11,Citation12 The ectopic expression of NTS was first identified in breast cancer in 1985.Citation13 Recent studies have confirmed the close relationship of NTS with the proliferation and invasion of a variety of malignant tumors, including pancreatic, colon, prostate, and lung cancers.Citation14,Citation15 Furthermore, NTS has been reported to stimulate the release of cytokines and promote the development of the local inflammatory microenvironment in cancer, such as interleukin (IL)-8 in colorectal cancer, which is called the NTS/IL-8 pathway.Citation16
IL-8, also known as CXCL8, a prototype of the cysteine-X-cysteine (CXC) chemokines, was originally considered a leukocyte chemoattractant that recruits neutrophils and macrophages to the tumor site in a paracrine fashion.Citation17 Subsequently, more studies demonstrated that in addition to promoting the inflammatory microenvironment in cancer, IL-8 plays multiple roles in cancer development. Recent studies have found that IL-8 is secreted by some tumor cells and plays vital roles in the proliferation, differentiation, angiogenesis, and invasion and metastasis of tumors such as melanoma, ovarian cancer, renal cell carcinoma, and breast cancer.Citation18-Citation21 Moreover, IL-8 was reported to exert its pro-carcinogenic effects through an autocrine loop to maintain the mesenchymal traits of tumor cells.Citation22,Citation23
Recent reports indicated that IL-8 might be a valuable prognostic biomarker in HCC via the promotion of angiogenesis and metastasis.Citation24-Citation26 However, few studies have focused on the correlation between NTS and IL-8 in HCC progression. Because NTS is transiently expressed in the fetal liver but is hardly expressed in the normal mature liver, most primary HCC tissues express comparably low levels of NTS compared to other cancer types. However, our previous study of public genome-wide gene expression profiling data suggested a possible correlation between NTS and IL-8 in HCC tissues at the mRNA level.Citation8,Citation9 Therefore, in this study, we investigated whether the NTS/IL-8 pathway is dysfunctionally activated in HCC, as well as its biological significance in generating the local inflammatory microenvironment and promoting HCC invasion. This work will help to screen potential therapeutic target biomarkers for new strategies in the prevention of HCC progression.
Results
A significant correlation between IL-8 and NTS was detected in HCC tissues, which was associated with a poor clinical outcome
A total of 71 primary HCC tissues were collected and subjected to whole-genome expression profiling using Affymetrix GeneChip® human genome U133 plus 2.0 microarrays. The results showed overexpression of NTS at the mRNA level exclusively in a special HCC subtype, in which upregulated IL-8 was detected accordingly. Among these 71 HCC tissues, the frequency of NTS-high expressing (NTS+) tissues was 26.76% (19/71), while that of IL-8-high expressing (IL-8+) tissues was 43.66% (31/71); 73.68% (14/19) of the NTS+ HCC tissues overexpressed IL-8 (). Spearman's rank correlation test showed a statistically significant correlation between NTS and IL-8 expression at the mRNA level (r = 0.33, P = 0.0050).
Figure 1. Significant correlation between NTS/IL-8 co-expression and patient prognosis confirmed at the mRNA and protein levels. a. Seventy-one fresh primary HCC tissues were detected via whole-genome expression microarray. The results showed that the majority of samples overexpressing NTS had upregulated IL-8 expression, with a positive correlation between NTS and IL-8. b. NTS and IL-8-positive staining was exclusively detected in the cytoplasm of HCC cells via IHC staining. c. The OS was compared between NTS+ and NTS−, IL-8+ and IL-8−, NTS+IL-8+and non-NTS+IL-8+ patients grouped according to mRNA levels. Although no significant difference was determined between NTS+ and NTS− patients, IL-8+and NTS+IL-8+ HCC patients showed worse prognosis. d. The OS was compared in 100 HCC samples according to the IHC results. NTS+ and NTS+IL-8+ HCC patients had a shorter OS than NTS− and non-NTS+IL-8+ patients respectively, but no significant difference was determined between IL-8+ and IL-8− patients.
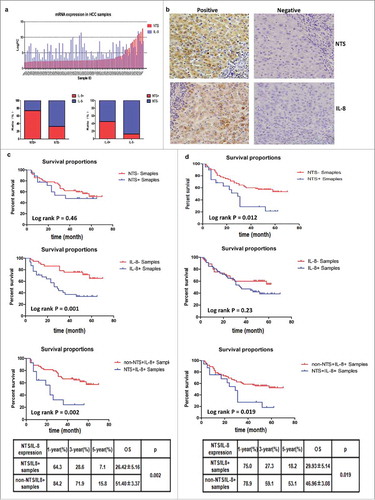
We also detected the expression of NTS and IL-8 proteins in 100 primary HCC tissues and corresponding normal adjacent tissues using an immunohistochemistry (IHC) staining method. NTS and IL-8-positive staining was exclusively detected in the cytoplasm of HCC cells, whereas no positive staining was observed in the normal adjacent tissues (). Among these 100 HCC samples, the frequency of NTS-expressing tissues was 19.00% (19/100), while that of IL-8-expressing tissues was 49.00% (49/100); the frequency of IL-8 expression in NTS-positive samples was 84.21% (16/19). The protein level of IL-8 was compared between the NTS+ and NTS− samples. Compared to NTS− samples, there was a significantly higher number of IL-8+ samples among the NTS+ HCC tissues (84.21% vs. 41.98%, P = 0.0020).
Since the 71 patients included in the mRNA cohort were part of the 100 patients included in the IHC cohort, we compared the expression of NTS and IL-8 at both the mRNA and protein levels. Fourteen patients were identified as NTS+IL-8+ by mRNA expression, and 12 patients were identified as NTS+IL-8+ by IHC, among which 10 cases were confirmed by both techniques.
We next compared the clinic-pathological features of HCC patients of the NTS+IL-8+ subtype and non-NTS+IL-8+ subtype (). There was no association of either NTS or IL-8 expression with gender, age, HBV infection, alcohol history, tumor size, or histological grade at both the mRNA and protein levels. The portal vein invasion incidence was consistent with that in a previous report.Citation27 However, the NTS+IL-8+ subtypes grouped according to the IHC and mRNA results were significantly correlated with portal vein invasion, which implied that co-expression of NTS and IL-8 might affect HCC invasion and metastasis in vivo (). Moreover, we compared the overall survival (OS) between NTS+ and NTS−, IL-8+ and IL-8−, and NTS+IL-8+ and non-NTS+IL-8+ HCC patients using the Kaplan-Meier method and log-rank test. We first analyzed the OS of the 71 HCC patients grouped according to the mRNA analysis results, in which IL-8+ and NTS+IL-8+ HCC patients showed a worse prognosis (34.24 ± 4.39 vs. 56.38 ± 3.62, P = 0.0010; 26.42 ± 5.16 vs. 51.40 ± 3.37, P = 0.0020; ). However, no significant difference in the OS was determined between the NTS+ and NTS− groups (40.43 ± 5.90 vs. 48.60 ± 3.63, P = 0.46; ). We also analyzed the outcomes of the 100 paraffin-embedded HCC samples. Although no significant difference in OS was identified between IL-8+ and IL-8− HCC patients (42.73 ± 3.56 vs. 41.74 ± 3.79, P = 0.23), NTS+ and NTS+IL-8+ HCC patients had a shorter OS than NTS− and non-NTS+IL-8+ patients, respectively (29.56 ± 4.94 vs. 47.41 ± 3.13, P = 0.012; 29.93 ± 5.14 vs. 46.96 ± 3.08, P = 0.019; ). In addition, the 1-year, 3-year, and 5-year survival rates of NTS+IL-8+ HCC patients were significantly lower than those of non-NTS+IL-8+ patients at both the mRNA and IHC levels. Collectively, these findings revealed that the co-expression of NTS and IL-8 is closely associated with an aggressive HCC phenotype and poor clinical outcome in HCC.
Co-expression of NTS and IL-8 was associated with enhanced tumor EMT and local inflammatory response in HCC tissues
We detected the mRNA levels of four EMT-related genes (E-cadherin, N-cadherin, β-catenin, and vimentin) in the 71 HCC tissue samples. Higher expression rates of N-cadherin (83.30% vs. 52.50%), β-catenin (83.30% vs. 44.10%), and Vimentin (66.70% vs. 42.40%) but lower expression rates of E-cadherin (16.70% vs. 62.70%) were observed in NTS+IL-8+ HCC tissues. Spearman's rank correlation test showed that increased N-cadherin and β-catenin expression (r = 0.22, P = 0.049 and r = 0.22, P = 0.013, respectively) as well as decreased E-cadherin expression (r = -0.22, P = 0.039) were significantly correlated with the co-expression of NTS and IL-8 in HCC tissues.
We also compared the protein expression of a series of EMT biomarkers in 100 HCC tissue samples. The IHC results showed that the protein expression level of E-cadherin significantly decreased, but that of N-cadherin on the cytomembrane and β-catenin in the cytoplasm significantly increased in the NTS+IL-8+ samples, with no difference detected for Vimentin protein expression (). Spearman's rank correlation test showed that the co-expression of NTS and IL-8 was significantly negatively correlated with E-cadherin expression (r = -0.22, P = 0.025) but was positively correlated with N-cadherin (r = 0.30, P = 0.0020) and β-catenin (r = 0.21, P = 0.039) expression in HCC.
Figure 2. NTS/IL-8 co-expression was associated with enhanced inflammation and EMT features in HCC tissues. Decreased expression levels of E-cadherin and increased levels of N-cadherin on the membrane, and accumulation of β-catenin in the cytoplasm were detected in the NTS+IL-8+ cancer cells, which implied EMT progress. Expression of the invasion biomarker MMP9 was also increased along with two angiogenesis biomarkers, CD31 and VEGF. The infiltration of CD68+, CD163+ cells and CD66b+ cells increased in cancer tissues, representing an increase in M2 TAMs and PMNs.
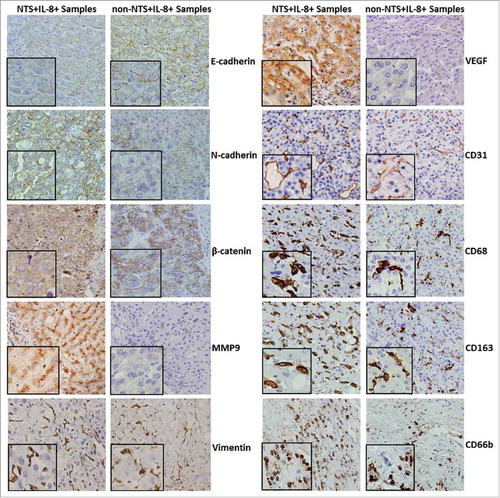
Another cell invasion biomarker, matrix metalloproteinase 9 (MMP9), was highly expressed in NTS+IL-8+ HCC tissues compared to that of non-NTS+IL-8+ tissues (P = 0.018, ). Similarly, expression of the angiogenesis biomarker vascular endothelial growth factor (VEGF) was upregulated in NTS+IL-8+ HCC tissues (P = 0.031, ). Furthermore, the number of CD31+ microvessels (49.94 ± 13.11 vs. 25.33 ± 12.43, P < 0.001), CD68+ TAMs (74.06 ± 14.73 vs. 41.15 ± 15.82, P < 0.001), CD163+ M2-type TAMs (43.12 ± 13.23 vs. 22.57 ± 10.47, P < 0.001), and CD66b+ PMNs (36.87 ± 8.96 vs. 18.15 ± 11.54, P = 0.032) was significantly increased in NTS+IL-8+ HCC tissues (). These results implied that the co-expression of NTS and IL-8 was correlated with an enhanced tumor EMT and local inflammatory response in HCC tissues, which would promote tumor invasion and the infiltration of inflammatory cells in situ.
NTS induced the synthesis and secretion of IL-8 via interacting with NTR1 in HCC cells
We compared the synthesis and secretion of IL-8 among four HCC cell lines (7721, MHCC97L, Hep3B, and HepG2) that express variable levels of the high-affinity NTS receptor NTR1. Among these cell lines, HepG2 cells show the greatest NTS sensitivity, and Hep3B cells are comparatively less NTS-sensitive.Citation9 Indeed, HepG2 cells clearly displayed the highest level of IL-8 at both the mRNA and protein levels, whereas Hep3B cells displayed the lowest level of IL-8, which implied a direct relationship between NTS sensitivity and IL-8 production in HCC ().
Figure 3. NTS induced the synthesis and secretion of IL-8 in HCC cell lines. a. The secretion of IL-8 was examined in four HCC cell lines with different NTS and NTR1 expression by ELISA. b. The mRNA levels of IL-8 in four HCC cell lines were detected by real-time PCR. c. IL-8 mRNA expression levels of genetically modified Hep3B cells with or without NTS stimulation. d. IL-8 mRNA expression levels of genetically modified HepG2 cells with or without NTS stimulation. e. The secretion of IL-8 in supernatants of Hep3B cells was examined by ELISA. f. The secretion of IL-8 in supernatants of HepG2 cells was examined by ELISA.
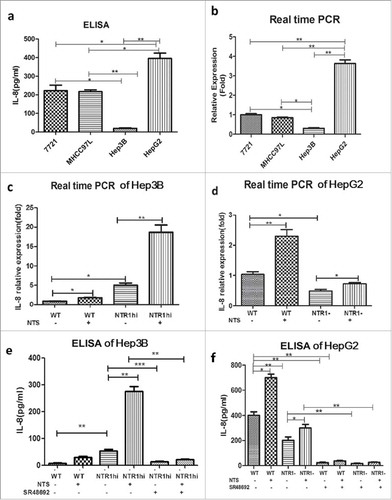
Therefore, we constructed variable NTS-sensitive HCC cell lines by genetically modifying the expression of NTR1 to compare the synthesis and secretion of IL-8 at both the mRNA and protein levels (Fig. S4). The NTR1-overexpressing HCC cell lines were generated by transfecting wild-type Hep3B (Hep3Bwt) cells with the recombinant retroviral vector pLVX-IRES-Puro-NTR1, termed Hep3BNTR1hi cells, and the NTR1 knockdown HCC cell lines were constructed by silencing HepG2wt cells using specific NTR1 small interfering RNAs (siRNAs), termed HepG2NTR1− cells. The relative IL-8 mRNA level in Hep3BNTR1hi cells was 5.36 ± 1.17-fold higher than that in Hep3Bwt cells (P < 0.01), which further increased to 17.89 ± 1.38-fold after adding exogenous NTS as a stimulus (P < 0.01, ). Compared to HepG2wt cells, the relative IL-8 mRNA levels significantly decreased in HepG2NTR1− (P < 0.050), which increased by 1.58 ± 0.23-fold after NTS stimulation but were still lower than those in NTS-treated HepG2wt cells (P < 0.01, ). We also compared the IL-8 protein levels in the supernatants of the various HCC cell lines. Compared to the undetectable levels of IL-8 in the supernatants of Hep3Bwt cells (), a significant increase in IL-8 secretion was detected in the supernatants of Hep3BNTR1hi cells (53.67 ± 6.33 pg/mL vs. 8.00 ± 1.53 pg/mL; P < 0.01), which further increased after NTS stimulation (275.70 ± 18.41 pg/mL, P < 0.01). After adding the NTR1 antagonist SR48692 to block the interaction of NTS and NTR1, IL-8 secretion decreased markedly in both Hep3BNTR1hi cells (14.00 ± 2.08 pg/mL, P < 0.01) and NTS-treated Hep3BNTR1hi cells (21.67 ± 2.19 pg/mL, P < 0.01). Consistent results were obtained in HepG2wt and HepG2NTR1− cells (). The level of IL-8 was obviously reduced in HepG2NTR1− cells compared to that in HepG2wt cells (203.30 ±12.02 pg/mL vs. 410.02 ± 0.82 pg/mL, P = 0.0016). The levels of IL-8 increased after NTS stimulation (666.70 ± 8.82 pg/mL, P = 0.0010) but rapidly decreased after adding SR48692 (78.33 ± 4.41 pg/mL, P < 0.01). These results indicated that NTS induces the synthesis and secretion of IL-8 in HCC by interacting with NTR1, which was fully inhibited by the NTR1 antagonist SR48692.
NTS-induced IL-8 enhanced HCC invasion and migration by promoting EMT
The invasion and migration of HCC cells were evaluated by performing a wound-healing test and Transwell invasion assay in vitro. The 24 h and 48 h wound-closure rates of Hep3BNTR1hi cells were higher than those of Hep3Bwt cells (39.33 ± 2.60% vs. 28.00 ± 1.53%, P = 0.020; 64.32 ± 2.08% vs. 40.00 ± 2.89%, P = 0.0030, ). After NTS stimulation, the wound-closure rate in the NTS-treated Hep3BNTR1hi cells increased significantly at both 24 h and 48 h (55.01 ± 2.89% vs. 39.33 ± 2.60%, P = 0.016; 91.33 ± 1.86% vs. 64.32 ± 2.08%, P < 0.001, ). However, after adding the IL-8 receptor CXCR1/2 antagonist reparixin, the wound-closure rate of the Hep3BNTR1hi cells and NTS-treated Hep3BNTR1hi cells decreased dramatically at both 24 h and 48 h (P < 0.001, ). Consistent results were observed in HepG2wt cells. The wound-closure rates of reparixin-treated HepG2wt cells decreased markedly both at 24 h and 48 h either with or without NTS stimulation (P < 0.001, ).
Figure 4. Activation of the NTS/IL-8 pathway enhanced the invasion and migration of HCC cells by promoting EMT. a. Effect of the CXCR1/2-specific antagonist reparixin, which is used for blocking IL-8, on the migration of Hep3Bwt and Hep3BNTR1hi cells was evaluated by a wound-healing assay. Blocking IL-8 signal could reduce the migration of HCC cells with or without NTS stimulation. b. The change of migration function on HepG2 cells was also examined by a wound-healing assay after reparixin blocking, and same result was detected. c. Blocking IL-8 could reduce the invasiveness of Hep3Bwt and Hep3BNTR1hi cells as detected with the Transwell assay. d. The same result was detected for HepG2 cells. e. EMT markers were analyzed in Hep3Bwt and Hep3BNTR1hi cells after reparixin treatment, and reparixin increased the level of E-cadherin remarkably but decreased the levels of N-cadherin and β-catenin significantly. f. The same tendency of the EMT markers was determined in HepG2 cells which indicated reparixin reversed the EMT of HCC cells effectively.
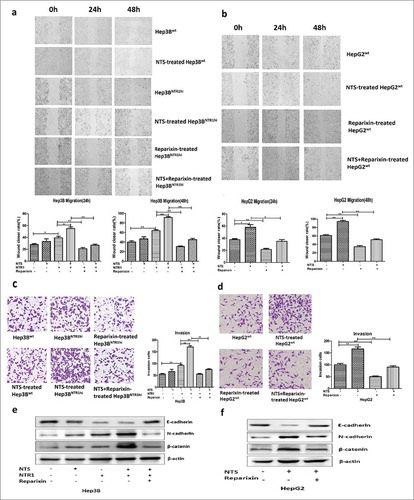
Simultaneously, more invasive Hep3BNTR1hi cells were observed than Hep3Bwt cells (92.00 ± 4.13 vs. 53.33 ± 4.41, P = 0.0030), which nearly doubled after NTS stimulation (170.00 ± 5.78 vs. 92.00 ± 4.13, P < 0.001). However, the number of invasive Hep3BNTR1hi cells decreased by almost half after reparixin treatment either with or without NTS stimulation (75.00 ± 2.87 vs. 170.00 ± 5.78, P = 0.0010; 55.01 ± 3.21 vs. 92.00 ± 4.13, P = 0.0020, ). Consistent results were obtained in reparixin-treated HepG2wt cells ().
We next compared the expression of key EMT-related biomarkers after blocking IL-8 receptors CXCR1/2. Compared with the NTS-untreated controls, the expression level of E-cadherin decreased in both NTS-treated Hep3Bwt, Hep3BNTR1hi and HepG2wt cells, whereas the expression levels of N-cadherin and β-catenin increased. However, after adding reparixin, the expression level of E-cadherin remarkably increased in both Hep3BNTR1hi and HepG2wt cells, while the expression levels of N-cadherin and β-catenin significantly decreased, which implied that blocking IL-8 receptors could reverse the EMT of HCC cells (). These results implied that NTS-induced IL-8 enhanced HCC invasion and migration by promoting EMT, which could be inhibited by blocking IL-8 signaling.
NTS induced IL-8 production by activating the MAPK and NF-κB pathways rather than the PKC and PI3K pathways
To elucidate the molecular mechanisms regulating NTS-induced IL-8 production in HCC, the MAPK, NF-κB, PKC, and PI3K pathways, which have been reported to induce IL-8 secretion, were analyzed.Citation28–Citation30 Hep3BNTR1hi cells were treated with NTS for 5 min, 15 min, 30 min, 1 h, 6 h, 12 h, and 24 h to detect the expression and phosphorylation of relevant functional proteins along the pathways. Obvious phosphorylation was detected of p38 and extracellular signaling-related kinase (ERK) proteins at 5 min, c-Jun N-terminal kinase (JNK) protein at 15 min, along with phosphorylated IκB at 5 min and p65 at 15 min after NTS stimulation. However, no changes in phosphorylated PKC and PI3K proteins were detected (). After blocking NTR1 using SR48692, no detectable activation of the MAPK and NF-κB pathways was observed (). We detected the levels of the major subunits of the NF-κB transcription factor complex in nucleoprotein extracts and found that the levels of p65 and p50 increased exclusively (0.75 ± 0.86 vs. 0.21 ± 0.62, P < 0.001; 1.98 ± 0.23 vs. 0.82 ± 0.94, P < 0.001, respectively) in NTS-treated Hep3BNTR1hi cells compared to Hep3BNTR1hi cells, but there were no changes in p52, C-Rel, and Rel-B proteins (). Furthermore, after adding SR48692 to block NTR1, the levels of p65 and p50 in the nucleoprotein of NTS-treated Hep3BNTR1hi cells decreased dramatically, but no differences in the levels of p52, C-Rel, and Rel-B proteins occurred (). This result indicated that NTS triggered activation of the canonical NF-κB pathway rather than the non-canonical NF-κB pathway. Similar results were obtained in HepG2wt cells, in which NTS induced the activation of both MAPK and canonical NF-κB signaling pathways (Fig. S5a-c). We also examined the activation of Ras protein after NTS stimulation and confirmed that the level of activated Ras protein increased after 5 min in either Hep3B or HepG2 cells (, S5a). The results indicated that the NTS-induced activation of the MAPK pathway was Ras-dependent in HCC, which was consistent with that in colorectal cancer.Citation28
Figure 5. NTS induced IL-8 by activating the MAPK and NF-κB pathways, which are important for the EMT and invasiveness of HCC cells. a. Key proteins along the Ras, MAPK, NF-κB, PKC, and PI3K signaling pathways were examined after NTS treatment, and obvious activation of Ras, p38, ERK, JNK, IκB and p65 proteins was detected which implied that the Ras, MAPK and NF-κB signaling pathways are activated after NTS stimulation. b. After blocking NTR1, the phosphorylation of JNK, ERK, or p38 protein in the MAPK pathway and the phosphorylation of IκB and p65 decreased. c. The activation status of five subunits of the NF-κB family was examined in extracting nuclear proteins, among which p65 and p50 significantly increased after NTS stimulation, but decreased after blocking NTR1. d. The specific antagonists against the MAPK or NF-κB pathway inhibited IL-8 secretion in Hep3BNTR1hi cells. e. Blocking the MAPK pathway or the NF-κB pathway inhibited the migration of Hep3BNTR1hi cells. f. The invasion capacity declined after blocking the MAPK pathway or the NF-κB pathway. g. The specific antagonists against the MAPK or NF-κB pathway could reverse the EMT of HCC cells.
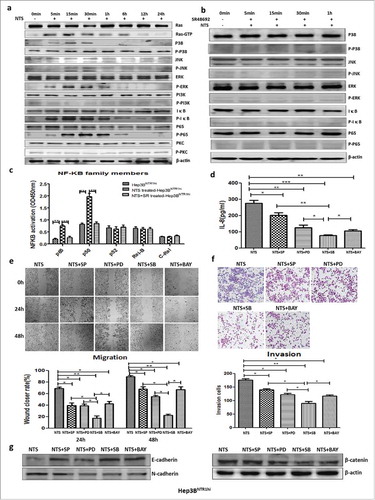
We suppressed either the MAPK or NF-κB pathway using corresponding inhibitors, SP600125 (SP), PD98059 (PD), SB203580 (SB), and BAY117082 (BAY), which significantly decreased the IL-8 levels in the supernatants of NTS-treated Hep3BNTR1hi cells (P < 0.05, ). In addition, the level of IL-8 in SB-treated Hep3BNTR1hi cells (76.33 ± 2.26 pg/mL) was comparably lower than those in SP-treated (202.30 ± 14.88 pg/mL, P = 0.0012), PD-treated (125.70 ± 14.87 pg/mL, P = 0.033), or BAY-treated (105.30 ± 7.88 pg/mL, P = 0.032) cells, which implied that the NTS-induced IL-8 production was mainly derived from activation of the p38 pathway. Consistent results were obtained in HepG2wt cells (Fig. S5d). Therefore, these results suggest that NTS induced IL-8 production by activating the MAPK and NF-κB pathways, and specific inhibition of both pathways would dramatically decrease the release of IL-8.
Inhibiting the MAPK or NF-κB pathway suppressed HCC invasion and migration by attenuating EMT
After NTS stimulation, the 24 h and 48 h wound-healing capacity of SB-treated Hep3BNTR1hi cells significantly decreased (17.40 ± 3.99% vs. 68.93 ± 2.38%, P < 0.001; 22.33 ± 2.03% vs. 89.23 ± 2.07%, P < 0.001, respectively, ). Similar results were identified in SP-treated (39.33 ± 4.26%, P = 0.0037; 67.67 ± 4.33%, P = 0.011), PD-treated (38.97 ± 3.10%, P = 0.0016; 54.67 ± 2.19%, P < 0.05), or BAY-treated (42.40 ± 3.90%, P = 0.0044; 67.00 ± 4.73%, P = 0.013) Hep3BNTR1hi cells. Consistently, the number of invasive cells was reduced significantly in each inhibitor-treated Hep3BNTR1hi cell group, among which that of the SB-treated group (89.33 ± 7.80) was comparably lower than that of the SP-treated (140.00 ± 3.61, P = 0.015), PD-treated (122.00 ± 4.73, P = 0.022), or BAY-treated (116.33 ± 4.06, P = 0.014, ) groups. Consistent results of migration and invasion were obtained in HepG2wt cells (Fig. S5e-f).
We also studied the effects of the above inhibitors on the expression of multiple EMT biomarkers using western blot assays. The expression of E-cadherin increased in SB-treated, SP-treated, PD-treated, and BAY-treated Hep3BNTR1hi and HepG2wt cells, whereas the expression levels of N-cadherin and β-catenin decreased with inhibitor treatment (, S5g). These results implied that inhibiting the MAPK or NF-κB pathway suppressed HCC invasion and migration by attenuating EMT.
NTS-induced IL-8 activated the M2 polarization of TAMs by promoting a phenotypic switch, chemotaxis, and phagocytosis in vitro
Since IL-8 is an important chemotaxin of neutrophils and macrophages, we analyzed the effect of IL-8 on the phenotypes and functions of healthy donor-derived peripheral blood mononuclear cells (PBMCs) and PMNs. Both PBMCs and PMNs were attracted by exogenous IL-8. Furthermore, the percentage of CD68+ cells increased (P = 0.0027), along with the percentages of CD163+CD206+ cells (40.23 ± 5.05% vs. 77.13 ± 2.44%, P = 0.0028), whereas the percentage of CCR7+ cells decreased in PBMCs after IL-8 stimulation (14.57 ± 2.33% vs. 6.10 ± 1.40%, P = 0.036), which indicated that IL-8 induced the typical phenotype switch in the M2 polarization of macrophages in PBMCs. Accordingly, the levels of IL-10 in the supernatant of IL-8-treated PMBCs after 72 h were significantly increased (59.00 ± 3.06 pg/mL vs. 145.00 ± 9.07 pg/mL, P < 0.001), while the levels of IL-12 decreased (15.00 ± 1.16 pg/mL vs. 6.00 ± 1.00 pg/mL, P = 0.0041). However, no difference in the levels of TGF-β was detected. IL-8 did not affect the secretion of VEGF, CCL2 and CCL3 in PMNs, which implied that IL-8 hardly affected the N1/N2 polarization of PMNs in vitro (Fig. S6).
The human acute monocytic leukemia cell line THP-1 was used to study IL-8- mediated effects on TAMs polarization. THP-1 cells were co-cultured with Hep3Bwt or Hep3BNTR1hi cells with or without NTS stimulation. More CD68+ cells were detected in Hep3BNTR1hi cells than in Hep3Bwt cells (P = 0.0058), which increased by more than 3-fold after NTS stimulation (P = 0.0030) but decreased dramatically after adding the NTR1 antagonist SR48692 (P = 0.0029). Consistently, the percentages of CD163+CD206+ cells increased after NTS stimulation (21.33 ± 1.86% vs. 79.33 ± 3.48%, P = 0.0001) but decreased dramatically after blocking NTR1 (79.33 ± 3.480% vs. 12.67 ± 2.404%, P = 0.0001, ), which implied that NTS triggered the M2 polarization of CD68+ macrophages in THP-1 cells.
Figure 6. NTS-induced IL-8 activated M2 polarization of TAMs by promoting a phenotypic switch, chemotaxis, and phagocytosis in vitro. a. THP-1 cells were co-cultured with Hep3Bwt or Hep3BNTR1hi cells with or without NTS stimulation. More CD68+ cells and CD163+CD206+ cells were detected in Hep3BNTR1hi cells than in Hep3Bwt cells, but these numbers decreased dramatically after adding the NTR1 antagonist SR48692, which implied that NTS-induced IL-8 caused the M2 polarization of CD68+ macrophages in THP-1 cells. b. THP-1 cells were cultured in IL-8-supplemented medium, leading to a significant increase of the percentages of CD68+ cells and CD163+CD206+ cells, but a decrease of the percentage of CCR7+ cells. c. The levels of IL-10 in the supernatants were significantly higher in IL-8-treated THP-1 cells, but the levels of IL-12 were decreased. No difference in the levels of TGF-β was detected. d. Exogenous IL-8 did not affect the proliferation of THP-1 cells. e. Exogenous IL-8 did not affect the apoptosis of THP-1 cells. f. IL-8 enhanced cell migration through the BME membrane. g. IL-8 enhanced the phagocytosis ability of THP-1 cells against exogenous fluorescence-labeled A549 cells.
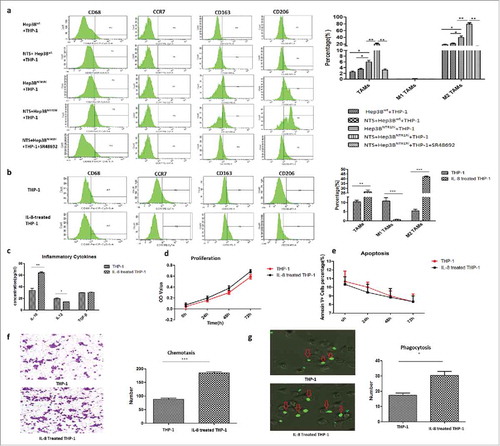
Next, THP-1 cells were cultured in IL-8-supplemented medium (), which resulted in a significant increase in the percentages of CD68+ cells (P = 0.0015) and CD163+CD206+ cells (5.43 ± 0.87% vs. 42.13 ± 0.88%, P < 0.05) but a decrease in the percentage of CCR7+ cells (10.77 ± 1.86% vs. 0.63 ± 0.17%, P = 0.0056), which was consistent with the results in PBMCs. Similarly, the levels of IL-10 in the supernatants were significantly increased in IL-8-treated THP-1 cells (33.30 ± 3.78 vs. 63.67 ± 1.86, P = 0.0020). However, the levels of IL-12 were decreased (19.31 ± 1.43 pg/mL vs. 13.68 ± 0.29 pg/mL, p = 0.018, ), with no difference in the levels of TGF-β. Although exogenous IL-8 did not affect the proliferation and apoptosis of THP-1 cells (), IL-8 enhanced migration through the BME membrane (185.00 ± 3.60 vs. 87.33 ± 4.33, P < 0.001) and the phagocytosis ability of exogenous fluorescence-tagged A549 cells (30.33 ± 2.60 vs. 17.33 ± 1.45, P < 0.05) of THP-1 cells (). These results implied that NTS induced the IL-8 activated M2 polarization of TAMs by promoting a phenotypic switch, chemotaxis, and phagocytosis in vitro.
IL-8-activated TAMs promoted HCC invasion by accelerating EMT in a non- membrane-bound manner
We further evaluated whether IL-8-activated TAMs affected the migration and invasion potential of HCC cells in vitro by co-culturing Hep3Bwt cells with IL-8-activated THP-1 cells. After 24 h and 48 h, the wound-closure rate of Hep3Bwt cells co-cultured with IL-8-stimulated THP-1 cells (Hep3B+TAMs group, 50.67 ± 3.48% and 74.67 ± 3.18%) was markedly higher than that in those co-cultured with untreated THP-1 cells (Hep3B+THP-1 group, 26.33 ± 2.33% and 41.33 ± 1.86%; P = 0.020 and P = 0.0044 at 24 h and 48 h, respectively) or Hep3Bwt cells alone (Hep3B group) (19.67 ± 2.60%, P = 0.0020 and 33.00 ± 2.08%, P = 0.00040, respectively; ). Similarly, the numbers of invading Hep3Bwt cells in the Hep3B+TAMs group significantly increased compared to those in the Hep3B+THP-1 group (197.30 ± 6.44 vs. 86.00 ± 3.46, P < 0.001) and the Hep3B group (72.33 ± 5.04, P < 0.001; ). Consistent results of migration and invasion were obtained in HepG2wt cells co-cultured with IL-8-activated THP-1 cells (HepG2+TAMs group) and untreated THP-1 cells (HepG2+THP-1 group), as well as in HepG2wt cells alone (HepG2 group) (, ). These data confirmed that IL-8-activated TAMs promoted the migration and invasion of HCC cells.
Figure 7. IL-8-activated TAMs promoted tumor invasion by accelerating EMT of HCC cells in a non-membrane-bound manner. a. The wound-closure rate at 24 h or 48 h of the Hep3B+TAM group was higher than that of the Hep3B+THP-1 or Hep3B group. b. The effect of TAMs on the migration of HepG2 cells was in correspondence with the result of Hep3B cells. c. The numbers of invasive Hep3B cells in the Hep3B+TAM group increased compared to the other groups. d. The effect of TAMs on the invasion function of HepG2 cells was in correspondence with that of Hep3B cells. E. The mRNA and protein expression levels of N-cadherin and β-catenin increased, and those of E-cadherin decreased in the Hep3B+TAM group compared to the other groups. The protein levels of the transcription factors Snail and Slug increased in the Hep3B+TAM group. f. The mRNA and protein expression levels of N-cadherin, β-catenin, Snail, and Slug increased, whereas that of E-cadherin decreased in the HepG2+TAM group compared to the other groups. g. Hep3Bwt cells were co-cultured with THP-1 cells in Transwell plates to avoid direct cell-cell contact. Similar tendency of the EMT markers was detected as co-culture system. h. Same result was obtained in HepG2wt cells, which IL-8-activated TAMs promoted tumor invasion by accelerating EMT of HCC cells in non-membrane-bound manner.
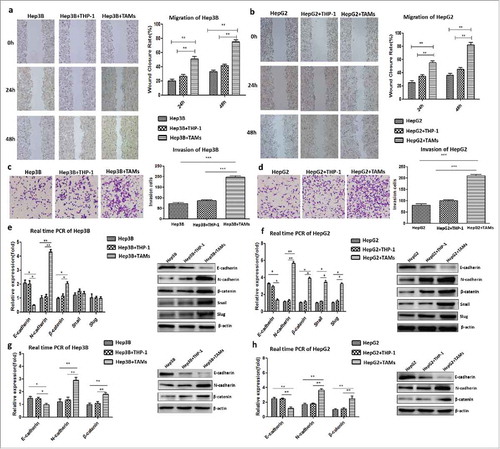
Therefore, we next compared the expression of key EMT-related markers in Hep3Bwt and HepG2wt cells co-cultured with variably treated THP-1 cells. The expression of both N-cadherin and β–catenin increased, whereas that of E-cadherin decreased at both the mRNA and protein levels in either the Hep3B+TAMs group or HepG2+TAMs group compared to other groups (P < 0.001, , ). The increase in transcription factors Snail and Slug at the protein levels was detected both in the Hep3B+TAMs group and the HepG2+TAMs group (, ). However, at the mRNA level, a comparable increase in Snail and Slug was detected only in the HepG2+TAMs group as compare to Hep3B+TAMs group. These results suggest that IL-8-activated TAMs promote tumor invasion by inducing the EMT of HCC cells.
Both Hep3Bwt and HepG2wt cells were co-cultured with variably treated THP-1 cells in Transwell plates to determine if this effect is mediated in a membrane-bound manner. An equivalent ascending expression of N-cadherin and β-catenin and a descending expression of E-cadherin were found at both the mRNA and protein levels in either the Hep3B+TAMs group or HepG2+TAMs group compared to other groups (P < 0.001, ), which indicated that IL-8-activated TAMs promoted tumor invasion by accelerating the EMT of HCC cells in non-membrane-bound manner.
Blocking the NTS/IL-8 pathway effectively inhibited the growth and metastasis of HCC xenografts in vivo
HCC xenograft-bearing mouse models were established by injecting NTS-treated HepG2 cells in NOD-SCID mice to investigate the anti-tumor effects of SR48692 or reparixin in vivo. After the xenograft-bearing mouse models were established, SR48692 or reparixin was administered to the mice for 14 days and 21 days, respectively. The mice were sacrificed after tumor formation at 5 weeks, and the metastatic nodules in the lungs were collected for HE staining.
Although no significant difference in body weight was found among variably treated mice and controls, the tumor size substantially shrank in the reparixin group compared to the control group (P < 0.01, ). In the control group, 80% (4/5) of the mice developed lung metastases, whereas only 40% (2/5) of the mice in the SR48692 group and 20% (1/5) of those in the reparixin group developed lung metastases. Accordingly, the numbers of metastatic nodules in the SR48692 and reparixin treatment groups were comparably lower than those of the controls (5.68 ± 1.45 vs. 57.67 ± 2.34, P < 0.001; 6.67 ± 5.62 vs. 57.67 ± 2.34, P = 0.002; ).
Figure 8. Blocking the NTS/IL-8 signaling pathway inhibited HCC development and metastasis in vivo. a. The tumor size substantially shrunk in reparixin group compared to control group, but no significant difference was found in SR48692 group compared to the controls. b. The tumor size shrunk in reparixin group and SR48692+reparixin group compared to the controls. No significant difference was observed between reparixin group and SR48692+reparixin group. c. The numbers of lung metastatic nodules decreased after SR48692, reparixin or combination treatment. And the number of metastasis nodules in SR48692+reparixin group was lower than that in reparixin group d. EMT markers were analyzed among three groups, and significantly reduced expression levels of N-cadherin and β-catenin proteins was found in primary tumor tissues after SR48692, reparixin or combination treatment.
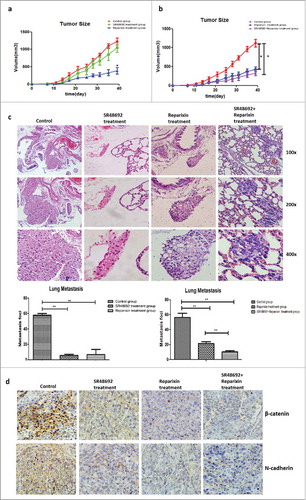
Next, we compared the anti-tumor effects of reparixin and SR48692+reperaxin. No significant difference in body weight was observed among 3 groups, which implied no more severe toxicity in the combination group. We found that the tumor sizes substantially shrank in the reparixin group and SR48692+reperaxin group compared to the controls, but no significant difference was observed between the reparixin group and the SR48692+reperaxin group. Simultaneously, the numbers of metastatic nodules in the reparixin group and SR48692+reperaxin group were comparably lower than those in the control group (21.25 ± 1.70 vs. 56.33 ± 5.55, P = 0.0010; 10.33 ± 1.45 vs. 56.33 ± 5.55, P = 0.0010). Moreover, the number of metastatic nodules in the SR48692+reperaxin group was lower than that in the reparixin group (10.33 ± 1.45 vs. 21.25 ± 1.70, P = 0.0060, ).
Furthermore, the expression of typical EMT markers was detected, and significantly reduced expression levels of N-cadherin and β-catenin proteins were found in primary tumor tissues after SR48692, reparixin or combination treatment compared to that in untreated controls (). These results indicated that blocking the NTS/IL-8 pathway effectively inhibited HCC growth and metastasis in vivo by significantly attenuating the EMT.
Discussion
The tumor microenvironment is essential for HCC growth and progression.Citation31 In the tumor microenvironment, cross-talk between cancer cells and immunocytes establish complicated molecular regulatory networks, which promote the invasion potential of tumor cells.Citation32,Citation33 The invasion tumor border in HCC is characterized by inflammatory and EMT-related gene sets and by the activation of proliferation-related signaling pathways, which are predictive of HCC patient survival.Citation34 These findings indicated a potential causal relationship between local inflammatory cells and tumor aggression, which warrants further research.
Our previous study conducted a whole-genomic gene expression profiling assay of 100 HCC tissue samples and distinguished three subtypes with a different clinical prognosis via unsupervised PCA (Fig. S1). The differentially expressed genes were analyzed, and related biological pathways were enriched among the three subtypes. Some inflammation or immune response-related pathways were enriched in patients with a poor outcome, with high significance (Fig. S1). These results were consistent with our previous observation in the GEO public datasets that inflammation-related pathways are highly activated in NTS+ HCC patients, displaying a shorter OS and a higher hazard risk of relapse.Citation8 Furthermore, we conducted a literature analysis using Ariadne Pathway Studio® and MedScan Reader® to graphically visualize the potential functional relationships among these differentially expressed genes and found a direct correlation between NTS and IL-8, both of which participate in the biological processes of inflammation, migration, angiogenesis, and metastasis (Fig. S2). Therefore, we propose a hypothesis that activation of the NTS/IL-8 pathway in HCC may participate in and regulate the development of the local inflammatory microenvironment, which contributes to HCC progression.
NTS-induced IL-8 production, termed the NTS/IL-8 pathway, was first identified in colorectal cancer. It is reported in the human colon cancer cell line NCM460 that the interaction between NTS and its high-affinity receptor NTR1 induces Ras-dependent ERK activation and IL-8 secretion by promoting the formation of Ras-GTP and activating Raf and the downstream MAPK cascade.Citation29,Citation35 The inhibitor of p38 MAPK SB and the inhibitor of ERK kinase PD could significantly inhibit IL-8 release in human gastric epithelial cells.Citation36 Furthermore, NF-κB activation was shown to be required during NTS-stimulated IL-8 secretion and gene transcription, which was dependent on intracellular calcium release and PKC activation.Citation37 Suppressing PKC activation markedly reduced NTS-induced IL-8 expression.Citation28 Moreover, Rho GTPase, Rac1, and Cdc42 have been reported to regulate NTS-promoted IL-8 expression in the human colonic epithelial cell line NCM460.Citation30 IL-8 was also suggested to act as an important prognostic factor in many malignant tumors.Citation38 Some studies of breast cancer and colon cancer have confirmed that IL-8 signaling can induce EMT and thus improve the aggressiveness of tumors.Citation39,Citation40 In addition, IL-8 has been shown to induce angiogenesis and promote tumor progression in numerous human cancers, such as prostate cancer, non-small cell lung carcinoma, melanoma, and ovarian cancer.Citation19,Citation41-Citation43
IL-8 has been found to correlate with tumor progression and distant metastasis, but few studies have focused on the correlation between NTS and IL-8 in HCC progression. The reason is that NTS is transiently expressed in the fetal liver but is hardly expressed in the mature liver and expressed at low levels in most primary HCC tissues.Citation25,Citation44 In this study, a positive correlation between NTS and IL-8 expression was found at both the mRNA and protein levels in primary HCC tissues, which was associated with a poor clinical outcome in the patients. The concordance between 2 cohorts was relatively high, but the discrepancy of mRNA and protein expression might be derived from the disparity in the sensitivity and specificity of the PCR and IHC methods. A series of genetically modified HCC cell lines were constructed to verify the actionable NTS/IL-8 pathway and elucidate the molecular regulatory mechanisms. We found that adding exogenous NTS or upregulating NTR1 dramatically increased the synthesis and secretion of IL-8, as well as the migration and invasion potential of HCC cells, which indicated that activation of the NTS/IL-8 pathway was a valuable predictor of high aggressiveness of HCC cells and an unfavorable prognosis of HCC patients.
In contrast to the regulatory signaling pathways observed in other cancer types,Citation28-Citation30,Citation35-Citation37 NTS induced IL-8 production in HCC merely via the MAPK and canonical NF-κB pathways rather than via the PKC and PI3K pathways. We found that NTS-induced activation of the MARK pathway was Ras-dependent. However, p38 might be more significant than ERK in NTS-induced activation of the MAPK pathway, compared to previous studies in colorectal cancer.Citation29 The epigenetic status of the IL-8 promoter region was also reported to regulate IL-8 production in HCC, in which PROX1 selectively increased the level of H3K4 me3 but reduced that of H3K9 me3 in the IL-8 promoter region.Citation45 However, we did not find a significant change in the methylation status of the IL-8 promoter region during the activation of the NTS/IL-8 pathway, which implied that epigenetic regulation might not participate in NTS-induced IL-8 production.
We also found that the co-expression of NTS and IL-8 was associated with enhanced tumor EMT in primary HCC tissues. In the variable HCC cell lines, activation of the NTS/IL-8 pathway significantly induced EMT and promoted tumor invasion and migration in vitro. The invasion and migration of HCC cell lines could be significantly inhibited upon blocking NTR1 or IL-8 receptors CXCR1/2, as well as suppressing the MAPK or NF-κB pathway, along with the apparent attenuation of EMT features. In HCC xenograft-bearing mouse models, blocking the NTS/IL-8 pathway by administering specific inhibitors against NTR1 or CXCR1/2 or both of them effectively inhibited HCC growth and metastasis in vivo. Collectively, these results imply that NTS-induced tumor-derived IL-8 significantly enhances HCC invasion and migration by directly inducing EMT and that inhibiting the NTS/IL-8 pathway could effectively hamper the growth and metastasis of HCC in vivo.
IL-8 was originally known as a leukocyte chemoattractant, which recruited neutrophils and macrophages to the tumor site in a paracrine fashion.Citation17,Citation46 However, many other cytokines, such as IL-17 and CXCL1, also had the capacity of attracting neutrophils in situ.Citation47,Citation48 Therefore, what is the difference? As we know, TAMs are categorized into two extreme subsets, classically activated (M1) and alternatively activated (M2) macrophages, based on their distinct functional abilities in response to stimuli in the microenvironment, among which M2-polarized TAMs are considered to promote tumor progression and predict a poor clinical outcome.Citation49 We found that tumor-derived IL-8 could promote the M2 polarization of TAMs by promoting a phenotypic switch and phagocytosis during recruitment, and IL-8-activated TAMs promote tumor invasion by accelerating the EMT of HCC cells in a non-membrane-bound manner. These results are consistent with previous studies of pancreatic cancer, oral squamous cell carcinoma, and thyroid papillary cancer.Citation50-Citation52 Our research proposed a novel NTS/IL-8 pathway-dependent tumor-oriented positive feedback loop during the cross-talk between cancer cells and inflammatory cells, which orchestrated the local inflammatory response and tumor invasion effectively in HCC. However, further studies should be conducted to investigate the specificity and efficiency of the above pathway.
In conclusion, the results of the current study further confirm that the NTS/IL-8 pathway is aberrantly activated in HCC at both the cell and tissue levels, which promotes the invasion and metastasis potential of HCC cells by enhancing tumor EMT and thus contributes to a poor clinical outcome in HCC patients. Furthermore, an upregulated EMT of HCC cells induced by the NTS/IL-8 pathway is further enhanced by a positive feedback loop of IL-8-activated M2 TAMs, which lead to a significant increase in the tumor invasion and metastasis capacity in a non-membrane-bound manner. Therefore, the cross-talk between cancer cells and immunocytes and the re-education of immunocytes in the HCC microenvironment make up a constantly strengthening loop that plays an important role in the progression of carcinoma cells. Thus, blocking the NTS/IL-8 pathway may not only decrease the malignant features of the tumor cells but also cut off the feedback loop, redress local immune suppression, and slow down or even reverse the process of tumor progression.
Materials and methods
Patient information
A total of 100 patients with primary HCC who were treated with partial liver resection surgery were enrolled for the study at the Department of Hepatology of Tianjin Medical University Cancer Institute and Hospital between 2003 and 2009. All HCC tissue and corresponding normal adjacent tissue samples of these 100 patients were collected and immediately fixed with formalin after surgical removal for protein expression analysis. The 100-patient cohort used for IHC in this study included both the previously reportedCitation8 64 patients and 36 newly enrolled patients. Among these HCC patients, 71 cases of fresh tumor tissues were collected simultaneously for RNA isolation and further analysis of mRNA expression. However, the 71 mRNA samples for microarray analysis in this manuscript had no relationship with the 10 tumor samples in the previous publication.Citation8 The information on these 100 HCC patients (93 males and 7 females with a median age of 54 years) was collected and is listed in . The postoperative follow-up time was 40-65 months. This project was approved by the Ethics Committee of Tianjin Medical University. All experiments were performed in accordance with the principles of the Helsinki Declaration of 1975, and written consent was obtained from all patients.
Table 1. The basic clinical-pathological information of 100 HCC patients.
Table 2. The correlation between NTS/IL-8 co-expression and multiple clinical-pathological features of HCC patients at both mRNA and protein levels.
Genome-wide gene expression profiling analysis
Total RNA was extracted from the cancer tissues and adjacent normal tissues using the RNeasy Mini Kit (Qiagen, Valencia, CA, USA) following the manufacturer's protocol. The concentration and purity of RNA were analyzed by spectrophotometry (Nanodrop8000, Thermo Scientific, Waltham, MA, USA). Then, RNA (250 ng) was reverse-transcribed into cDNA using a GeneChip 39 IVT Express Kit (Affymetrix, Santa Clara, CA, USA) and purified using the BioMek Fx workstation (Beckman Coulter, CA, USA). The purified cDNA was fragmented into 35 200-nt-long fragments and hybridized to the GeneChip Human Genome U133 Plus 2.0 microarray chips (Affymetrix) using standard protocols. The chips were washed in the GeneChip Fluidics Station (Affymetrix) and subsequently scanned using the GeneChip Scanner 3000 (Affymetrix). Raw data were obtained using the GCOS software and analyzed using R2.9.0 software and Bioconductor 2.4. At the mRNA level, we defined the log FC value as the cut-offs for both genes, which was 2.49 for NTS and 5.20 for IL-8. When the value was higher than the cutoff, we grouped the samples into a high expression group; otherwise, the samples were grouped into a low expression group.
Cell lines and PBMCs
The human HCC lines Hep3B, HepG2 and the human promyelocytic leukemia cell line THP-1 were obtained from the Chinese Academy of Medical Sciences. The lentivirus plasmids pLVX-IRES-Puro and packaging plasmids (pSPAX2 and pMD2G) were purchased from Clontech (Mountain View, CA, USA). Escherichia coli DH5α competent cells were purchased from Invitrogen (Grand Island, NY, USA). PBMCs and PMNs were isolated from healthy donors using Ficoll separation liquid. The middle layer was considered to be the PBMCs, and the cells of the lower layer were split using red blood cell lysis and considered to be the PMNs. The purity of the PMNs was detected by flow cytometry to be approximately 90%.
Cell culture
Hep3B and HepG2 cells were maintained in a 37° C, 5% CO2 humidified chamber in FBS/Dulbecco's modified Eagle's medium (DMEM) (Gibco BRL, Grand Island, NY, USA). THP-1 cells and isolated PBMCs and PMNs were cultured in RPMI-1640 medium (Gibco BRL, Grand Island, NY, USA) supplemented with 10% FBS. Genetically modified HCC cell lines, including Hep3BNTR1hi and HepG2NTR1− cells, were established according to our previous method.Citation9 HCC cells were incubated with NTS, SR48692, SP600125, PD98059, SB203580 and BAY117082 at 37°C for 24 h at concentrations of 1 μg/mL, 10 nM, 25 μM, 10 μM, 10 μM, and 10 μM, respectively. THP-1 cells were incubated with IL-8 at 37°C for 72 h at 5 ng/mL, which were considered to be the TAMs. Then, the HCC cells were incubated with TAMs for 72 h.
Immunohistochemistry
All samples were incubated overnight at 4°C with mouse anti-IL-8 (1:300, Abcam 807), E-cadherin (1:100, Santa Cruz 5F133), N-cadherin (1:200, Santa Cruz 13A9), Vimentin (1:200, Santa Cruz 3CB2), MMP9 (1:200, Santa Cruz 2C3), CD68(1:300, Santa Cruz KP1) and CD163(1:300, Santa Cruz RM3/1), rabbit anti-β-catenin (1:400, Abcam SP328), CD31 (1:400, Abcam RM0032-1D12), VEGF (1:200, Santa Cruz RM0008-6E72), CD66b(1:150, Abcam) and NTS (1:200, Enzo Life Sciences), and a biotinylated secondary antibody goat anti-mouse or rabbit IgG (Santa Cruz Biotech, Dallas, TX, USA) labeled with streptavidin-horseradish peroxidase (HRP) using a DAB staining kit (Maixin Biotechnology, Fuzhou, China) according to the manufacturer's instructions. We have selected the positive controls for each marker according to the manual instructions or published papers (Fig. S3a-3b). For negative controls, mouse or rabbit isotype IgG1 were used to substitute each primary antibody in the IHC staining. Cells stained brownish yellow in the cell membrane or in the cytoplasm were regarded as positive. The stained tissue sections were then digitally scanned on an Olympus BX51 microscope for image acquisition at 400 × magnification. A standard semi-quantitative double scoring system was applied to evaluate the intensity and proportion of positive cells from staining for NTS, IL-8, E-cadherin, N-cadherin, β-catenin, Vimentin, MMP9 and VEGF. Both the intensity and proportion of positive cells were scored from 0 to 3, and for each sample, both scores were added together to obtain a final score. When the final score was less than 3, the samples were grouped as negative expression; otherwise, the samples were grouped as positive expression. Regarding CD68, CD163 and CD66b, positively stained cells were counted in 5 fields at 200 × magnification, and the sum of the cells was calculated as positive cell counts.
Real-time quantitative reverse transcription-polymerase chain reaction (RT-PCR)
Total RNA was extracted using Trizol extraction according to the manufacturer's instructions. The cDNA was obtained for reverse transcription using a SYBR Prime Script™ RT-PCR kit (Takara Biochemicals, Tokyo, Japan). The PCR reactions were performed on a 7500 RT-PCR System (Applied Biosystems, Foster City, CA, USA). We chose β-actin as an internal control. Relative expression was calculated by employing the ΔΔ cycle threshold (Ct) method with the following formula: Ratio = 2 −ΔΔCt = 2 − [ΔCt (sample) − ΔCt (calibrator)]. The experiments were independently repeated three times. The primers are listed in .
Table 3. The RT-PCR primers of interested genes.
Western blot analysis
Approximately 30 µg of the total protein of each group was resolved by sodium dodecyl sulfate-polyacrylamide gel electrophoresis and transferred to a polyvinylidene fluoride membrane. The membranes were incubated with the primary antibody (dilution 1:1000) overnight at 4°C. The primary antibodies were as follows: rabbit anti-human antibodies against JNK, p-JNK, ERK, p-ERK, P38, p-P38, PKC, p-PKC, PI3K, p-PI3K, p-IκB, P65, p-P65, β-catenin, N-cadherin, Snail, Slug (Cell Signaling Technology, USA); and mouse anti-human antibodies against E-cadherin, IκB, and β-actin (Cell Signaling Technology, USA). The membranes were incubated with the secondary antibodies, which were mouse or rabbit human antibodies (1:4000, Santa Cruz Biotech) at room temperature for 1 h. The membranes were exposed using an enhanced chemiluminescence reagent (Chemicon International, USA). Ras activity was measured using a Ras Activation Assay Kit (Cell Signaling Technology, USA) following the manufacturer's instructions.Citation53,Citation54
Enzyme-linked immunosorbent assays (ELISA)
The cells were treated as described above, and the supernatants were harvested to measure the levels of IL-8, IL-10, IL-12, TGF-β, CCL2, CCL3, and VEGF using commercially available ELISA kits according to the manufacturer's instructions (Dakewe, Beijing, China). Furthermore, the members of the canonical NF-κB pathway were tested by the TransAM™ Flexi NF-κB Family Transcription Factor Assay Kit (Active Motif, USA), following the manufacturer's instructions.
Proliferation assay
The proliferation of cells was compared through a Cell Counting Kit-8 (CCK-8) assay (Dojindo Molecular Technologies, Rockville, MD, USA) in accordance with the manufacturer's instructions. In brief, the control and treatment cells were seeded at a density of 5 × 10⁴ cells/well in 96-well cell culture clusters and cultured for 24 h, 48 h, and 72 h, respectively. After adding 10 µL CCK-8 solution to each well, the absorbance was detected at 450 nm after 1-4 h with an enzyme-labeled instrument.
Apoptosis assay
The apoptotic ratios of cells were determined using an Annexin V-fluorescein isothiocyanate (FITC) apoptosis detection kit (BD Biosciences, San Jose, CA, USA). After 12 h of starvation treatment, the cells were collected and washed twice with cold phosphate-buffered saline (PBS) buffer, resuspended in 100 µL of binding buffer, incubated with 5 µL of FITC-labeled Annexin V and 5 µL of propidium iodide for 15 min at room temperature, and then analyzed through flow cytometry. The dimethyl sulfoxide (DMSO)-treated cells were used as a negative control.
Flow cytometry
THP-1 cells were collected and washed three times with PBS buffer, resuspended in 100 μL of PBS, incubated with 5 μL of PerCP-labeled mouse anti-human CD68, APC-labeled mouse anti-human CD206, PE-labeled mouse anti-human CD163, or PE-cy7-labeled rabbit anti-human CCR7 for 30 min at 4°C. After 30 min, all cells were washed once with PBS, and then analyzed through flow cytometry.
Wound-healing assay
The cells were allowed to grow to confluence and cultured in serum-free medium for 12 h prior to being scratched with a sterile pipette tip. The cells were washed twice with PBS to remove cell debris and then cultured for the next 24 h and 48 h. The migration rate was quantified and analyzed by measuring the distance between the wound edges with the use of the IPP 6.0 system at 100 × magnification. This assay was independently repeated three times. Independent duplicates were measured in the same manner, and the wound-closure rate was calculated as {1 − [(wound area) / (original wound area)]} from photographs acquired at 24 h and 48 h.
Transwell assay
The invasion assay and chemotaxis assay were performed with 24-Transwell chambers (BD Biosciences, San Jose, CA, USA). In brief, 2 × 10⁴ cells were harvested and resuspended in 200 μL serum-free DMEM before being plated in the upper chamber. The lower chamber of the Transwell was filled with 500 μL DMEM supplemented with 10% FBS. The cell suspension was applied onto the Matrigel membrane and incubated at 37°C for 48 h. The cell suspension of the chemotaxis assay was directly applied onto the membrane. For PMNs, we used CytoSelect™ 24-well chambers (CELL BIOLABS, San Diego, CA, USA) according to the manufacturer's instructions. The cells passed through the Matrigel, and the filter was fixed with 4% paraformaldehyde, stained with 0.01% crystal violet, washed with PBS, and counted under microscopy. For PMNs, the fluorescence was detected at 480 nm/520 nm with a fluorescence plate reader. All experiments were repeated three times.
Phagocytosis assay
THP-1 cells were spread onto 6-well plates at 5 × 10⁴ cells/mL, 5 ng/mL IL-8 or PBS (negative control) was added to each well, and the plates were incubated at 37°C, 5% CO2 for 72 h. A549 cells at 5 × 10⁴ cells/mL were labeled with CSFE for 2 h at a final concentration of 10 nmol/mL. A549 cells and macrophages were co-cultured, and the phagocytosis ability of macrophages was observed using a live cell station. The phagocytosis was determined by the macrophage phagocytosis index, namely, the number of tumor cells per 100 macrophages.
Animal model
HepG2 cells were pretreated with 1 μg/mL NTS for 48 h to fully activate the NTS/IL-8 pathway and produce comparable amounts of IL-8 and then subcutaneously inoculated in NOD-SCID mice at a dose of 1 × 10⁶ cells/100 μL per mouse. When the mass was developed after 7 d, SR48692 or reparixin or SR48692 + reparixin was administered to the mice. SR48692 was inoculated (100 μL) intraperitoneally at a concentration of 5 mg/kg in the mice daily for 14 days, and reparixin was inoculated (100 μL) intraperitoneally at a concentration of 15 mg/kg into the mice daily for 21 days. The control group was treated with blank PBS containing 10% (v/v) DMSO. The mice were weighed twice a week after the tumor was implanted. The tumor volume was evaluated through caliper measurements and calculated in accordance with the following ellipsoid formula: volume = tumor length × widthCitation2 × 0.5. The mice were sacrificed 5 weeks after the tumor was formed. The mouse lungs were resected and embedded in paraffin, in which the micro-metastases were counted under a microscope. The mouse tumors were also resected and embedded in paraffin for the next EMT-associated IHC. The experiment was approved by the Ethics Committee for Animal Experiments of the Tianjin Medical University Cancer Hospital and Institute and was performed in accordance with the Guide for the Care and Use of Laboratory Animals.
Statistical analysis
SPSS 17.0 statistical software was used for data analysis. The measurement data are presented as the median (interquartile range) and were compared by χ2 tests. The quantitative data are presented as the mean ± SD and compared through one-way analysis of variance (ANOVA) and least significant difference (LSD) tests. Spearman's rank-order test and linear regression analysis were performed to assess the correlations of protein levels between groups. The cumulative survival was determined by the Kaplan-Meier method, and the log-rank test was employed for univariate survival analysis between different protein markers and the OS of HCC patients.
Disclosure of potential conflicts of interest
The authors declare that there are no conflicts of interest.
supp_data.zip
Download Zip (10.7 MB)Additional information
Funding
References
- Torre LA, Bray F, Siegel RL, Ferlay J, Lortet-Tieulent J, Jemal A. Global cancer statistics, 2012. CA Cancer J Clin. 2015;65:87–108. doi:10.3322/caac.21262. PMID:25651787.
- Chen S, Dong Z, Yang P, Wang X, Jin G, Yu H, Chen L, Li L, Tang L, Bai S et al. Hepatitis B virus X protein stimulates high mobility group box 1 secretion and enhances hepatocellular carcinoma metastasis. Cancer Lett. 2017;394:22–32. doi:10.1016/j.canlet.2017.02.011. PMID:28216372.
- Cheng S, Zhang B, Du JY, Jin YH, Lang HY, Zeng LH. Hepatitis B Surface Antigen Promotes the Invasion of Hepatitis B Virus-Related Hepatocellular Carcinoma Cells by Upregulation of Toll-Like Receptor 2. Viral Immunol. 2017;30:232–9. doi:10.1089/vim.2016.0162. PMID:28061318.
- Hoyer D, Bartfai T. Neuropeptides and neuropeptide receptors: Drug targets, and peptide and non-peptide ligands: a tribute to Prof. Dieter Seebach. Chem Biodivers. 2012;9:2367–87. doi:10.1002/cbdv.201200288. PMID:23161624.
- Chandrasekharan B, Nezami BG, Srinivasan S. Emerging neuropeptide targets in inflammation: NPY and VIP. Am J Physiol Gastrointest Liver Physiol. 2013;304:G949–57. doi:10.1152/ajpgi.00493.2012. PMID:23538492.
- Munoz M, Covenas R. Involvement of substance P and the NK-1 receptor in human pathology. Amino Acids 2014;46:1727–50. doi:10.1007/s00726-014-1736-9. PMID:24705689.
- Moreira de Macedo S, Guimaraes TA, Feltenberger JD, Sousa Santos SH. The role of renin-angiotensin system modulation on treatment and prevention of liver diseases. Peptides 2014;62:189–96. doi:10.1016/j.peptides.2014.10.005. PMID:25453980.
- Yu J, Ren X, Chen Y, Liu P, Wei X, Li H, Ying G, Chen K, Winkler H, Hao X. Dysfunctional activation of neurotensin/IL-8 pathway in hepatocellular carcinoma is associated with increased inflammatory response in microenvironment, more epithelial mesenchymal transition in cancer and worse prognosis in patients. PLoS One 2013;8:e56069. doi:10.1371/journal.pone.0056069. PMID:23418512.
- Ye Y, Long X, Zhang L, Chen J, Liu P, Li H, Wei F, Yu W, Ren X, Yu J. NTS/NTR1 co-expression enhances epithelial-to-mesenchymal transition and promotes tumor metastasis by activating the Wnt/beta-catenin signaling pathway in hepatocellular carcinoma. Oncotarget 2016;7:70303–22. doi:10.18632/oncotarget.11854. PMID:27611941.
- Carraway R, Leeman SE. The isolation of a new hypotensive peptide, neurotensin, from bovine hypothalami. J Biol Chem 1973;248:6854–61. PMID:4745447.
- Kleczkowska P, Lipkowski AW. Neurotensin and neurotensin receptors: characteristic, structure-activity relationship and pain modulation–a review. Eur J Pharmacol. 2013;716:54–60. doi:10.1016/j.ejphar.2013.03.004. PMID:23500196.
- Li J, Song J, Zaytseva YY, Liu Y, Rychahou P, Jiang K, Starr ME, Kim JT, Harris JW, Yiannikouris FB et al. An obligatory role for neurotensin in high-fat-diet-induced obesity. Nature 2016;533:411–5. doi:10.1038/nature17662. PMID:27193687.
- Cross AS, Azzopardi JG, Krausz T, van Noorden S, Polak JM. A morphological and immunocytochemical study of a distinctive variant of ductal carcinoma in-situ of the breast. Histopathology 1985;9:21–37. PMID:2579885.
- Myers RM, Shearman JW, Kitching MO, Ramos-Montoya A, Neal DE, Ley SV. Cancer, chemistry, and the cell: molecules that interact with the neurotensin receptors. ACS Chem Biol. 2009;4:503–25. doi:10.1021/cb900038e. PMID:19462983.
- Morgat C, Mishra AK, Varshney R, Allard M, Fernandez P, Hindie E. Targeting neuropeptide receptors for cancer imaging and therapy: perspectives with bombesin, neurotensin, and neuropeptide-Y receptors. J Nucl Med. 2014;55:1650–7. doi:10.2967/jnumed.114.142000. PMID:25189338.
- Zhao D, Pothoulakis C. Effects of NT on gastrointestinal motility and secretion, and role in intestinal inflammation. Peptides 2006;27:2434–44. doi:10.1016/j.peptides.2005.12.016. PMID:16872719.
- Matsushima K, Baldwin ET, Mukaida N. Interleukin-8 and MCAF: Novel leukocyte recruitment and activating cytokines. Chem Immunol. 1992;51:236–65. PMID:1567543.
- Gabellini C, Trisciuoglio D, Desideri M, Candiloro A, Ragazzoni Y, Orlandi A, Zupi G, Del Bufalo D. Functional activity of CXCL8 receptors, CXCR1 and CXCR2, on human malignant melanoma progression. Eur J Cancer 2009;45:2618–27. doi:10.1016/j.ejca.2009.07.007. PMID:19683430.
- Shahzad MM, Arevalo JM, Armaiz-Pena GN, Lu C, Stone RL, Moreno-Smith M, Nishimura M, Lee JW, Jennings NB, Bottsford-Miller J, et al. Stress effects on FosB- and interleukin-8 (IL8)-driven ovarian cancer growth and metastasis. J Biol Chem 2010;285:35462–70. doi:10.1074/jbc.M110.109579. PMID:20826776.
- Zhou N, Lu F, Liu C, Xu K, Huang J, Yu D, Bi L. IL-8 induces the epithelial-mesenchymal transition of renal cell carcinoma cells through the activation of AKT signaling. Oncol Lett. 2016;12:1915–20. doi:10.3892/ol.2016.4900. PMID:27588140.
- Wang L, Tang C, Cao H, Li K, Pang X, Zhong L, Dang W, Tang H, Huang Y, Wei L, et al. Activation of IL-8 via PI3K/Akt-dependent pathway is involved in leptin-mediated epithelial-mesenchymal transition in human breast cancer cells. Cancer Biol Ther. 2015;16:1220–30. doi:10.1080/15384047.2015.1056409. PMID:26121010.
- Kalluri R, Weinberg RA. The basics of epithelial-mesenchymal transition. J Clin Invest. 2009;119:1420–8. doi:10.1172/JCI39104. PMID:19487818.
- Hwang WL, Yang MH, Tsai ML, Lan HY, Su SH, Chang SC, Teng HW, Yang SH, Lan YT, Chiou SH, et al. SNAIL regulates interleukin-8 expression, stem cell-like activity, and tumorigenicity of human colorectal carcinoma cells. Gastroenterology 2011;141:279–91, 91 e1-5. doi:10.1053/j.gastro.2011.04.008. PMID:21640118.
- Zhu B, Lin N, Zhang M, Zhu Y, Cheng H, Chen S, Ling Y, Pan W, Xu R. Activated hepatic stellate cells promote angiogenesis via interleukin-8 in hepatocellular carcinoma. J Transl Med. 2015;13:365. doi:10.1186/s12967-015-0730-7. PMID:26593962.
- Li XP, Yang XY, Biskup E, Zhou J, Li HL, Wu YF, Chen ML, Xu F. Co-expression of CXCL8 and HIF-1alpha is associated with metastasis and poor prognosis in hepatocellular carcinoma. Oncotarget 2015;6:22880–9. doi:10.18632/oncotarget.4412. PMID:26078356.
- Kim SS, Cho HJ, Won JH, Bae JI, Kang DR, Lee JD, Shin SJ, Lee KM, Yoo BM, Kim JK et al. Interleukin-8 level as a prognostic marker in patients with hepatitis B virus-associated hepatocellular carcinoma treated with transarterial chemoembolization. Cytokine 2015; 76:449–57. doi:10.1016/j.cyto.2015.07.001. PMID:26163999.
- Zhang Z-M, Lai ECH, Zhang C, Yu H-W, Liu Z, Wan B-J, Liu L-M, Tian Z-H, Deng H, Sun Q-H, et al. The strategies for treating primary hepatocellular carcinoma with portal vein tumor thrombus. International Journal of Surgery 2015;20:8–16. doi:10.1016/j.ijsu.2015.05.009
- Carraway RE, Hassan S, Dobner PR. Protein kinase C inhibitors alter neurotensin receptor binding and function in prostate cancer PC3 cells. Regul Pept. 2008;147:96–109. doi:10.1016/j.regpep.2008.01.009. PMID:18313772.
- Zhao D, Keates AC, Kuhnt-Moore S, Moyer MP, Kelly CP, Pothoulakis C. Signal transduction pathways mediating neurotensin-stimulated interleukin-8 expression in human colonocytes. J Biol Chem. 2001;276:44464–71. doi:10.1074/jbc.M104942200. PMID:11574537.
- Zhao D, Kuhnt-Moore S, Zeng H, Wu JS, Moyer MP, Pothoulakis C. Neurotensin stimulates IL-8 expression in human colonic epithelial cells through Rho GTPase-mediated NF-kappa B pathways. Am J Physiol Cell Physiol. 2003;284:C1397–404. doi:10.1152/ajpcell.00328.2002. PMID:12584113.
- Tahmasebi Birgani M, Carloni V. Tumor Microenvironment, a Paradigm in Hepatocellular Carcinoma Progression and Therapy. Int J Mol Sci. 2017;18. pii:E405. doi:10.3390/ijms18020405. PMID:28216578.
- Schreiber RD, Old LJ, Smyth MJ. Cancer immunoediting: Integrating immunity's roles in cancer suppression and promotion. Science 2011;331:1565–70. doi:10.1126/science.1203486. PMID:21436444.
- Croci DO, Zacarias Fluck MF, Rico MJ, Matar P, Rabinovich GA, Scharovsky OG. Dynamic cross-talk between tumor and immune cells in orchestrating the immunosuppressive network at the tumor microenvironment. Cancer Immunol Immunother 2007;56:1687–700. doi:10.1007/s00262-007-0343-y. PMID:17571260.
- Castven D, Fischer M, Becker D, Heinrich S, Andersen JB, Strand D, Sprinzl MF, Strand S, Czauderna C, Heilmann-Heimbach S, et al. Adverse genomic alterations and stemness features are induced by field cancerization in the microenvironment of hepatocellular carcinomas. Oncotarget 2017;8:48688–48700; doi:10.18632/oncotarget.16231. PMID:28415775.
- Warny M, Keates AC, Keates S, Castagliuolo I, Zacks JK, Aboudola S, Qamar A, Pothoulakis C, LaMont JT, Kelly CP. p38 MAP kinase activation by Clostridium difficile toxin A mediates monocyte necrosis, IL-8 production, and enteritis. J Clin Invest. 2000;105:1147–56. doi:10.1172/JCI7545. PMID:10772660.
- Hsieh YH, Wu TT, Huang CY, Hsieh YS, Hwang JM, Liu JY. p38 mitogen-activated protein kinase pathway is involved in protein kinase Calpha-regulated invasion in human hepatocellular carcinoma cells. Cancer Res 2007;67:4320–7. doi:10.1158/0008-5472.CAN-06-2486. PMID:17483345.
- Zhao D, Zhan Y, Zeng H, Koon HW, Moyer MP, Pothoulakis C. Neurotensin stimulates interleukin-8 expression through modulation of I kappa B alpha phosphorylation and p65 transcriptional activity: involvement of protein kinase C alpha. Mol Pharmacol. 2005;67:2025–31. doi:10.1124/mol.104.010801. PMID:15755906.
- Shahzad A, Knapp M, Lang I, Kohler G. Interleukin 8 (IL-8) – a universal biomarker? Int Arch Med. 2010;3:11. doi:10.1186/1755-7682-3-11. PMID:20550702.
- Fernando RI, Castillo MD, Litzinger M, Hamilton DH, Palena C. IL-8 signaling plays a critical role in the epithelial-mesenchymal transition of human carcinoma cells. Cancer Res. 2011;71:5296–306. doi:10.1158/0008-5472.CAN-11-0156. PMID:21653678.
- Bates RC, DeLeo MJ 3rd, Mercurio AM. The epithelial-mesenchymal transition of colon carcinoma involves expression of IL-8 and CXCR-1-mediated chemotaxis. Exp Cell Res 2004;299:315–24. doi:10.1016/j.yexcr.2004.05.033. PMID:15350531.
- Araki S, Omori Y, Lyn D, Singh RK, Meinbach DM, Sandman Y, Lokeshwar VB, Lokeshwar BL. Interleukin-8 is a molecular determinant of androgen independence and progression in prostate cancer. Cancer Res 2007;67:6854–62. doi:10.1158/0008-5472.CAN-07-1162. PMID:17638896.
- Millar HJ, Nemeth JA, McCabe FL, Pikounis B, Wickstrom E. Circulating human interleukin-8 as an indicator of cancer progression in a nude rat orthotopic human non-small cell lung carcinoma model. Cancer Epidemiol Biomarkers Prev 2008;17:2180–7. doi:10.1158/1055-9965.EPI-07-2915. PMID:18708412.
- Rofstad EK, Halsor EF. Vascular endothelial growth factor, interleukin 8, platelet-derived endothelial cell growth factor, and basic fibroblast growth factor promote angiogenesis and metastasis in human melanoma xenografts. Cancer Res 2000;60:4932–8. PMID:10987309.
- Huang W, Chen Z, Zhang L, Tian D, Wang D, Fan D, Wu K, Xia L. Interleukin-8 Induces Expression of FOXC1 to Promote Transactivation of CXCR1 and CCL2 in Hepatocellular Carcinoma Cell Lines and Formation of Metastases in Mice. Gastroenterology 2015;149:1053-67 e14. doi:10.1053/j.gastro.2015.05.058. PMID:26065367.
- Liu Y, Zhang Y, Wang S, Dong QZ, Shen Z, Wang W, Tao S, Gu C, Liu J, Xie Y et al. Prospero-related homeobox 1 drives angiogenesis of hepatocellular carcinoma through selectively activating interleukin-8 expression. Hepatology 2017;66:1894–909. doi:10.1002/hep.29337. PMID:28646551.
- Allavena P, Germano G, Marchesi F, Mantovani A. Chemokines in cancer related inflammation. Exp Cell Res 2011;317:664–73. doi:10.1016/j.yexcr.2010.11.013. PMID:21134366.
- Li L, Xu L, Yan J, Zhen ZJ, Ji Y, Liu CQ, Lau WY, Zheng L, Xu J. CXCR2–CXCL1 axis is correlated with neutrophil infiltration and predicts a poor prognosis in hepatocellular carcinoma. Journal of Experimental & Clinical Cancer Research 2015;34:129. doi:10.1186/s13046-015-0247-1. PMID:26503598.
- Kuang DM, Zhao Q, Wu Y, Peng C, Wang J, Xu Z, Yin XY, Zheng L. Peritumoral neutrophils link inflammatory response to disease progression by fostering angiogenesis in hepatocellular carcinoma. J Hepatol 2011;54:948–55. doi:10.1016/j.jhep.2010.08.041. PMID:21145847.
- Van Overmeire E, Laoui D, Keirsse J, Van Ginderachter J, Sarukhan A. Mechanisms driving macrophage diversity and specialization in distinct tumor microenvironments and parallelisms with other tissues. Frontiers in immunology 2014;5:127. doi:10.3389/fimmu.2014.00127. PMID:24723924.
- Karnevi E, Andersson R, Rosendahl AH. Tumour-educated macrophages display a mixed polarisation and enhance pancreatic cancer cell invasion. Immunol Cell Biol 2014;92:543–52. doi:10.1038/icb.2014.22. PMID:24662521.
- Fujita Y, Okamoto M, Goda H, Tano T, Nakashiro K, Sugita A, Fujita T, Koido S, Homma S, Kawakami Y, et al. Prognostic significance of interleukin-8 and CD163-positive cell-infiltration in tumor tissues in patients with oral squamous cell carcinoma. PLoS One 2014;9:e110378. doi:10.1371/journal.pone.0110378. PMID:25461761.
- Fang W, Ye L, Shen L, Cai J, Huang F, Wei Q, Fei X, Chen X, Guan H, Wang W, et al. Tumor-associated macrophages promote the metastatic potential of thyroid papillary cancer by releasing CXCL8. Carcinogenesis 2014;35:1780–7. doi:10.1093/carcin/bgu060. PMID:24608042.
- Manchado E, Weissmueller S, Morris JPt, Chen CC, Wullenkord R, Lujambio A, de Stanchina E, Poirier JT, Gainor JF, Corcoran RB, et al. A combinatorial strategy for treating KRAS-mutant lung cancer. Nature 2016;534:647–51. doi:10.1038/nature18600. PMID:27338794.
- Hampl V, Martin C, Aigner A, Hoebel S, Singer S, Frank N, Sarikas A, Ebert O, Prywes R, Gudermann T et al. Depletion of the transcriptional coactivators megakaryoblastic leukaemia 1 and 2 abolishes hepatocellular carcinoma xenograft growth by inducing oncogene-induced senescence. EMBO molecular medicine 2013;5:1367–82. doi:10.1002/emmm.201202406. PMID:23853104.