
ABSTRACT
Interfering with tumor metabolism is an emerging strategy for treating cancers that are resistant to standard therapies. Featuring a rapid proliferation rate and exacerbated glycolysis, hepatocellular carcinoma (HCC) creates a highly hypoxic microenvironment with excessive production of lactic and carbonic acids. These metabolic conditions promote disease aggressiveness and cancer-related immunosuppression. The pH regulatory molecules work as a bridge between tumor cells and their surrounding milieu. Herein, we show that the pH regulatory molecules CAIX, CAXII and V-ATPase are overexpressed in the HCC microenvironment and that interfering with their pathways exerts antitumor activity. Importantly, the V-ATPase complex was expressed by M2-like tumor-associated macrophages. Blocking ex vivo V-ATPase activity established a less immune-suppressive tumor microenvironment and reversed the mesenchymal features of HCC. Thus, targeting the unique cross-talk between tumor cells and the tumor microenvironment played by pH regulatory molecules holds promise as a strategy to control HCC progression and to reduce the immunosuppressive pressure mediated by the hypoxic/acidic metabolism, particularly considering the potential combination of this strategy with emerging immune checkpoint-based immunotherapies.
Introduction
Hepatocellular carcinoma (HCC) is the second leading cause of cancer death worldwide.Citation1 Surgical resection and ablation, depending on tumor burden and intra-hepatic location, are the sole curative, non-transplant treatments; nevertheless, relapse occurs in approximately 70% of patients within five years,Citation2 with a dismal prognosis when eligibility criteria for salvage transplantation are not met.Citation3 Promising results are emerging with immunotherapy based on immune checkpoint inhibition,Citation4 but tumor-intrinsic and -extrinsic resistance points in metabolic and immunosuppressive pathways are the major obstacles to effective immune-mediated cancer control.Citation5
HCC is a highly hypoxic tumor due to its rapid growth rate and the surrounding fibrotic tissue produced by chronic inflammation.Citation6 In cancer cells, hypoxia is associated with metabolic reprogramming based on anaerobic glycolysis, leading to the overproduction of pyruvate, lactate and carbonic acids.Citation7 A hypoxic/acidic microenvironment is the hallmark of invasive tumors,Citation8,Citation9 the aggressiveness of which is also driven by the ability to escape adaptive immune surveillance and contribute to local inflammation.Citation10-Citation13 To cope with hypoxic stress and acidity, tumor cells overexpress different pH regulators, including carbonic anhydrase (CA) IX and XII.Citation14 CAs are zinc metalloenzymes that catalyze the reversible hydration of carbon dioxide to carbonic acid and are involved in respiration and acid-base equilibrium.Citation14 V-ATPase is also a key protein in the regulation of the tumor acidic microenvironment and is one of the most studied pH regulators in cancer.Citation15 V-ATPase consists of multiple subunits assembled in two domains: the membrane-associated domain V0 transports protons across the membrane, while the cytoplasmic domain V1 hydrolyses ATP.Citation16 Each V-ATPase subunit displays several splice variants, conferring specific intracellular localization and tissue specificity.Citation17
The main function of pH regulators is to counteract the intracellular accumulation of protons caused by tumor energy metabolic dysfunction, expelling protons into the extracellular milieu, leading in turn to its acidification.Citation14 Additionally, CAs and V-ATPase are crucial components of signal transduction cascades associated with neoplastic transformation.Citation18 Because of their pivotal role in tumor survival, pH regulators are receiving attention as promising therapeutic targets, and pharmacological strategies to disrupt their function have recently been developed and tested in early clinical trials.Citation19
In the present study, we investigated the expression and role of pH regulators in the tumor microenvironment of HCC patients, focusing on CAIX, CAXII and V-ATPase because of the availability of specific inhibitors with potential clinical use. Interestingly, we found that interfering with these pathways may represent a pleiotropic strategy to influence tumor survival, aggressiveness and the immunological properties of HCC.
Results
pH regulatory molecules are expressed in HCC
Matched tumor (T) and adjacent non-tumor (NT) snap-frozen tissues from patients with HCC undergoing curative resection (n = 57, see for the pathological features of these tumors) were profiled for the expression of CA9 and CA12, encoding for CAIX and CAXII proteins respectively, and ATP6V0A1, ATP6V1A, ATP6V1C1 and ATP6V1H encoding for the a1, A1, C1 and H subunits of the V-ATPase. These subunits were chosen for analysis because a1 contains the binding site for proton pump inhibitors (PPIs), while A1, C1 and H encompass the V1 domain involved in the regulation and stator of the whole encoded complex.Citation16 The level of HIF1A mRNA was also assessed. Given that HCC arises from chronically inflamed liver tissue, samples from normal liver obtained from patients undergoing an operation unrelated to cancer (cholecystectomy) (n = 9) were included as a control group. In line with the literature data,Citation20 qRT-PCR analysis showed that in comparison with normal liver, both NT and T tissues displayed increased transcription of the HIF1A gene. NT and T tissues also displayed an increase in the expression of CA9 mRNA (). CA9 and HIF1A expression was positively correlated both in NT and T tissues, thus highlighting the dependence of CA9 on hypoxia also in the HCC settingCitation21 (Supplementary Fig. S1). NT tissues displayed higher CA9 mRNA levels, likely due to their enrichment in bile ducts with cholangiocytes positive for CAIX.Citation22 Conversely, CA12 was strongly positive in T samples, while it was barely detectable in normal liver and NT tissues (). Concerning the V-ATPase complex, all the subunits exhibited enhanced expression in T compared with NT or normal liver, with the differences reaching statistical significance for the ATP6V1 A, ATP6V1C1 and ATP6V1 H genes ().
Table 1. The clinicopathological characteristics of HCC patients.
Figure 1. Gene expression of pH regulatory molecules in liver tissues. (A) mRNA expression levels of HIF1 A, CA9, CA12, ATP6V0A1, ATP6V1 A, ATP6V1C1 and ATP6VIH. The expression of the indicated genes was evaluated in 9 normal (N) and 57 paired samples of adjacent non-tumor (NT) and tumor (T) liver tissues (see Materials and Methods for the statistical analyses used). The data are reported as 2−ΔCt values (ΔCt = Cttarget gene–CtGAPDH). (B) High expression of CA9 and CA12 was associated with poorly differentiated HCC (G3). Gene expression data of 57 tumor tissues analyzed were reported as –ΔCt values. The reported p-values were calculated by the unpaired t test.
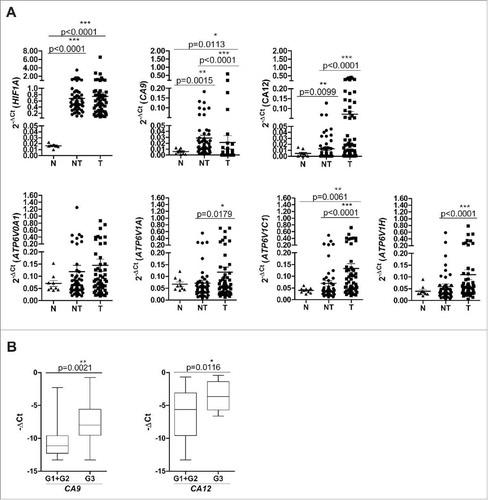
In the tumor tissues, the expression of ATP6V0A1, ATP6V1C1 and ATP6V1 H genes was positively associated, in agreement with the notion that they encode for ATPase subunits essential in the functional activity of the V-ATPase molecular complex.Citation16 No other significant correlation was found, suggesting that the CA and ATPase molecules are likely to exert non-redundant functions in HCC (Supplementary Fig. S1). Moreover, in our series, CA9 and CA12 gene expression was associated with tumor grading, thus indicating their possible role in tumor malignancy ().
Selective expression of CAIX and CAXII in HCC tumor cells
The distribution of pH regulatory molecules in the HCC microenvironment was assessed by IHC analysis performed on a set of formalin-fixed, paraffin-embedded (FFPE) pairs of T, NT and peri-tumor (PT) samples (n = 23). PT corresponds to FFPE HCC sections, which include areas enriched in immune infiltrating cells adjacent to tumor nodules.
In normal liver and NT tissues, the presence of CAIX was limited to the plasma membrane of cholangiocytes, while normal hepatocytes were completely negative for the protein (). In contrast, approximately 50% of the T samples exhibited scattered foci of HCC cells that were strongly positive for CAIX at the plasma membrane level; these cells were evenly distributed within discrete tumor nests ( and ). Conversely, CAXII was abundantly and homogeneously expressed in most tumor cells, but was largely undetectable in NT tissue and normal liver. This expression pattern was shared by all the analyzed samples ( and ). In contrast to reports using other tumor histotypes,Citation23 in the present study, CAXII was mainly confined to the cytoplasm of HCC cells. We confirmed the paucity of CAXII expression at the plasma membrane by immunofluorescence staining and confocal analysis of tumor tissue samples, revealing no detectable co-localization between CAXII and cell surface-expressed β-catenin. Interestingly, the majority of CAXII co-localized with calnexin, indicating that the protein was likely retained in the endoplasmic reticulum (ER) (). This pattern of expression was specific to HCC since breast carcinoma cells displayed conventional CAXII membranous expression and β-catenin co-localization (Supplementary Fig. S2 A and S2B). For both CAIX and CAXII, no positivity was detected in the inflammatory cells infiltrating the PT areas ().
Figure 2. Expression and cellular distribution of CAIX and CAXII in liver tissues. (A) Representative images of immunohistochemical staining for CAIX and CAXII in normal and matched non-tumor, tumor and peri-tumor liver tissues. Peri-tumor tissue was identified as areas adjacent to tumor nodules enriched in immune infiltrating cells. Membranous staining of CAIX was detectable in bile ductular cells in normal and non-tumor tissues and in malignant hepatocytes. CAXII was expressed in the cytoplasm of malignant hepatocytes. No positive staining was evident in the inflammatory cells infiltrating the peri-tumor areas. *Identifies tumor area in peri-tumor sections. Representative images with scale bars = 100 μm. (B) Confocal laser scanning micrographs of immunofluorescent staining with anti-CAXII (green), anti-β-catenin (red) and anti-calnexin (red) in formalin-fixed, paraffin-embedded HCC tissues. Nuclei were stained with Toto-3 (blue). In the left panel, CAXII displays cytoplasmic expression without any co-localization with the membranous staining of β-catenin (red). In the right panel, the white triangle indicates the co-localization of CAXII and calnexin. Scale bars = 50 μm.
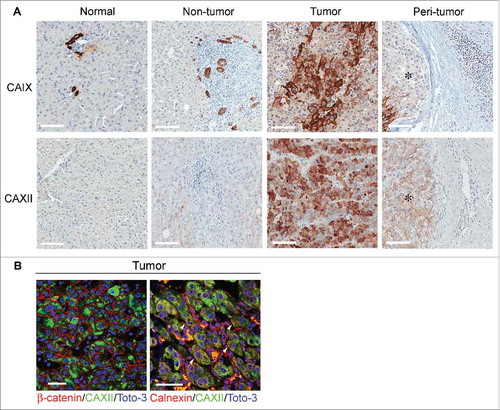
Table 2. Score categories for the expression of pH regulatory molecules and CD163 in clinical HCC tissues (n = 23) analyzed by immunohistochemistry.
Modulation of CA expression and distribution by hypoxia
HCC cell lines, representative of HCC subtypes,Citation24,Citation25 were profiled for the expression of CAs and were subsequently tested for their sensitivity to selective inhibitors. As detected by western blotting, we observed that the PLC/PRF/5 and C3A cell lines expressed CAIX under normoxia (N = 21% O2), which was significantly up-regulated upon exposure to hypoxia (H = 1% O2) for 72 h. In contrast, SNU-449 cells did not express CAIX irrespective of the culture conditions ().
Figure 3. CAIX and CAXII expression and functional inhibition in HCC cell lines. The indicated HCC cell lines were cultured under either normoxic (N = 21% O2) or hypoxic (H = 1% O2) conditions for 72 h and were analyzed as indicated below. (A) The protein expression of CAIX, CAXII and vinculin was assessed by western blotting in cell lysates of the C3A, PLC/PRF/5 and SNU-449 cell lines. The cell surface expression of CAIX (B) and CAXII (C) was evaluated by flow cytometry. The number in each histogram plot shows the percentage of cells positive for the indicated markers (filled histograms) evaluated with respect to the corresponding secondary antibody (black line). Representative histograms from three independent experiments are shown. (D) The cellular distribution of CAXII was assessed by confocal laser scanning microscopy under the indicated conditions. Representative micrographs of triple immunofluorescence staining with anti-CAXII (green), anti-WGA (red, detecting the cell membrane) and anti-calnexin (blue, detecting the ER compartment) are reported. Scale bars = 50 μm and = 5 μm for the lower and higher magnification respectively. The cell viability of the HCC cell lines treated with different doses of S4 (µM) (E) and compound 25 (µM) (F) under normoxia (N = 21% O2, black triangles) or hypoxia (H = 1% O2, white triangles) for 72 h was evaluated using the MTT assay. The data show the percentage of viable cells of the untreated control and represent the mean of six replicate reactions from 3 independent experiments. IC50 values for S4 were >100 μM for all HCC cell lines grown under normoxic conditions and 57.4, 53.9 and >100 μM for C3 A, PLC/PRF/5 and SNU-449 exposed to hypoxia respectively. For compound 25, C3 A, PLC/PRF/5 and SNU-449 cells grown under normoxia displayed IC50 values of 198.5, 142.9 and >200 μM respectively. All the HCC cell lines exposed to hypoxia displayed IC50 values >200 μM for compound 25.
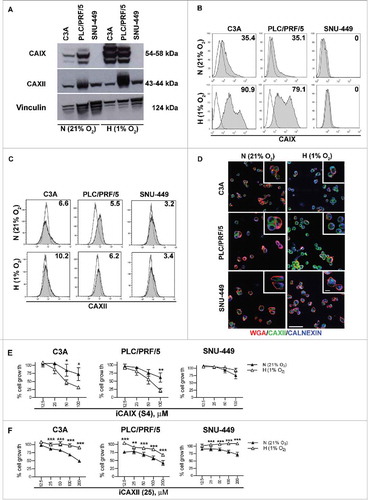
CAXII was expressed by all HCC cell lines but only up-regulated under hypoxia in the PLC/PRF/5 cell line ( and Supplementary Fig. S3). Flow cytometric analysis confirmed the membrane-bound expression of CAIX in C3A and PLC/PRF/5 cells cultured under normoxia (approximately 35% positive cells), which was markedly enhanced by 72 h of hypoxia, while the SNU-449 cell line was completely negative, consistent with the qRT-PCR data (). Conversely, all HCC cell lines grown under either 21% or 1% O2 expressed very low levels of CAXII at the cell surface (), in agreement with the expression patterns observed in HCC samples. To further explore the cellular distribution of CAXII, immunofluorescence staining of HCC cell lines was performed for CAXII (green) in combination with wheat germ agglutinin (WGA, red) and an anti-calnexin monoclonal antibody (blue) to mark the plasma membrane and ER respectively. Confocal analysis confirmed that CAXII was mainly localized in the cytoplasm when the cells were grown under normoxia, while the protein was largely retained in the ER after 72 h of hypoxia exposure, indicated by the co-staining with calnexin defined by the appearance of an azure color (). Hence, HCC cell lines reacted to hypoxia in a similar fashion to the in vivo setting, i.e., with hypoxia causing intracellular retention of CAXII, primarily localized in the ER.
Sensitivity of HCC to CA inhibitors and the consequences of sub-cellular target localization
To investigate whether pH regulators may serve as effective therapeutic targets in HCC, the effect of CA blockade on HCC cell lines was investigated by inhibiting CAIX with the specific inhibitor S4, known to exert antitumor activity in breast cancer models.Citation26,Citation27 CAXII was blocked using the inhibitor compound 25, a molecule belonging to a new series of N-substituted saccharin derivatives, displaying a KI of 0.25 µM for human CAXII while being largely inactive against other human carbonic anhydrase isoforms, including CAIX (KI >50 µM)Citation28 (Supplementary Table S1). Among the saccharin-based derivatives, compound 25 was selected for its in vitro activity in blocking the growth of the breast cancer cell line T-47D, a cell displaying membrane positivity for CAXII in the absence of CAIX expression (Supplementary Fig. S4 A and B).
The CAIX-positive HCC cell lines C3A and PLC/PRF/5 had a low sensitivity to S4 under normoxia (IC50 >100 µM), but they exhibited rapidly decreased cell viability under 1% O2 (down to 30% for C3A and 20% for PLC/PRF/5, with IC50 values of 57.4 and 53.9 respectively) (). The lack of any antitumor effect of S4 on SNU-449 cells (IC50 >100 µM), which were negative for CAIX under both normoxic and hypoxic conditions, confirmed the specificity of the drug ().
The CAXII inhibitor compound 25 was tested on the three HCC cell lines, all of which expressed CAXII. As depicted in , the drug affected the viability of HCC cells under normoxic conditions, with an IC50 of 198.5 and 142.9 µM in the C3A and PLC/PRF/5 cell lines, respectively, while the SNU-449 cells appeared rather resistant to the drug (IC50 > 200 µM). Unexpectedly, all the HCC cell lines showed a significantly decreased sensitivity to compound 25 when cultured under hypoxic conditions, with a consequential marked increase in the IC50 (> 200 μM for all cell lines) (). These data suggest that CAXII sequestration in the ER under hypoxia hampered the activity of compound 25, indicating that drug modifications or alternative pharmacological strategies need to be applied for the effective targeting of CAXII in HCC.
CA inhibitors affected HCC cell viability, and we found that blockage of CAIX activity limited the proliferative capacity of the CAIX-positive cell lines (C3A and PLC/PRF/5) and induced necrosis. However, our experiments failed to depict a clear mechanism of drug-induced cell death common to CAIX and CAXII inhibitors in the HCC cell lines (Supplementary Fig. S5). In agreement with data from the literature, the cell death pathway induced by CAs is reminiscent of the ‘metabolic catastrophe’ occurring in cancer cells upon disruption of proton dynamics and energy metabolism.Citation29
Expression of the V-ATPase complex in the HCC microenvironment
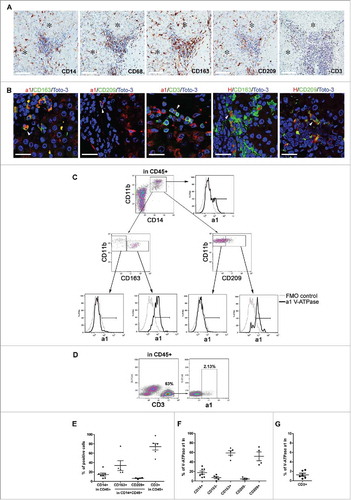
We then explored the in vivo distribution of the V-ATPase complex. IHC analyses showed selective overexpression of the V-ATPase subunits a1 and C1 in T in comparison with NT tissues and normal liver (). This pattern was detectable in approximately 90% of HCC cases, although a heterogeneous frequency of positive cells and staining intensity could be observed (). The H subunit was not detected in tumors and normal hepatocytes, as observed by the IHC staining of T and NT tissues () except for 4 HCC cases. In these samples, V-ATPase subunit H was intracellularly expressed in malignant hepatocytes, with a pattern suggesting its accumulation in the Golgi apparatus (Supplementary Fig. S6). The H subunit was detectable in cells infiltrating NT and T tissues, likely to be Kupffer cells, the liver's macrophages lining the walls of the sinusoids. Notably, in approximately half of the cases analyzed, marked expression of the V-ATPase a1 and H subunits could also be detected in the HCC inflammatory infiltrate in the PT area of the HCC samples ( and ). IHC analysis defined these immune cells as being composed of myeloid cells, expressing the CD14, CD68, CD163 and CD209 markers, and of CD3+ lymphocytes (). Confocal microscopic analysis showed that V-ATPase a1 and H were co-expressed with CD163 and CD209, known markers of M2 macrophages ( and Supplementary Fig. S7 A). In addition, a fraction of CD3+ cells were positive for the V-ATPase a1 subunit ( and Supplementary Fig. S7B), while no co-staining with the V-ATPase H subunit was detectable (data not shown). Flow cytometry analysis of cell suspensions obtained from HCC surgical specimens confirmed that myeloid cells expressing CD163 and CD209 markers were clearly present, although with different frequencies, along with the presence of CD3+ cells (). A fraction of CD14+CD11b+ cell population was V-ATPase a1 positive, and in agreement with confocal microscopy analysis, V-ATPase a1 was preferentially expressed by myeloid cells expressing the M2-associated marker CD163+ or CD209+ (, ). Flow cytometry also confirmed that a small fraction of CD3+ lymphocytes expressed V-ATPase a1 (, ).
Figure 4. Expression pattern of V-ATPase subunits in liver tissues. The immunohistochemical expression of a1, C1 and H V-ATPase subunits was evaluated in normal and matched non-tumor, tumor and peri-tumor liver tissues. Peri-tumor tissues were identified as areas adjacent to tumor nodules enriched in immune infiltrating cells. The membranous/cytoplasmic expression of a1 and C1 subunits was detected in malignant hepatocytes. The H subunit was mainly expressed in the Kupffer cells present in non-tumor and tumor tissues. The a1 and H subunits were also expressed by infiltrating immune cells in the peri-tumor areas of the liver. *Identifies a tumor area in the peri-tumor sections. Representative images with scale bars = 100 μm.
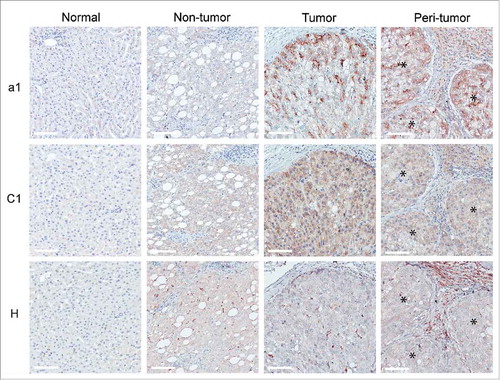
Figure 5. Expression of V-ATPase in immune cells infiltrating HCC tissues. (A) Representative images of immunohistochemical staining for the myeloid-associated markers CD14, CD68, CD163, CD209 and the CD3 T cell marker in HCC tissues. Scale bars = 100 μm are shown. *Identifies the tumor area. (B) Triple-labeled immunofluorescence staining for a1 and H1 subunits of the V-ATPase complex (red) and CD163 (green), CD209 (green) or CD3 (green) in HCC tissues. Nuclei were stained with Toto-3 (blue). White triangles indicate the co-expression of the analyzed markers. Representative images with scale bars = 25 μm. No co-staining was found for CD3 and V-ATPase H1 (data not shown). (C) Multiparametric flow cytometry analysis of live myeloid cells in cell suspensions of freshly dissociated HCC surgical specimens. The CD209 and CD163 positive population has been defined by setting the marker on the corresponding FMO control. The cell surface expression of V-ATPase a1 was evaluated within the CD14+CD11b+, CD11b+CD163−, CD11b+CD163+ CD11b+CD209− and CD11b+CD209+ cell populations and the corresponding histograms are reported (black line). FMO control is shown (gray line). (D) Multiparametric flow cytometry analysis of cell surface V-ATPase a1 expression in live CD3 cells in cell suspensions of freshly dissociated HCC tumors. V-ATPase a1 positive cells have been defined using the FMO control. (E) The graph summarizes the percentages of CD14+, CD163+, CD209+ and CD3+ cells found in the analyzed HCC samples. (F-G) The percentages of V-ATPase a1-positive cells assessed in the indicated myeloid cell populations and within the CD3+ cells for all the analyzed samples.
Pleiotropic effects of V-ATPase inhibition by omeprazole in the HCC microenvironment
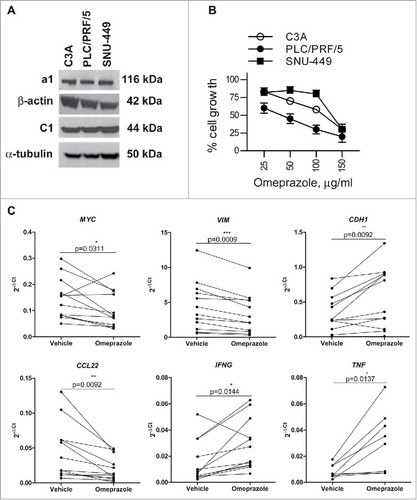
C3A, PLC/PRF/5 and SNU-449 cells displayed significant levels of the V-ATPase a1 and C1 subunits (), corroborating the expression data observed in the HCC specimens. To test the antitumor potential of V-ATPase targeting, we chose omeprazole, a selective inhibitor of proton pumps that is broadly used to block acid secretion by gastric parietal cells through inhibition of the H+/K+ ATPase system.Citation30 Omeprazole has been shown to cross-react with V-ATPase and mediate antitumor properties in a preclinical settingCitation15. As shown in , all HCC cells showed a significantly blocked growth response to omeprazole, with IC50 values ranging from 39.4 µg/ml for PLC/PRF/5 cells to 100.9 µg/ml for C3A cells. SNU-449 cells again displayed the lowest sensitivity (IC50 values of 128.4 µg/ml), in accordance with the relative resistance observed with CA inhibitors ( and ) and described for other drugs, including sorafenib.Citation31 No difference in the sensitivity to omeprazole treatment was found in hypoxic conditions for any of the HCC cell lines (Supplementary Fig. S8). These experiments suggested that omeprazole affected the proliferative capacity of all the HCC cell lines tested and induced necrosis, but the mechanisms leading to drug-induced HCC cell death remain to be elucidated, as discussed for the CA inhibitors (Supplementary Fig. S5).
Figure 6. Effects of omeprazole on HCC cell line viability and on the tumor microenvironment of HCC tissue explants. (A) The protein expression of a1, C1, β-actin and α-tubulin was assessed by western blotting in cell lysates of the C3A, PLC/PRF/5 and SNU-449 cell lines. (B) The HCC cell lines were treated with different doses of omeprazole, and cell viability was evaluated using the MTT assay. The data on the y-axes report the percentage of viable cells of the untreated control and represent the mean of six replicate reactions from 3 independent experiments. The calculated IC50 values for omeprazole are 100.9, 39.4, and 128.4 μg/ml for C3A, PLC/PRF/5 and SNU-449 respectively. (C) Expression levels of the indicated genes in HCC tissue explants (MYC, VIM, CDH1, CCL22, IFNG N = 12; TNF, N = 8) cultured ex vivo in the presence of 100 μg/ml omeprazole or the vehicle of the drug for 24 h. The gene expression data are reported as 2−ΔCt values. The p-values are calculated by the paired t test comparing cells treated with omeprazole or the vehicle.
V-ATPase was expressed not only in tumor cells but also in the infiltrating immune cells. To evaluate whether interfering with V-ATPase activity could modulate the HCC microenvironment in both the tumor and immune components, human primary HCC tissue explants (n = 12), preserving the intercellular networks of local tissue,Citation32 were cultured for 24 h with omeprazole or drug vehicle and were then analyzed for the modulated expression of selected tumor and immune genes.
MYC and VIM, expressed by tumor cells and associated with epithelial-to-mesenchymal transition (EMT),Citation33,Citation34 were down-regulated in HCC tissue explants, in parallel with increased CDH1, indicating a reduced aggressiveness of the tumor component (). Omeprazole treatment also induced a reshaping of the cyto/chemokine milieu, including a down-regulation of CCL22 and a concomitant up-regulation of the IFNG and TNF genes (). The expression of other immune genes, including CCL2 and IL6, was not consistently detectable by qRT-PCR.
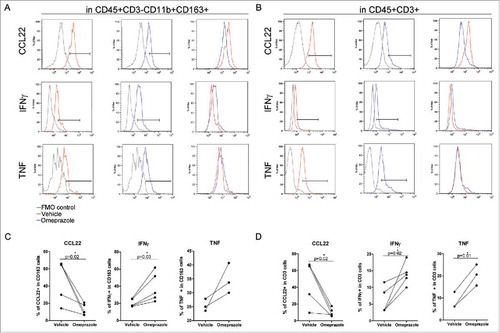
To gain further evidence of the functional role of V-ATPase in the modulation of the cytokine profile of the HCC TME and to assess whether the cytokine modulation in the HCC TME also occurred at the protein level, cell suspensions obtained from HCC surgical specimens were treated for 24 h with omeprazole or vehicle and monitored by multiparametric flow cytometry for cyto/chemokine secretion by the different immune cell subsets.. In CD11b+CD163+ myeloid cells and in CD3+ T cells, omeprazole treatment was associated with a decreased production of CCL22, paralleled by a significant increase in IFNγ and TNF Representative flow cytometry histograms are shown (, ), and cumulative data obtained from all the HCC cell suspensions are summarized (, ). Altogether, these data indicate that omeprazole promotes a rapid modulation of the HCC TME involving a relief of immunosuppression and a potential gain of a more antitumor immune profile that involved both innate and adaptive immune cells.
Figure 7. Modulation of the cytokine profile in HCC immune-infiltrating cells by omeprazole treatment. (A-D) Multiparametric flow cytometry of live cells in freshly dissociated HCC tumors treated with the drug vehicle (red line) or with omeprazole (100 μg/ml, blue line) for 24 h. IFNγ, TNF and CCL22 production was evaluated by intracellular staining (A) in CD163+ myeloid cells gated inside live CD45+CD3− cells and (B) in CD3+ T cells gated inside live CD45+ cells. FMO control for each cytokine (gray line) is reported in the histogram plot. The percentages of IFNγ-, TNF- and CCL22-positive cells in the CD163+ and in the CD3+ cells are shown in C and D respectively. The p-values are calculated by the paired t test comparing cells treated with omeprazole or the vehicle.
Discussion
Tumor metabolism is the focus of a new wave of studies aimed at a better understanding of cancer biology and for developing novel tools for therapeutic intervention.Citation35,Citation36 In the present work, we show that HCC, the dysfunctional metabolism of which promotes a highly hypoxic and acidic environment,Citation7 selectively overexpress molecules such as V-ATPase, CAIX and CAXII that are in charge of proton extrusion and intracellular pH regulation. The pharmacological inhibition of these pH regulators greatly decreased tumor cell viability, suggesting a strong pro-survival role of these transporters in HCC biology. Moreover, in our HCC series, CA9 and CA12 gene expression was associated with tumor grading, thus indicating their possible involvement in tumor malignancy in vivo in HCC patients. Overexpression of these pH regulatory molecules is a biological feature common to many human tumors, and data in the literature show that their blockage exerts strong antitumor activity in vivo in human tumor xenografts.Citation27, Citation37–Citation39 However, to fully qualify these pH regulatory molecules as therapeutic targets for HCC patients, the in vivo antitumor effects of their specific antagonistic drugs in human HCC xenografts have still to be demonstrated.
Although selectively associated with the neoplastic transformation of hepatocytes, the expression patterns of V-ATPase, CAIX and CAXII in HCC showed non-redundant functions and thus diverse potentials as druggable targets. The focal distribution of CAIX within discrete tumor nests indicates that this transporter, promptly induced by hypoxia, might identify tumor areas with particularly low O2 tension. Given that CAIX is associated with stemness and enhanced malignancy in other solid cancersCitation40,Citation41 and that acidity may promote per se cell pluripotency,Citation42 it is possible that hypoxic niches may host HCC cells with stem-like features and that CAIX targeting may control the most aggressive cancer cells. These data also identify CAIX as a potential HCC prognostic biomarker, in accordance with a recent meta-analysis identifying that CAIX tumor expression is associated with a higher risk of locoregional failure and metastatic spread in multiple cancers.Citation22,Citation43
On the other hand, CAXII showed a homogeneous expression pattern in transformed hepatocytes, which is clearly a great advantage for effective therapeutic targeting. However, this pH regulator was unexpectedly retained intracellularly in both the HCC specimens and cell lines. Of note, the ER localization of CAXII was exacerbated by hypoxia and was seemingly specific to this tumor histotype, being undetectable in other solid cancers.Citation23 Although the molecular mechanism underlying this phenomenon is presently unknown, it could be that altered CAXII glycosylation or alternative splicing events, known to occur in cancer under certain conditionsCitation44,Citation45 might play a role in determining the intracellular localization of CAXII. Nevertheless, since HCC cell lines became partially refractory to CAXII inhibitor compound 25 under hypoxic conditions, it suggests that either the protein loses its function when retained in the ER or the drug has no access to this intracellular compartment. Modifications of compound 25 to allow binding to ER-retained CAXII, or the use of “intrabodies” designed to target splice variants,Citation46 could increase the efficacy of CAXII-specific targeting in liver cancer.
Our results show that V-ATPase was positive in most malignant hepatocytes, was detectable in infiltrating immune cells and was thus the most broadly and highly expressed pH regulator in the HCC microenvironment among those tested. These observations are consistent with data reported for melanoma and breast cancer, for which V-ATPase overexpression has also been associated with more aggressive disease and multi-drug resistance.Citation47 Selective V-ATPase inhibitors for clinical use are presently unavailable, and those developed for in vitro studies (e.g., bafilomycin) have exhibited prohibitive toxicity.Citation48 Hence, the functional analysis of the role of V-ATPase in HCC has been performed with omeprazole, a proton pump inhibitor (PPI) that is widely used to reduce gastric acid secretionCitation30 and has recently been reported to exert broad antitumor effects at preclinical and clinical levels.Citation47,Citation49 PPIs were designed to bind to gastric H+, K+-ATPase, but they can also cross-react with V-ATPase, albeit with lower affinity.Citation16 In our hands, omeprazole displayed antitumor activity in the HCC cell lines, suggesting promising clinical potential. Nevertheless, novel V-ATPase inhibitors that have recently been introduced, such as enoxacin and other small molecules, will potentially provide additional tools for therapeutic intervention in HCC.Citation50
Importantly, our data indicated that in contrast to the other pH regulators, V-ATPase was also markedly expressed by both the resident myeloid Kupffer cells and by the HCC immune cell infiltrate. Specifically, V-ATPase expression occurred in myeloid cells, most likely M2-like TAMs located within tumor nests or in the peri-tumor area at the boundary between tumor and adjacent non-tumor tissue. Transcriptional up-regulation of V-ATPase genes has been reported to occur in monocytic cells during macrophage differentiation in association with phagocytic activity.Citation51 Hence, it is conceivable that HCC-associated macrophages might exploit V-ATPase expression to survive the acidic tumor microenvironment and possibly exert their immunosuppressive effects. Data from HCC tissue explants, likely preserving the intercellular network operating in vivo, and the analysis of cell suspensions obtained from HCC specimens indicate that V-ATPase blockade via omeprazole can interfere with TAM activity, possibly favoring the conversion of protumor M2-like myeloid cells into antitumor M1-like cells, as indicated by the decrease in CCL22 expression and the concomitant significant increase of IFNγ and TNF. This cytokine modulation also occurred in the adaptive CD3+ cell population. Whether the immune cells were direct targets of the drugs or their functional modulation was the result of the drug-induced modification in tumor or other stromal cells remains to be addressed. Nevertheless, these data indicate a broad impact of omeprazole in creating a less immune-suppressive HCC microenvironment involving both innate and adaptive effector T cells. Indeed, omeprazole changed the tumor cell phenotype; V-ATPase inhibition in HCC explants by omeprazole down-regulated the MYC oncogene and induced an inverse modulation of E-cadherin and vimentin expression, thus implying a block of the EMT, a process that is also sustained by myeloid cellsCitation9,Citation52 and which drives disease progression in HCC.Citation24 Thus, targeting V-ATPase could achieve the twin goals of reducing the viability and aggressive features of tumor cells while concomitantly interfering with the protumor and immunosuppressive functions exerted by the myeloid cell infiltrate in HCC.Citation53
The precise molecular mechanisms underlying these effects remain to be fully elucidated. Tumor pH buffering mediated by omeprazole administration can certainly play a role in both tumor growth and associated immune dysfunctions.Citation11 Consistent with this opinion is the evidence that bicarbonate can be beneficial in HCC patients receiving locoregional therapyCitation54 and in mice undergoing tumor immunotherapy.Citation55 Nevertheless, it should be underlined that blockade of pH regulators might also directly interfere with downstream signaling pathways, including Wnt/β-catenin, Notch and mTOR,Citation16,Citation18 and with genes involved in the so called “metabolic catastrophe”Citation29 both in tumor cells and immune cells.
In conclusion, drugs that inhibit pH regulation might represent a promising therapeutic strategy in HCC patients, endowed with the novelty of simultaneously interfering with metabolic pathways of tumors and the associated immunosuppressive cell populations. In this era of immune checkpoint-based immunotherapy, not only showing promising efficacy in HCC patientsCitation4 but also underscoring the key role of myeloid cells in primary and acquired resistance,Citation56,Citation57 the identification of drugs that may potentially induce a less-aggressive and immunosuppressive tumor microenvironment could provide further therapeutic benefit when used in combination therapy.
Materials and methods
Ethical statement
This study was conducted in compliance with the Helsinki Declaration of 1975 and was approved by the review board of Fondazione IRCCS Istituto Nazionale dei Tumori of Milan (protocol number: INT 110/13). Written informed consent was obtained from the patients.
Patients, tissue samples and clinical data
Tumor (T) and adjacent non-tumor liver tissue (NT), sampled within 2 cm proximal to the tumor margin, were collected from resected HCC in patients with well-compensated cirrhosis (n = 57). Nine non-cirrhotic, normal (N) liver tissue samples were obtained from patients who underwent operations unrelated to cancer (cholecystectomy). Liver tissue specimens were snap-frozen in RNAlater™ solution (Thermo Fisher Scientific) for RNA analyses and stored at −80°C until use. See for the tumor pathology features. Formalin-fixed, paraffin-embedded (FFPE) samples corresponding to the liver tissues stored in the RNAlater solution were also prepared for immunostaining. Breast cancer samples were used as a control (n = 3) and were obtained from a pathology archive. To obtain single-cell suspensions, HCC tissues were enzymatically and mechanically digested using the gentleMACS Dissociator (Miltenyi Biotec) and were stored in liquid nitrogen until use.
Cell lines and culture conditions
The human HCC cell lines C3A, PLC/PRF/5 and SNU-449 and the breast cancer cell line T-47D (ATCC, Manassas, Virginia, USA) were cultured in complete culture medium (RPMI-1640, Lonza) supplemented with 10% heat-inactivated fetal calf serum (FCS, Lonza), 100 U/ml penicillin and 100 U/ml streptomycin under normoxia (N = 21% O2) or hypoxia (H = 1% O2) as indicated. HCC cell lines grown at 80–90% confluence were trypsinized, washed in 1x PBS and used for the analysis. Cell lines were routinely checked for their identity by STR profiling and were free of mycoplasma, as assessed using the N-GARDE Mycoplasma PCR reagent set (EMK-090020, Euroclone).
Ex vivo treatment of HCC tissue explants
Culturing of ex vivo HCC tissue explants was performed as previously described.Citation32 Fresh HCC tissues (n = 5) were cut into 3 mm3 pieces using a biopsy puncher under sterile conditions and were cultured for 24 h in a 48-well plate (Corning) in the presence of 300 μl RPMI 1640 with 1% FCS (Lonza) and 100 µg/ml omeprazole (Sigma-Aldrich) or drug vehicle (dimethylsulfoxide, DMSO, Sigma-Aldrich).
RNA extraction, reverse transcription and quantitative real-time PCR
Total RNA was extracted using a NucleoSpin miRNA kit (Macherey-Nagel). cDNA was generated using a High-Capacity cDNA reverse transcription kit (Thermo Fisher Scientific). In addition, cDNA obtained from HCC tissue explants was also pre-amplified using the TaqMan® Preamp Master Mix Kit (Thermo Fisher Scientific). cDNA was used to perform real-time PCR (qRT-PCR) with TaqMan® gene expression assays and the primers/probes reported in Supplementary Table S2. qRT-PCR assays were conducted using an ABI 7900HT instrument (Thermo Fisher Scientific). Data analysis was performed with SDS 2.2.2 software (Thermo Fisher Scientific).
Immunohistochemistry
Serial sections of 1-2-μm-thickness FFPE HCC (n = 23) and normal liver (n = 9) samples were processed for immunohistochemical staining. For each HCC case, the FFPE section slides of non-tumor, (NT) tumor (T) and peri-tumor (PT) tissues were analyzed. PT corresponds to the FFPE HCC sections, which include areas enriched in immune infiltrating cells adjacent to tumor nodules. The antibodies used are reported in Supplementary Table S3. Stained whole-section slides were scanned using Aperio Scanscope Cs (Aperio Technologies). Images were visualized and annotated with ImageScope software (Aperio Technologies).
Confocal analysis
Confocal microscopic analyses were performed using FFPE samples and HCC cell lines that were exposed or not to hypoxia (1% O2) for 72 h. The antibodies used are reported in Supplementary Table S3. The nuclei were stained with Toto-3 (Thermo Fisher Scientific). Confocal microscopy was performed using a Radiance 2100 microscope (Bio-Rad Laboratories) equipped with a krypton/argon laser and a red laser diode.
Flow cytometry
Antibodies used in flow cytometry are reported in Supplementary Table S4. CAIX and CAXII were detected at the cell surface. Multiparametric flow cytometry was performed on cell suspensions obtained from clinical HCC tissues and stored in liquid nitrogen. The cells were stained for cell surface markers, including V-ATPase a1, fixed and permeabilized with Cytofix/Cytoperm buffer (BD Biosciences), and stained with the intracellular markers (CCL22, IFNγ and TNF). CCL22, IFNγ and TNF production was measured after treatment with 100 μg/ml omeprazole or the vehicle of the drug (DMSO) for 24 h. Golgi Stop (0.7 μl/ml) was added after 1.5 h of treatment
Dead cells were identified using the LIVE/DEAD Fixable Violet Dead Cell Stain Kit (ThermoFisher Scientific) and were excluded from the analysis. Data were acquired using a Gallios flow cytometer (Beckman Coulter) and were analyzed by FlowJo, V 8.5.2 (Tree Star) or Kaluza 1.3 software (Beckman Couter).
Pharmacological inhibitors and cell viability assays
The selective CAIX inhibitor S4 (4-(3′-(3″,5″-dimethylphenyl)ureido)phenyl sulfamate) and the selective CAXII inhibitor compound 25 were developed by the team of Dr. CT Supuran. See Supplementary Table S1 for the chemical and biological details of the CAXII inhibitors. Omeprazole was purchased from Sigma-Aldrich. Drugs were dissolved in DMSO (Sigma-Aldrich) and were stored at −20°C. Prior to use, omeprazole was activated in acidified water at pH 3.7 for 30 min at RT in the dark and then diluted in culture medium. Activated omeprazole was used throughout the present study. HCC cells were plated at a density of 4–5 × 10³ cells/well in 96-well plates (Corning), drugs were added to fresh medium after 24 h, and plates were incubated for an additional 72 h. Cell viability was evaluated using the (3-(4,5)-dimethylthiazol-2-yl)-2,5-diphenyltetrazolium bromide (MTT) colorimetric assay (Sigma-Aldrich). Absorbance was measured at 570 nm with a spectrophotometer (Infinite® M1000, Tecan), and the average values from triplicate readings were calculated.
Statistical analysis
Statistical analyses were performed using GraphPad Prism Software v.5 (GraphPad, La Jolla). The Wilcoxon signed-rank test was used to compare gene expression levels between non-tumor and tumor tissues, and the Mann-Whitney U-test was used to compare the gene expression levels between normal and non-tumor tissues and between normal and tumor tissues. p-values less than or equal to 0.05 were considered significant. Fitted lines were generated using the four-parameter dose-response curve (variable slope), and the IC50 values for inhibition of cell growth at 72 h of S4, compound 25 and omeprazole treatment were calculated. One-way analysis of variance (ANOVA) followed by Bonferroni correction was used to evaluate statistical significance. The paired t test was used to compare the expression of MYC, CDH1, VIM, CCL22, IFNG and TNF in HCC tumor explants treated with 100 μg/ml omeprazole or the vehicle of the drug. To evaluate the modulation of IFNγ, TNF and CCL22 in fresh CD163+ and CD3+ cells isolated from HCC tissues due to the treatment with 100 μg/ml omeprazole or the vehicle of the drug, paired t tests were used.
Disclosure of potential conflicts of interest
No potential conflicts of interest were disclosed.
Financial support
This study was supported by the Associazione Italiana Ricerca sul Cancro (CC IG-15192; LR IG-14285) and the Italian Ministry of Health grant 52/RF-2010-2312620. O.K. is supported by a Prometeo Association fellowship. Fellowship provided by Prometeo Association.
2017ONCOIMM0613R1-file002.docx
Download MS Word (15.6 MB)Acknowledgments
The authors are grateful to Francesca Rini, Valeria Beretta, Agata Cova, Martina Filugelli and Paola Squarcina (Unit of Immunotherapy of Human Tumors, Fondazione IRCCS Istituto Nazionale dei Tumori, Milan, Italy) for technical help, Paola Frati for data management and Grazia Convertino for administrative support.
Additional information
Funding
References
- Torre LA, Siegel RL, Ward EM, Jemal A. Global cancer incidence and mortality rates and trends–an update. Cancer Epidemiol. Biomarkers Prev. 2016;25(1):16–27. doi:10.1158/1055-9965.EPI-15-0578. PMID:26667886
- Mazzaferro V, Lencioni R, Majno P. Early hepatocellular carcinoma on the procrustean bed of ablation, resection, and transplantation. Semin. Liver Dis. 2014;34(4):415–26. doi:10.1055/s-0034-1394365. PMID:25369303
- Bruix J, Gores GJ, Mazzaferro V. Hepatocellular carcinoma: Clinical frontiers and perspectives. Gut. 2014;63(5):844–55. doi:10.1136/gutjnl-2013-306627. PMID:24531850
- Kudo M. Immune checkpoint inhibition in hepatocellular carcinoma: Basics and ongoing clinical trials. Clinical Trials. Oncology. 2017;92 Suppl 1:50–62. doi:10.1159/000451016.
- Pitt JM, Vetizou M, Daillere R, Roberti MP, Yamazaki T, Routy B, Lepage P, Boneca IG, Chamaillard M, Kroemer G, et al. Resistance mechanisms to immune-checkpoint blockade in cancer: Tumor-intrinsic and -extrinsic factors. Immunity. 2016;44(6):1255–69. doi:10.1016/j.immuni.2016.06.001. PMID:27332730
- Vaupel P, Hockel M, Mayer A. Detection and characterization of tumor hypoxia using pO2 histography. Antioxid. Redox Signal. 2007;9(8):1221–35. doi:10.1089/ars.2007.1628. PMID:17536958
- Pavlova NN, Thompson CB. The emerging hallmarks of cancer metabolism. Cell. Metab. 2016;23(1):27–47. doi:10.1016/j.cmet.2015.12.006. PMID:26771115
- Webb BA, Chimenti M, Jacobson MP, Barber DL. Dysregulated pH: A perfect storm for cancer progression. Nat. Rev. Cancer. 2011;11(9):671–7. doi:10.1038/nrc3110. PMID:21833026
- Ye LY, Chen W, Bai XL, Xu XY, Zhang Q, Xia XF, Sun X, Li GG, Hu QD, Fu QH, et al. Hypoxia-induced epithelial-to-mesenchymal transition in hepatocellular carcinoma induces an immunosuppressive tumor microenvironment to promote metastasis. Cancer Res. 2016;76(4):818–30. doi:10.1158/0008-5472.CAN-15-0977. PMID:26837767
- Brand A, Singer K, Koehl GE, Kolitzus M, Schoenhammer G, Thiel A, Matos C, Bruss C, Klobuch S, Peter K, et al. LDHA-associated lactic acid production blunts tumor immunosurveillance by T and NK cells. Cell. Metab. 2016;24(5):657–71. doi: S1550-4131(16)30427-2. doi:10.1016/j.cmet.2016.08.011. PMID:27641098
- Calcinotto A, Filipazzi P, Grioni M, Iero M, De Milito A, Ricupito A, Cova A, Canese R, Jachetti E, Rossetti M, et al. Modulation of microenvironment acidity reverses anergy in human and murine tumor-infiltrating T lymphocytes. Cancer Res. 2012;72(11):2746–56. doi:10.1158/0008-5472.CAN-11-1272. PMID:22593198
- Huber V, Camisaschi C, Berzi A, Ferro S, Lugini L, Triulzi T, Tuccitto A, Tagliabue E, Castelli C, Rivoltini L. Cancer acidity: An ultimate frontier of tumor immune escape and a novel target of immunomodulation. Semin. Cancer Biol. 2017; 43:74–89. Epub 2017/3/6. doi: S1044-579X(17)30036-6. doi:10.1016/j.semcancer.2017.03.001. PMID:28267587
- Corzo CA, Condamine T, Lu L, Cotter MJ, Youn JI, Cheng P, Cho HI, Celis E, Quiceno DG, Padhya T, et al. HIF-1alpha regulates function and differentiation of myeloid-derived suppressor cells in the tumor microenvironment. J. Exp. Med. 2010;207(11):2439–53. doi:10.1084/jem.20100587. PMID:20876310
- Supuran CT. Carbonic anhydrases: Novel therapeutic applications for inhibitors and activators. Nat. Rev. Drug Discov. 2008;7(2):168–81. doi:10.1038/nrd2467. PMID:18167490
- Fais S, De Milito A, You H, Qin W. Targeting vacuolar H+-ATPases as a new strategy against cancer. Cancer Res. 2007;67(22):10627–30. doi:67/22/10627. doi:10.1158/0008-5472.CAN-07-1805. PMID:18006801
- Stransky L, Cotter K, Forgac M. The function of V-ATPases in cancer. Physiol. Rev. 2016;96(3):1071–91. doi:10.1152/physrev.00035.2015. PMID:27335445
- Toei M, Saum R, Forgac M. Regulation and isoform function of the V-ATPases. Biochemistry. 2010;49(23):4715–23. doi:10.1021/bi100397s. PMID:20450191
- Sun-Wada GH, Wada Y. Role of vacuolar-type proton ATPase in signal transduction. Biochim. Biophys. Acta. 2015;1847(10):1166–72. doi:10.1016/j.bbabio.2015.06.010. PMID:26072192
- Neri D, Supuran CT. Interfering with pH regulation in tumours as a therapeutic strategy. Nat. Rev. Drug Discov. 2011;10(10):767–77. doi:10.1038/nrd3554. PMID:21921921
- Wilson GK, Tennant DA, McKeating JA. Hypoxia inducible factors in liver disease and hepatocellular carcinoma: Current understanding and future directions. J. Hepatol. 2014;61(6):1397–406. doi:10.1016/j.jhep.2014.08.025. PMID:25157983
- Wykoff CC, Beasley NJ, Watson PH, Turner KJ, Pastorek J, Sibtain A, Wilson GD, Turley H, Talks KL, Maxwell PH, et al. Hypoxia-inducible expression of tumor-associated carbonic anhydrases. Cancer Res. 2000;60(24):7075–83. PMID:11156414
- Huang WJ, Jeng YM, Lai HS, Fong IU, Sheu FY, Lai PL, Yuan RH. Expression of hypoxic marker carbonic anhydrase IX predicts poor prognosis in resectable hepatocellular carcinoma. PLoS One. 2015;10(3):e0119181. doi:10.1371/journal.pone.0119181. PMID:25738958
- Parkkila S, Parkkila AK, Saarnio J, Kivela J, Karttunen TJ, Kaunisto K, Waheed A, Sly WS, Tureci O, Virtanen I, et al. Expression of the membrane-associated carbonic anhydrase isozyme XII in the human kidney and renal tumors. J. Histochem. Cytochem. 2000;48(12):1601–08. doi:10.1177/002215540004801203. PMID:11101628
- Yamada S, Okumura N, Wei L, Fuchs BC, Fujii T, Sugimoto H, Nomoto S, Takeda S, Tanabe KK, Kodera Y. Epithelial to mesenchymal transition is associated with shorter disease-free survival in hepatocellular carcinoma. Ann. Surg. Oncol. 2014;21(12):3882–90. doi:10.1245/s10434-014-3779-2. PMID:24833103
- Yamashita T, Ji J, Budhu A, Forgues M, Yang W, Wang HY, Jia H, Ye Q, Qin LX, Wauthier E, et al. EpCAM-positive hepatocellular carcinoma cells are tumor-initiating cells with stem/progenitor cell features. Gastroenterology. 2009;136(3):1012–24. doi:10.1053/j.gastro.2008.12.004. PMID:19150350
- Winum JY, Carta F, Ward C, Mullen P, Harrison D, Langdon SP, Cecchi A, Scozzafava A, Kunkler I, Supuran CT. Ureido-substituted sulfamates show potent carbonic anhydrase IX inhibitory and antiproliferative activities against breast cancer cell lines. Bioorg. Med. Chem. Lett. 2012;22(14):4681–85. doi:10.1016/j.bmcl.2012.05.083. PMID:22721713
- Gieling RG, Babur M, Mamnani L, Burrows N, Telfer BA, Carta F, Winum JY, Scozzafava A, Supuran CT, Williams KJ. Antimetastatic effect of sulfamate carbonic anhydrase IX inhibitors in breast carcinoma xenografts. J. Med. Chem. 2012;55(11):5591–600. doi:10.1021/jm300529u. PMID:22621623
- D'Ascenzio M, Carradori S, Secci D, Vullo D, Ceruso M, Akdemir A, Supuran CT. Selective inhibition of human carbonic anhydrases by novel amide derivatives of probenecid: synthesis, biological evaluation and molecular modelling studies. Bioorg. Med. Chem. 2014;22(15):3982–88. doi:10.1016/j.bmc.2014.06.003. PMID:25027802
- Parks SK, Chiche J, Pouyssegur J. Disrupting proton dynamics and energy metabolism for cancer therapy. Nat. Rev. Cancer. 2013;13(9):611–23. doi:10.1038/nrc3579 PMID:23969692
- Suzuki M, Suzuki H, Hibi T. Proton pump inhibitors and gastritis. J. Clin. Biochem. Nutr. 2008;42(2):71–75. doi:10.3164/jcbn.2008012. PMID:18385822
- Fornari F, Pollutri D, Patrizi C, La Bella T, Marinelli S, Casadei Gardini A, Marisi G, Baron Toaldo M, Baglioni M, et al. In Hepatocellular Carcinoma miR-221 Modulates Sorafenib Resistance through Inhibition of Caspase-3-Mediated Apoptosis. Clin. Cancer Res. 2017;23(14):3953–3965. Epub 2017/1/17. doi:10.1158/1078-0432.CCR-16-1464. PMID:28096271
- Breunig C, Mueller BJ, Umansky L, Wahl K, Hoffmann K, Lehner F, Manns MP, Bantel H, Falk CS. BRaf and MEK inhibitors differentially regulate cell fate and microenvironment in human hepatocellular carcinoma. Clin. Cancer Res. 2014;20(9):2410–23. doi:10.1158/1078-0432.CCR-13-1635. PMID:24573550
- Cao Z, Fan-Minogue H, Bellovin DI, Yevtodiyenko A, Arzeno J, Yang Q, Gambhir SS, Felsher DW. MYC phosphorylation, activation, and tumorigenic potential in hepatocellular carcinoma are regulated by HMG-CoA reductase. Cancer Res. 2011;71(6):2286–97. doi:10.1158/0008-5472.CAN-10-3367. PMID:21262914
- Smith AP, Verrecchia A, Faga G, Doni M, Perna D, Martinato F, Guccione E, Amati B. A positive role for Myc in TGFbeta-induced Snail transcription and epithelial-to-mesenchymal transition. Oncogene. 2009;28(3):422–30. doi:10.1038/onc.2008.395. PMID:18978814
- Sun Y, Shi Z, Lian H, Cai P. Energy metabolic dysfunction as a carcinogenic factor in cancer cells. Clin. Transl. Med. 2016;5(1):14-016-0094-5. Epub 2016 Apr 6. doi:10.1186/s40169-016-0094-5.
- Lim S, Phillips JB, Madeira da Silva L, Zhou M, Fodstad O, Owen LB, Tan M. Interplay between Immune Checkpoint Proteins and Cellular Metabolism. Cancer Res. 2017;77(6):1245–49. doi:10.1158/0008-5472.CAN-16-1647. PMID:28246276
- Lou Y, McDonald PC, Oloumi A, Chia S, Ostlund C, Ahmadi A, Kyle A, Auf dem Keller U, Leung S, Huntsman D, et al. Targeting tumor hypoxia: Suppression of breast tumor growth and metastasis by novel carbonic anhydrase IX inhibitors. Cancer Res. 2011;71(9):3364–76. doi:10.1158/0008-5472.CAN-10-4261. PMID:21415165
- Gondi G, Mysliwietz J, Hulikova A, Jen JP, Swietach P, Kremmer E, Zeidler R. Antitumor efficacy of a monoclonal antibody that inhibits the activity of cancer-associated carbonic anhydrase XII. Cancer Res. 2013;73(21):6494–503. doi:10.1158/0008-5472.CAN-13-1110. PMID:24030978
- De Milito A, Canese R, Marino ML, Borghi M, Iero M, Villa A, Venturi G, Lozupone F, Iessi E, Logozzi M, et al. pH-dependent antitumor activity of proton pump inhibitors against human melanoma is mediated by inhibition of tumor acidity. Int. J. Cancer. 2010;127(1):207–19. doi:10.1002/ijc.25009. PMID:19876915
- Currie MJ, Beardsley BE, Harris GC, Gunningham SP, Dachs GU, Dijkstra B, Morrin HR, Wells JE, Robinson BA. Immunohistochemical analysis of cancer stem cell markers in invasive breast carcinoma and associated ductal carcinoma in situ: relationships with markers of tumor hypoxia and microvascularity. Hum. Pathol. 2013;44(3):402–11. doi:10.1016/j.humpath.2012.06.004. PMID:23036368
- Lock FE, McDonald PC, Lou Y, Serrano I, Chafe SC, Ostlund C, Aparicio S, Winum JY, Supuran CT, Dedhar S. Targeting carbonic anhydrase IX depletes breast cancer stem cells within the hypoxic niche. Oncogene. 2013;32(44):5210–19. doi:10.1038/onc.2012.550. PMID:23208505
- Hjelmeland AB, Wu Q, Heddleston JM, Choudhary GS, MacSwords J, Lathia JD, McLendon R, Lindner D, Sloan A, Rich JN. Acidic stress promotes a glioma stem cell phenotype. Cell Death Differ. 2011;18(5):829–40. doi:10.1038/cdd.2010.150. PMID:21127501
- van Kuijk SJ, Yaromina A, Houben R, Niemans R, Lambin P, Dubois LJ. Prognostic Significance of Carbonic Anhydrase IX Expression in Cancer Patients: A Meta-Analysis. Front. Oncol. 2016;6:69. doi:10.3389/fonc.2016.00069. PMID:27066453
- Venables JP. Aberrant and alternative splicing in cancer. Cancer Res. 2004;64(21):7647–54. doi:64/21/7647. doi:10.1158/0008-5472.CAN-04-1910. PMID:15520162
- Oliveira-Ferrer L, Legler K, Milde-Langosch K. Role of protein glycosylation in cancer metastasis. Semin. Cancer Biol. 2017;44:141–152. Epub 2017/3/16. doi:S1044-579X(17)30040-8. doi:10.1016/j.semcancer.2017.03.002. PMID:28673608
- Marschall AL, Dubel S. Antibodies inside of a cell can change its outside: Can intrabodies provide a new therapeutic paradigm? Comput. Struct. Biotechnol. J. 2016;14:304–8. doi:10.1016/j.csbj.2016.07.003.
- Taylor S, Spugnini EP, Assaraf YG, Azzarito T, Rauch C, Fais S. (2015) Microenvironment acidity as a major determinant of tumor chemoresistance: Proton pump inhibitors (PPIs) as a novel therapeutic approach. Drug Resist Updat. 2015;23:69–78. doi:10.1016/j.drup.2015.08.004. PMID:26341193
- Niikura K. Vacuolar ATPase as a drug discovery target. Drug News. Perspect. 2006;19(3):139–44. doi:977442. doi:10.1358/dnp.2006.19.3.977442. PMID:16804565
- Ferrari S, Perut F, Fagioli F, Brach Del Prever A, Meazza C, Parafioriti A, Picci P, Gambarotti M, Avnet S, Baldini N, et al. Proton pump inhibitor chemosensitization in human osteosarcoma: from the bench to the patients' bed. J. Transl. Med. 2013;11:268-5876-11-268. doi:10.1186/1479-5876-11-268.
- Toro EJ, Ostrov DA, Wronski TJ, Holliday LS. Rational identification of enoxacin as a novel V-ATPase-directed osteoclast inhibitor. Curr. Protein Pept. Sci. 2012;13(2):180–91. doi:BSP/CPPS/E-Pub/174. doi:10.2174/138920312800493151. PMID:22044158
- Wang SP, Krits I, Bai S, Lee BS. Regulation of enhanced vacuolar H+-ATPase expression in macrophages. Biol. Chem. 2002;277(11):8827–34. doi:10.1074/jbc.M111959200.
- Fan QM, Jing YY, Yu GF, Kou XR, Ye F, Gao L, Li R, Zhao QD, Yang Y, Lu ZH, et al. Tumor-associated macrophages promote cancer stem cell-like properties via transforming growth factor-beta1-induced epithelial-mesenchymal transition in hepatocellular carcinoma. Cancer Lett. 2014;352(2):160–8. doi:10.1016/j.canlet.2014.05.008. PMID:24892648
- Yeung OW, Lo CM, Ling CC, Qi X, Geng W, Li CX, Ng KT, Forbes SJ, Guan XY, Poon RT, et al. Alternatively activated (M2) macrophages promote tumour growth and invasiveness in hepatocellular carcinoma. J. Hepatol. 2015;62(3):607–16. doi:10.1016/j.jhep.2014.10.029. PMID:25450711
- Chao M, Wu H, Jin K, Li B, Wu J, Zhang G, Yang G, Hu X. A nonrandomized cohort and a randomized study of local control of large hepatocarcinoma by targeting intratumoral lactic acidosis. Elife 2016: e15691. doi:10.7554/eLife.15691. doi:10.7554/eLife.15691.
- Pilon-Thomas S, Kodumudi KN, El-Kenawi AE, Russell S, Weber AM, Luddy K, Damaghi M, Wojtkowiak JW, Mule JJ, Ibrahim-Hashim A, et al. Neutralization of Tumor Acidity Improves Antitumor Responses to Immunotherapy. Cancer Res. 2016;76(6):1381–90. doi:10.1158/0008-5472.CAN-15-1743 PMID:26719539
- Gebhardt C, Sevko A, Jiang H, Lichtenberger R, Reith M, Tarnanidis K, Holland-Letz T, Umansky L, Beckhove P, Sucker A, et al. Myeloid Cells and Related Chronic Inflammatory Factors as Novel Predictive Markers in Melanoma Treatment with Ipilimumab. Clin. Cancer Res. 2015;21(24):5453–59. doi:10.1158/1078-0432.CCR-15-0676. PMID:26289067
- Antonios JP, Soto H, Everson RG, Moughon D, Orpilla JR, Shin NP, Sedighim S, Treger J, Odesa S, Tucker A, et al. Immunosuppressive tumor-infiltrating myeloid cells mediate adaptive immune resistance via a PD-1/PD-L1 mechanism in glioblastoma. Neuro Oncol. 2017;19(6):796–807. doi:10.1093/neuonc/now287. PMID:28115578