
ABSTRACT
T cell function in cancer patients is usually impaired due to the constitutive activation of immune checkpoint inhibitors. This state is known as ‘exhaustion’ and is often associated with the inefficient control of tumors or persistent infections. In this work, we investigated the role of leukemia cell-derived microvesicles (MVs) in T cell exhaustion. Following incubation with MVs from various sources, all T cell subtypes exhibited the exhaustion phonotype and impaired cytokine secretion in vitro. Mice models also showed the connection between immune checkpoint inhibitors and MV injection. Sequencing and bioinformatics analyses indicated that a number of transcription factors and microRNAs (miRNAs) were attributable to the dysregulation of pathways and exhaustion in T cells. Further work revealed that functional miR-92a-3p, miR-21-5p, miR-16-5p, miR-126 and miR-182-5p in MVs could be delivered into T cells to induce the exhaustion phenotype. SerpinB2, IL-1β and CXCL5, which are mediators of the NF-κB pathway, were identified as the targets of the miRNAs mentioned above. We demonstrated that leukemia-derived MVs could initiate T cell exhaustion via the progressive temporal delivery of multiple exogenous miRNAs into T cells and the subsequent interaction of these miRNAs with their targets. Therefore, MVs can be expected not only to become new indicators of the T cell status in patients but also to be used as novel targets for personalized patient treatment.
Introduction
Acute leukemia is a heterogeneous malignancy characterized by the clonal expansion of hematopoietic blasts in the peripheral blood, bone marrow, and/or other tissues. A majority of acute leukemia patients have poor prognosis with traditional therapies.Citation1 T cell therapy, especially with chimeric antigen receptor T (CAR-T) cells, is promising for the treatment of leukemia and other cancers.Citation2,Citation3 However, in the context of persistent antigen exposure in chronic viral infections and cancer, both native and adoptive T cells can become exhausted/dysfunctional.Citation4,Citation5 These exhausted T cells upregulate multiple inhibitory receptors/immune checkpoints, such as CTLA-4 and PD-1, and exhibit defective proliferative capacities and cytokine production. Nevertheless, these cells are not totally inert and may exert lytic functions.Citation5,Citation6 Anti-CTLA-4 and/or anti-PD-1 monoclonal antibodies can successfully reinvigorate tumor-infiltrating T cells and provide clinical benefits to many patients with advanced cancer.Citation7,Citation8 However, T cell exhaustion cannot be completely resolved with PD-1 inhibitors.Citation9 Sen et al. demonstrated that after PD-1 blockade, the reinvigorated T cells can become exhausted again if the level of the antigen remains high and fail to generate T memory cells upon antigen clearance.Citation10 Therefore, T cell therapy in leukemia is hampered due to the induction of intrinsic mechanisms of T cell re-invigorated by leukemic blasts and some other factors.
Cancer cells can generate large membrane-enclosed structures, known as microvesicles (MVs), which transport epigenetic molecules between cells and influence cellular behavior.Citation11 MVs primarily affect cellular behavior; in addition to growth factors and cytokines, MVs carry a variety of components from their parental cells, particularly mRNA transcripts and microRNAs (miRNAs).Citation12 Our previous work has demonstrated that BCR-ABL1+ MVs can induce malignant transformation of mononuclear cells from bone marrow.Citation13 Many studies have demonstrated that MVs are mediators of cancer-associated immunosuppressive microenvironments.Citation14 The aim of this study was to investigate whether MVs can play a role in leukemia associated T cell exhaustion.
Results
Alteration of T cells during MV-induced malignant transformation
In our previous study,Citation13 BCR-ABL1+ MVs were found to transform normal hematopoietic cells into leukemia cells (). To clarify the role of T cell immunity in malignant transformation, we determined the percentage of T cell subsets during the process. In general, the percentage of total lymphocytes and the absolute numbers of CD3+, CD3+CD4+ and CD3+CD8+ T cells continued to decrease from day 0 to day 14 during PBMC incubation with MVs (Fig.S1 A-D), while the percentage of CD3+T cells reached a peak on day 3 of incubation and decreased to a very low level by day 14, which marked the time of malignant transformation (). Notably, the percentage of CD3+CD4+ and CD3+CD8+ T cells remained low on day 14( and ), and the proportion of CD3+CD8+ T cells was significantly higher on day 3 than that on day 7(). Additionally, the proportion of CD3−CD56+ natural killer (NK) cells also decreased during this process (Fig.S1E).
Figure 1. Alteration of T cells during the MV-induced malignant transformation of PBMCs. (A) Model representing the incubation of malignant transformation of PBMCs by MVs; The percentage of (B) CD3+, (C) CD3+CD4+, and (D) CD3+CD8+ T cells on days 0, 3, and 7 after inducing PBMC with K562-MVs; (E) CD3+ T cells isolated from induced PBMC on day 0, 3 and 7 were examined by RT-PCR to detect the expression of inhibitor receptor Tim3(n = 3); (F) Expression of PD-1 on the surface of CD8+ T cells detected by flow cytometry during incubation. Paired t test was used to compare two groups in same point and different time points. Values represent the means ± SD,*P < 0.05, **P < 0.01, ***P < 0.001.
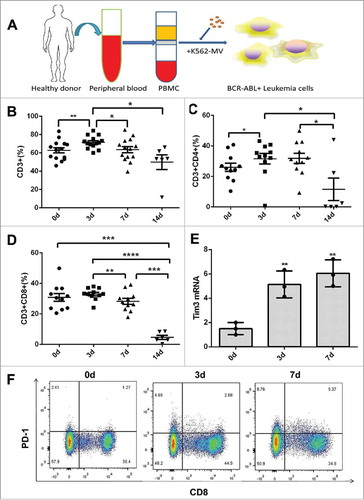
According to our previous RNA-seq results,Citation15 the immune system goes through a process of activation (day 3) to inactivation (day 7–14) during incubation with MVs, which is in accordance with the changes in the proportions of T cell subtypes. To further elucidate this transition, we detected the expression of Tim3 and Lag3 in T cells isolated from PBMC induced with K562-MVs by RT-PCR. Indeed, Tim3 and Lag3 mRNA level significantly increased on days 3 and 7 of incubation with K562-MVs ( and Fig.S1 F). Similarly, the expression of PD-1 in CD3+CD8+ and CD3+CD4+ T cells were markedly increased after seven days of induction (, Fig.S1G-I).
Effect of MVs on T cells in vitro
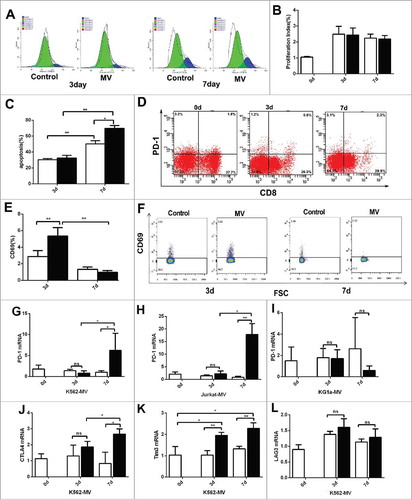
T cell exhaustion is affected by tumor microenvironment. We found that T cells from different leukemia patients exhibit high level of PD-1 but decreased after cultured for 7 days in vitro (Fig.S2 A and S2B). To exclude the influence of other cell types, we isolated CD3+ T cells from healthy donor PBMC using human CD3 microbeads and added MVs to these T cells for 7–10 days. The MVs exerted no significant effect on the proliferation of T cells on day 3 or on day 7 by CFSE assay () and the proliferation index shown no difference between control and MV group on d3 and d7 (). However, comparing with the control, MVs induced apoptosis in T cells on day 7 but not on day 3 (). According to flow cytometry results, the proportion of CD3+CD8+ T cells expressing PD-1 increased for about four folds on day 7 comparing with day 3 (). The proportion of CD3+CD4+ T cells expressing PD-1 also increased for about three folds on day 7 comparing with day 3 (Fig.S2 C). However, the marker of active T cells, CD69, increased significantly on day 3 (). Representative expression of CD69 on the surface of CD3+CD8+ T cells was shown (). In addition, RT-PCR was used to detect the expression of checkpoint inhibitors after incubation without and with MVs on day 0, 3 and 7. The expression of PD-1 mRNA was significantly higher on day 7 than day 3 after incubation with K562-MVs, Jurkat-MVs ( and ), while there was no significant effect after incubation without and with KG1a-MVs (). We further evaluated the levels of other inhibitory receptors such as CTLA4 (), Tim3 () and Lag3 (). Expression of CTLA4 and Tim3 mRNA were also significantly higher on day 7 after incubation with K562-MVs and Lag3 mRNA had no significant change.
Figure 2. The impact of MVs on T cells in vitro. CD3+ T cells were isolated and were induced with MVs. (A) CD3+ T cells were stained with CFSE to analysis of proliferation on days 3 and 7 during incubation without (control group) and with K562-MVs (MV group), one color represents a generation of T cells, blue represents parent generation; (B) The proliferation index is shown during induction without (white) or with (black) K562-MVs on day 3 and 7 (n = 5); (C)Analysis of apoptosis in T cells on days 3 and 7 after incubation without (white bar graph) and with K562-MVs (black bar graph)(n = 3); (D)Representative expression of PD-1 on the surface of CD3+CD8+ T cells was detected on days 0, 3 and 7 of MV incubation by flow cytometry; (E) Expression of CD69 on the surface of CD3+CD8+ T cells was detected by flow cytometry on days 3 and 7 after incubation without (white bar graph) or with K562-MVs (black bar graph)(n = 4); (F) Representative expression of CD69 on the surface of CD3+CD8+ T cells was shown; (G) PD-1 mRNA ofCD3+ T cells were detected by RT-PCR after incubation without and with K562-MVs(, n = 4), Jurkat-MVs(H, n = 4) and KG1 a-MVs (I, n = 4) on days 0, 3, and 7; CTLA4 mRNA(J, n = 4), Tim3 mRNA(K, n = 4) and LAG3 (L,n = 4) mRNA of CD3+ T cells were detected by RT-PCR after incubation without or with K562-MVs on days 0, 3, and 7. White bar graph represents without MV group and black bar graph represents with MV group. Paired t test was used to compare two groups in same point and different time points. Values represent the means ± SD, *P < 0.05, **P < 0.01.
T cell functions after incubation with MVs
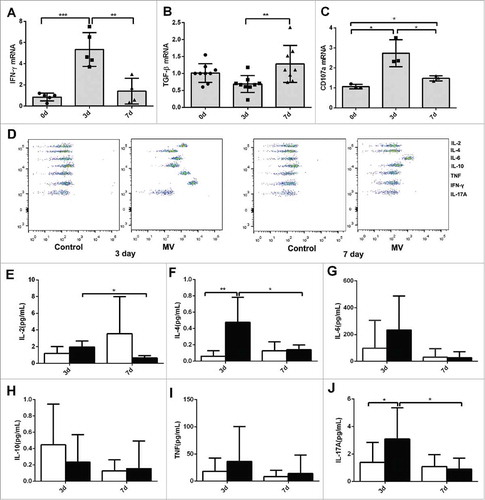
T cell-derived cytokines are indicators of T cell functions. Compared with those in the control group and on day 7, the levels of T helper (Th)-1 cytokines, such IFN-γ and IL-2, were significantly higher on day 3 ( and Fig.S3 A). However, the Th2 cytokine TGF-β was expressed at a lower level on day 3 than that on day 7 (). Additionally, the expression of CD107 a, which marks T cell cytotoxicity, showed a similar trend to that of IFN-γ (). The CBA Kit was used to evaluate the levels of seven cytokines in the supernatants of T cells cultured without and with K562-MVs (). The levels of secreted IL-2 and IL-4 were higher in the MV-induced group than those in the control group, and these levels in the MV-induced group were higher on day 3 than those on day 7 ( and ). Compared with that on day 3, the expression of other cytokines, such as IL-6, IL-10, IFN-γ and IL-17, was reduced on day 7 ( and Fig.S3B), but there was no statistical significance due to a great difference in different individual sample in one group. Flow cytometry showed a similar trend for the changes in the levels of intracellular cytokines including IL-2 and IL-10 (Fig.S3C and 3D).
Figure 3. T cell functions after incubation with MVs. (A) IFN-γ mRNA (n = 5), (B) TGF-β mRNA (n = 9) and (C) CD107 a mRNA (n = 3) of CD3+ T cells on days 0, 3, and 7 after incubation with K562-MVs; (D) A representative CBA analysis was shown; Levels of (E) IL-2, (F) IL-4, (G) IL-6, (H) IL-10, (I) TNF, and (J) IL-17 A in the supernatants of T cells cultured without or with K562-MVs detected by CBA kit, white bar graph represents without MVs and black bar graph represents with MVs group, the experiment was repeated for six times. Paired t test was used to compare two groups in same point and different time points. Values represent the means ± SD, *P < 0.05, **P < 0.01, ***P < 0.001.
Leukemia cell-derived MVs induce T cell exhaustion in vivo
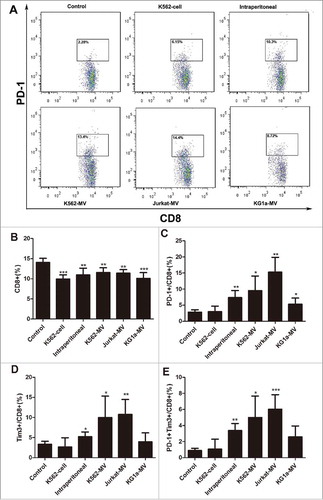
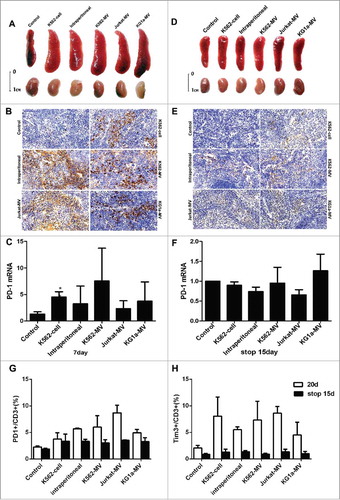
To validate the effect of leukemia cell-derived MVs on T cells in vivo, we injected K562 cells, K562-MVs, Jurkat-MVs, KG1 a-MVs and PBS into the tail vein of BALB/c mice every day for 20 days. In another group, K562-MVs were intraperitoneally injected into the mice. The levels of PD-1 and Tim3 on the surface of T cells were analyzed by flow cytometry on days 0, 7and 20 of injection. The proportion of PD-1- expressing on CD3+CD8+ and CD3+CD4+ T cells in the peripheral blood of mice increased by 3- to 8-fold after incubation with MVs on day 20 ( and Fig.S4A). Furthermore, the proportion of CD3+CD8+ T cells in the peripheral blood of mice in the experimental groups was lower than that in the peripheral blood of mice in the control group (), which was consistent with our results in vitro. After 20 days of injection, the proportion of PD-1- and Tim3-expressing on CD8+ T cells was significantly higher in groups K562-MVs (both intravenous and intraperitoneal), Jurkat-MVs, and KG1 a-MVs than that in the control group; the group injected with K562cells was not significantly different from the control group due to intermittent injection ( and ). Double-positive (PD-1+Tim+) on CD8+ T cells represent populations that are exhausted to a high degree and exhibit weak cytokine secretion.Citation16 After 20 days of incubation, the proportion of PD-1+Tim+ on CD8+ T cells was higher in all the experimental groups than that in the control group, except for the K562 cell-injected group (). The proportions of PD-1+, Tim3+, and PD-1+Tim3+ on CD4+ T cells were similar to those of the corresponding CD8+ T cells after 20 days of incubation (supplementary Fig.S4B-4E).
Figure 4. Leukemia cell-derived MVs induce exhaustion of CD8+ T cells. (A)Peripheral blood (100µl) was obtained from BALB/c mice after injection with MVs for 20 days to detect the exhaustion markers PD-1 on the surface of CD8+ T cells by flow cytometry. Control represents the group injected with PBS through the tail vein; K562-cell represents the group injected with K562 cells through the tail vein; intraperitoneal represents the group injected with K562-MVs into the peritoneal cavity; and K562-MVs, Jurkat-MVs, and KG1 a-MVs represent the groups injected with the respective MVs through the tail vein; (B) Proportion of CD8+ T cells among all lymphocytes; (C) Expression of PD-1 on CD8+ T cells; (D) Expression of Tim3 on CD8+ T cells; (E) Co-expression of PD-1 and Tim3 on CD8+ T cells. Unpaired t test was used to compare different groups. Values represent the means ± SD, *P < 0.05, **P < 0.01, ***P < 0.001.
The mice were sacrificed on day 7 and day 20 after injection with MVs. Enlarged spleens were observed in the experimental groups ( and Fig.S5A). Spleens in experimental groups were positive for human CD45, which mainly marks interstitial cells ( and Fig.S5B). The expression of PD-1 in the spleen tissues was also higher than in the control group on day 7, as detected by RT-PCR (). Another group of mice was injected with MVs for 20 days and subsequently monitored for 15 days after stopping injection. Interestingly, the spleens in the experimental groups became smaller after the termination of injection (). The rate of positivity for anti-human CD45 significantly reduced, and the expression of PD-1 in the spleens was not significantly different between the experimental group and the control group ( and ). In addition, PD-1 and Tim-3 on surface of CD3+ T cells examined by flow cytometry were compared on day 20 after injection and on day 15 after stopping injection. The expression of PD-1 () and Tim-3 () significantly decreased stopping injection 15 days comparing injection 20 days, which suggested that the exhaustion of T cells could be reversed after stopping stimulation with tumor cell- or tumor-derived MVs.
Figure 5. Exhaustion of CD8+ T cells and the reversion of exhaustion after stopping injection in vivo. (A) Size of spleens and kidneys from different groups after 7 days of injection with PBS, K562 cells, K562-MVs, Jurkat-MVs, or KG1 a-MVs; (B) Representative IHC images of spleens from different groups stained using anti-human CD45 antibody after 7 days of injection; (C) Expression of PD-1 in the spleens from different groups examined by RT-PCR after 7 days of injection; (D) Size of spleens and kidneys from different groups 15 days after stopping injection; (E) Representative IHC images of spleens from different groups stained using anti-human CD45 antibody 15 days after stopping injection; (F) Expression of PD-1 in the spleens from different groups examined by RT-PCR 15 days after stopping injection; (G) PD-1 and Tim3 (H) on surface of CD3+ T cells examined by flow cytometry were compared on day 20 after injection and on day 15 after stopping injection. Unpaired t test was used to compare different groups. Values represent the means ± SD, *P < 0.05, **P < 0.01, ***P < 0.001.
Gene expression and functional enrichment analyses in T cells
To investigate the changes in gene expression and the potential mechanism of T cell transformation induced by MVs, we performed RNA-seq on T cells on days 0, 3 and 7 of incubation with MVs. Thus, 9 samples (3 replicates for each time point) were sequenced, and 24 trillion reads were generated. Read mapping was performed against the hg19 reference genome from the UCSC database, and 21,594 DEGs were detected. In total, we identified 454, 75, and555 DEGs in the three comparisons (day 0 vs day3, day3 vs day7, and day0 vs day7, respectively). Moreover, we screened for the 20 abundant miRNAs in MVs based on our previous sequencing data (Supplemental Table S1).Citation15 The functional enrichment analysis of these genes showed that most of the KEGG pathways and GO terms were related to immune responses and immune cell activity, such as Toll-like receptor signaling, chemokine signaling receptors and leukocyte migration ( and ).
Figure 6. Gene expression and functional enrichment analyses in T cells. GO terms (A) and KEGG pathways (B) were enriched in three comparisons (day0 vs day 3, day3 vs day7, and day0 vs day7) with false discovery rate (FDR) < 0.05; (C) Expression of the 23 DEGs upregulated on day 3 and down-regulated on day 7, A, B and C represent 3 replicates at the same time point; (D) miRNA-TF-target regulatory network for the 23 DEGs. Color of the outline of nodes represents expression changes on day 7 vs day 3, and that of filled nodes represents the expression changes on day 3 vs day 0. Red: upregulation; gray: downregulation; (E) Subnet work of CXCL5, IL-1B, and SERPINB2.
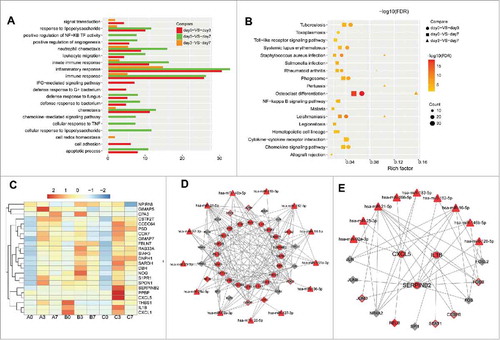
The NF-κB signaling pathway was significantly enriched in two comparisons (day0 vs day3 and day0 vs day7) (). The NF-κB pathway plays a critical role in T cell function and survival, and inactivation of the pathway impairs T cell effector functions.Citation17 To explore the mechanism by which MVs induced T cell exhaustion on day 7, we focused on the 23 DEGs that were up-regulated on day 3 and down- regulated on day 7 (). We constructed a miRNA-TF-target regulatory network with the 23 DEGs, 20 abundant miRNAs in MVs, and 30 TFs among the DEGs ().Among the 23 DEGs, we focused on Interleukin-1 beta (IL-1β), SERPINB2, and CXCL5, which are directly or indirectly associated with the function of T cells (). Notably, the expression may be altered because of the delivery of miRNAs in MVs into T cells. IL-1β is targeted by various regulators (miR-21-5p, FOS, and NR4A2) and has been verified as a target of miR-21-5p in a previous study.Citation18 CXCL5 was targeted by miR-92 a-3p, miR-21-5p and miR-16-5p, while SERPINB2 was targeted by miR-182-5p, miR-126-5p and miR-16-5p (). Moreover, the NF-κB inhibitor alpha (NFKBIA) was down-regulated after 3 days of continuous incubation with MVs, which is consistent with the activation of the NF-κB pathway at this time point. These results indicated that intracellular NF-κB of T cells could be influenced by miRNAs in MVs from different aspects.
miRNAs in MVs were transported into T cells to induce exhaustion
By co-culturing T cells with MVs, we microscopically observed the fusion of MVs (green) with T cells (blue, ). Furthermore, the copies of BCR-ABL1 () and miR-92 a, miR-182 mRNA (Fig. S6 A and 6B) in T cells were significantly increased after co-culture with MVs, indicating that MVs likely transport BCR-ABL1 mRNA and miRNAs into T cells. According to our previous study, K562-MVs carry many miRNAs. miR-92 a-3p, miR-21-5p, miR-16-5p, miR-126 and miR-182-5p, which are abundant in K562-MVs, are transported into T cells and can affect the function of these cells. The target genes of the five identified miRNAs, such as SERPINB2, IL-1B and CXCL5, in CD8+ T cells were down-regulated after co-transfection with five miRNAmimics (). In addition, miRNAs mRNA significantly upregulated after co-transfection with five miRNAmimics comparing with negative control group (). Moreover, compared with that in the negative control (NC), the expression of PD-1, CTLA-4, Tim3 and Lag3 in CD8+ T cells was significantly increased after the co-transfection of the five miRNAmimics into these CD8+ T cells ().
Figure 7. miRNAs in MVs are transported into T cells to induce exhaustion. (A) Confocal microscopy revealed the fusion of MVs and T cells after co-culture; (B) Copies of BCR-ABL significantly increased in T cells after co-culture (n = 3); Expression of target genes (C) SERPINB2, (D) IL-1B, and (E) CXCL5 in CD8+ T cells decreased after co-transfection with five miRNAmimics relative to that after transfection with NC mimics; Expression of exhaustion markers (F) PD-1, (G) CTLA-4, (H) Tim3, and (I) LAG3 increased after co-transfection with five miRNAmimics relative to that after transfection with NC mimics; (J) Potential mechanism of T cell exhaustion by MVs. NC: negative control; 5 mimic: co-transfection of the five miRNAmimics. Representative histograms of 3 separate experiments. Paired t test was used to compare two groups. Values represent the means ± SD, *P < 0.05, **P < 0.01.
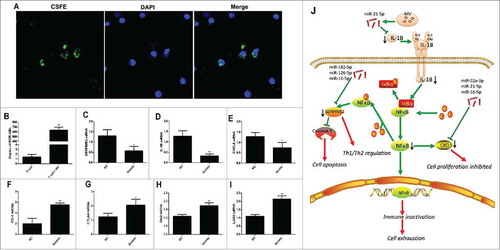
We speculate MV might participate in T cell exhaustion and checkpoints via NF-κB pathway regulation (). NF-κB is one of the most important functional associated pathways but also regulates the expression of PD-1Citation19 and is crucial for regulation of T-cell immune checkpoint inhibitors in cancer.Citation20 IL-1β is an upstream activator of NF-κB.Citation21 High levels of miR-21-5p from MVs can down-regulate IL-1β to reduce NF-κB activity from the upstream signal. CXCL5 is a downstream effector of NF-κB, which could accelerate cell proliferation and migration.Citation18 We consider that miR-92 a-3p, miR-21-5p and miR-16-5p reduce the level of CXCL5 after MV incubation. SerpinB2, serves as a negative feedback mechanism to avoid active-induced apoptosis and dysfunction,Citation22 was also down-regulate and might contribute to the T cell exhaustion.
Discussion
New modalities of T cell immunotherapy that are used as one of the best treatment practices for both ALL and AML are remarkably diverse.Citation23 T cell exhaustion has emerged as an important topic in this area, which is relevant not only for T cell biology but also for clinical applications of T cell therapy because the presence of exhausted T cells is correlated with poor patient prognosis in several types of cancers and chronic infections.Citation24 The results from current clinical trials with anti-PD-1 and anti-PD-L1 antibodies have demonstrated encouraging response rates of 20–50% continuing after treatment with acceptable transient low-grade immune-related adverse effects.Citation25,Citation26 To revive the function of exhausted T cells, it is important to identify the factors responsible for this phenomenon. In this study, we have demonstrated that MVs derived from leukemia cells can act as important inhibitory signals to induce T cell exhaustion and repress T cell functions. In mice model, MVs induced persistent immune response could causes spleen enlargement and elevated level of checkpoint inhibitors. Although cancer-derived MVs have been reported to be immunosuppressive, few studies have highlighted the connection between T cell exhaustion and MVs. These results provide novel insights into the mechanism underlying T cell exhaustion. More importantly, MVs inhibit not only native T cells but also adoptive T cells, such as CAR-T cells. Likewise, because of their excellent detectability, MVs may be used as effective indicators and targets of T cell exhaustion in vivo.
Currently, immune checkpoint inhibitors such as PD-1, CTLA-4 and Tim3 are considered the hallmarks of T cell exhaustion; however, the associated molecular mechanisms remain unclear. TFs such as NFAT family members, T-bet and EOMES are considered to play a pivotal role in T cell exhaustion.Citation27 Pauken et al. have demonstrated that exhausted T cells exhibit an epigenetic profile that is distinct from that of effector and memory T cells, and this profile can be minimally remodeled following PD-L1 blockade.Citation9 This suggests that epigenetic modifications play a pivotal role in T cell exhaustion and that inflexibility in the epigenetic fate might contribute to the exhaustion phenotype. Using whole-genome bisulfite sequencing, a recent publication established de novo DNA methylation programming as a regulator of T cell exhaustion and barrier to T cell rejuvenation.Citation28 Some other researchers have speculated that decreased levels of diacetylated histone H3 are associated with CD8+ T cell exhaustion.Citation29 However, the connection between extracellular signals and internal epigenetic modifications require further exploration. Recognized as novel epigenetic factors, MVs can transport proteins and nucleic acids, which participate in DNA methylation, histone modification, and post transcriptional regulation of RNA, between cells and can thus reflect the donor cell status.Citation30 In this study, we identified MVs as special epigenetic regulators of T cell exhaustion and highlighted the potential of translating this knowledge into innovative approaches for diagnostics and personalized therapy.
The next task was to elucidate the mechanism underlying the MV-induced epigenetic modification of T cells. MVs could merge with and deliver their cargo into T cells in vitro. In addition, continuous MV injection into mice induces and maintains the immune checkpoint inhibitors on T cells. This effect could be reversed by the withdrawal of MV injection. MVs are known to transport miRNAs, and the role of miRNAs in the pathogenesis of immune-associated diseases has been previously discussed.Citation15,Citation31 The connection between miRNAs and T cell exhaustion has been reported in the past three years. Zhang et al. found that miR-4717 could bind to the 3’untranslated region (3’UTR) of PD-1 mRNA to affect PD-1 expression and change the immune status of cells.Citation32 In non-small cell lung cancer, P53 was found to regulate PD-L1 via miR-34, which directly binds to the 3’UTR of PD-L1.Citation33 Li et al. identified miR-28 as being beneficial for the inhibition of T cell exhaustion.Citation34 Our results indicated that functional miRNAs in MVs, such as miR-92 a-3p, miR-21-5p, miR-16-5p, miR-126 and miR-182-5p, can be exogenously delivered into T cells to induce the exhaustion phenotype. This is the first study to elucidate the relationship between exogenous miRNAs in MVs and T cell exhaustion. These miRNAs can thus be used as novel markers of T cell dysfunction and provide potential targets for new therapeutic approaches to reverse these dysfunctions.
One aspect that merits further consideration is the change of regulatory networks in T cells after the delivery of exogenous miRNAs. We explored the potential molecules and associated mechanisms in the transformation of T cells by sequencing and bioinformatics analyses, especially regarding the miRNAs mentioned above, which can result in T cell activation and exhaustion.Citation19,Citation35 According to our bioinformatics analyses, the NF-κB pathway, which is a key regulator involved in T cell activation and exhaustion,Citation19,Citation35 was the most significantly regulated pathway during the process of exhaustion. Activation of the transcription factor NF-κB is critical for cytokine production and T cell survival after T cell receptor engagement. However, persistent NF-κB signaling is sufficient to impair both T cell function and survival.Citation17 As mentioned above, epigenetic modification of the NF-κB pathway is the major change observed after PD-1 blockage.Citation9 Our results further indicated that SerpinB2, IL-1β and CXCL5 are downstream targets of the MV-associated miRNAs and they are pivotal in NF-κB pathway. IL-1β is known as a classical activator of the NF-κB pathway, which suggests that the downregulation IL-1β by miR-21 might participate in the inactivation and consequent exhaustion of T cells.Citation21 SerpinB2 is widely known as an inhibitor of extracellular urokinase plasminogen activator. Recent studies have implicated SerpinB2 in the regulation of Th1 and Th2 immune responses.Citation36 In addition, SerpinB2 deficiency is known to impair its ability to protect T cells from NF-κB-induced cell death and dysfunction.Citation22 CXCL5 is a downstream product of NF-κB and the most prominently expressed CXCR2 ligand, and its downstream pathway helps to establish an immunosuppressive microenvironment in cancers.Citation18 During the process of T cell exhaustion, the level of CXCL5 increased at first and then decreased, consistent with the trend of NF-ĸB levels. In addition to the above factors, CD62 L, another NF-κB activator, was also downregulated during the T cell exhaustion.Citation37 Nevertheless, the exact role of all these factors in the exhaustion of T cells remains to be elucidated.
In summary, T cell exhaustion can be induced by MVs from various sources. The mechanism underlying the process was the progressive temporal delivery of multiple exogenous miRNAs by MVs into T cells and the subsequent interaction of the miRNAs with their targets. MV could induce PD-1 expression on T cells, as well as inhibition of NF-κB pathways. Therefore, MVs can not only be expected to become new indicators of the T cell status in patients but also be used as novel targets for personalized patient treatment. As our understanding of the mechanisms underlying tumor-induced T cell dysfunctions improves based on preclinical and clinical studies, novel discoveries can be made to improve the clinical outcomes of patients with advanced cancers.
Materials and methods
Cell culture
The human chronic myeloid leukemia cell line K562, acute myeloid leukemia cell line KG1 a, and acute lymphoblastic leukemia cell line Jurkat were obtained from China Center for Type Culture Collection (CCTCC, Wuhan, China). The cells were cultured in RPMI 1640 containing 10% fetal bovine serum (FBS), 100U/ml penicillin, 100μg/ml streptomycin at 37°C in 5% CO2.
Following the principle of informed consent, primary CD3+ T and CD8+ T cells were isolated from peripheral blood mononuclear cells (PBMCs) mobilization of healthy donors by positive selection using CD3 and CD8 microbeads (Miltenyi Biotech, San Diego, CA) according to the manufacturer's instructions. The protocal of obtaining mobilized donor peripheral was approved by Institutional Review Board of Tongji medical college and the Hubei committee and donors have the right of informed consent. The isolated CD3+ T and CD8+ T cells were cultured in RPMI 1640 containing 15% FBS, 100 U/ml penicillin, 100μg/ml streptomycin at 37°C in 5% CO2.
MV isolation
Density gradient centrifugation was used to isolate MVs. K562 cells were centrifuged for 10 min at 1000 g to harvest supernatants. The supernatant was centrifuged for 20 min at 5000 g to remove cellular debris and filtered using a Millipore Steriflippolyvinyllidene difluoride filter with a pore size of 1.2 μm. Then, the remaining supernatant was centrifuged for 60 min at 13,000 g to pellet the MVs. The characteristics of MVs have been confirmed in our previous study.Citation13
Animal experiments
All animal experiments strictly followed the animal regulations of Hubei Province, which was considered ethically acceptable. Seven-week-old BALB/c mice were purchased from Huafukang Co. Ltd. (Beijing, China). K562 cells and MVs derived from K562, Jurkat, or KG1 a cells were injected into the tail vein of mice every day for 7–20 days (MVs were quantified according to their total RNA content). The control group was intravenously injected with phosphate-buffered saline (PBS). Another group was intraperitoneally administered K562-MVs. The body weight of mice was monitored every day. Approximately 100 μl peripheral blood was obtained from the internal canthus vein of each mouse on days 1, 3, 5, 7, 10, and 20 post-injection and analyzed by flow cytometry. Mice were sacrificed on day 7 or day 20 post-injection or 15 days after stopping injection. Spleens were analyzed using real-time PCR and immunohistchemistry. The protocol was approved by the Institutional Animal Care and Use Committee of Tongji medical college, Huazhong University of Science and Techonology.
Flow cytometric analyses
All flow cytometric analyses were performed on a FACS LSR Fortessa system (BD Biosciences, USA). Anti-human antibodies (CD3-FITC, CD3-APC, CD4-FITC, CD8-PE, PD-1-APC, TIM3-PE, IL-2-PE, and IL-10-APC) were purchased from BD Pharmingen, anti-human CD69-PerCP and anti-mouse antibodies (CD3-APC, CD4-FITC, CD8-APC-Cy7, PD-1-PerCP-Cy5.5, and TIM3-PE) were purchased from Biolegend. For intracellular cytokine staining, cells were incubated in complete RPMI 1640 medium with 50 ng/ml PMA (phorbol12-myristate13-acetate)(Abcam, UK), 10μg/mlionomycin (Abcam, UK)and 4 µl/6 ml protein transport inhibitor (BD Pharmingen) for 4 hours. Intracellular staining was performed using the BD Cytofix/Cytoperm Kit according to the manufacturer's instructions. The data were analyzed with FlowJo software (TreeStar).
T cells were harvested after being washed three times with ice-cold PBS. Subsequently, the cells were labeled with Annexin V and propidium iodide according to the manufacturer's protocol (BD ApoAlertAnnexin V-FITC Apoptosis Kit; BD). The BD™ Cytometric Bead Array (CBA) Human Th1/Th2/Th17 Cytokine Kit was used to detect the levels of cytokines IL-2, IL-4, IL-6,IL-10,TNF, IFN-r, andIL-17 A according to the manufacturer's instructions.
Quantitative real-time RT-PCR
Total RNA was extracted with TRIzol (Takara) to synthesize cDNA using the PrimeScript™ RT Reagent Kit (Takara). RT-PCR was performed on a Fast 7500 Real-Time PCR system or StepOnePlus Real-Time PCR (Applied Biosystems, Foster, CA). The final reaction volume (10 µl) included 5 µl SYBR Premix Ex Taq II (Takara), 0.2 µl ROX Reference Dye, 0.4 μl forward primers,0.4 μl reverse primers), 1 μl cDNA and 3 μl RNase-free H2O. Relative expression was analyzed using the ΔΔCt method. The primer sequences used for RT-PCR are listed in supplementary materials.
Transfection of miRNAmimics
Approximately 1–2 × 10⁶ cells were seeded in six-well plates with complete RPMI 1640 medium. miRNAmimics or negative control (NC)(RiboBio, Guangzhou, China) and RiboFECT CP reagent (RiboBio)were mixed according to the manufacturer's instruction and added to cell suspensions. The final concentration of mimics was 50 nM. Cells were harvested after 48–72 h to extract total RNA for RT-PCR.
Incubation of T cell exhaustion in vitro
The isolated CD3+ T cells were seeded in six-well plates, and resuspended MVs were added into the wells twice every day for 7–10 days. The cells were harvested after three days and seven days. The quantities of MVs were normalized according to the quantities of total RNA, and 400 ng MVs were added to T cells at each time.
Confocal microscopy
Isolated MVs were suspended in 1 × PBS, and carboxyfluoresceinsuccinimidyl ester (CFSE; 2 mM stock solution) was added to the cell suspension at a final concentration of 5μM. The mixture was gently vortexed and allowed to sit for 20 min at 37°C in the dark. An equal volume of pre-warmed FBS (100%, filtered) was added to stop labeling. The labeled MVs were co-cultured with CD3+ T cells for 24 hours. The cells were stained with DAPI after fixation and permeabilization.
Bioinformatics analysis of transcriptomes
Libraries for RNA-seq were prepared according to the BGISEQ-500 RNA-seq (quantification) library preparation protocol. The RNA-seq protocols were based on the experimental flow suggested by BGI (ShenZhen, China). The raw reads were filtered as follows: 1) removal of reads with adaptors; 2) removal of reads with >10% unknown bases; and 3) removal of low-quality reads (>50% base with quality ≤ 5). The clean reads were aligned to reference genes and a reference genome with Bowtie2 and HISAT, respectively.Citation38,Citation39 The alignment data were used to calculate the distribution of reads on reference genes and mapping ratios. The RSEM tool was used for transcript quantification, and the fragments per kilobase million (FPKM) method was used to calculate the expression level.Citation40 Genes with FPKM <10 in any sample were identified for differential expression analysis. Differentially expressed genes (DEGs) were screened with the NOISeq package according to |fold change| >1.5 and diverge probability >0.75 between two groups.Citation41
Transcription factors (TFs) were identified by mapping DEGs to the TF list from the Animal TFDB 2.0 database.Citation42 The miRNA list was compiled based on highly expressed miRNAs with transcripts per million (TPM)>100 in MVs. TF and miRNA target prediction and the construction of TF-miRNA regulatory networks were described in our previous work.Citation43 All graphs were plotted using R, ggplot2 package, Cytoscape software (version 3.4.0).Citation44,Citation45 Gene Ontology (GO) and Kyoto Encyclopedia of Genes and Genomes (KEGG) pathway enrichment analyses were performed using Database for Annotation, Visualization and Integrated Discovery (DAVID)(https://david.ncifcrf.gov/).Citation46
Statistical analysis
The data are presented as the means± standard deviation (SD). In each experiment, all determinations were performed at least in triplicate. SPSS 10.0 was used for statistical analyses. Unpaired t test was used to compare different groups in animal experiments and paired t test was used to compare different time points and different groups in cells experiments. A value of P < 0.05 was considered significant.
Disclosure of potential conflicts of interest
No potential conflicts of interest were disclosed.
supp_data.zip
Download Zip (20.4 MB)Additional information
Funding
References
- Brown PA, Shah B, Fathi A, Wieduwilt M, Advani A, Aoun P, Barta SK, Boyer MW, Bryan T, Burke PW, et al. NCCN guidelines insights: Acute lymphoblastic leukemia, version 1.2017. J Natl Comprehensive Cancer Network: JNCCN. 2017;15:1091–102. doi:10.6004/jnccn.2017.0147.
- Fan M, Li M, Gao L, Geng S, Wang J, Wang Y, Yan Z, Yu L. Chimeric antigen receptors for adoptive T cell therapy in acute myeloid leukemia. J Hematol Oncol. 2017;10:151. doi:10.1186/s13045-017-0519-7.
- Lai Y, Weng J, Wei X, Qin L, Lai P, Zhao R, Jiang Z, Li B, Lin S, Wang S, et al. Toll-like receptor 2 costimulation potentiates the antitumor efficacy of CAR T cells. Leukemia. 2018;32:801–806. doi: 10.1038/ leu.2017.249.
- Zhu L, Kong Y, Zhang J, Claxton DF, Ehmann WC, Rybka WB, Palmisiano ND, Wang M, Jia B, Bayerl M, et al. Blimp-1 impairs T cell function via upregulation of TIGIT and PD-1 in patients with acute myeloid leukemia. J Hematol Oncol. 2017;10:124. doi:10.1186/s13045-017-0486-z.
- Ni X, Song Q, Cassady K, Deng R, Jin H, Zhang M, Dong H, Forman S, Martin PJ, Chen YZ, et al. PD-L1 interacts with CD80 to regulate graft-versus-leukemia activity of donor CD8+ T cells. J Clin Invest. 2017;127:1960–77. doi:10.1172/JCI91138.
- Tsai HF, Hsu PN. Cancer immunotherapy by targeting immune checkpoints: mechanism of T cell dysfunction in cancer immunity and new therapeutic targets. J Biomed Sci. 2017;24:35. doi:10.1186/s12929-017-0341-0.
- Bachireddy P, Hainz U, Rooney M, Pozdnyakova O, Aldridge J, Zhang W, Liao X, Hodi FS, O'Connell K, Haining WN, et al. Reversal of in situ T-cell exhaustion during effective human antileukemia responses to donor lymphocyte infusion. Blood. 2014;123:1412–21. doi:10.1182/blood-2013-08-523001.
- Westin JR, Chu F, Zhang M, Fayad LE, Kwak LW, Fowler N, Romaguera J, Hagemeister F, Fanale M, Samaniego F, et al. Safety and activity of PD1 blockade by pidilizumab in combination with rituximab in patients with relapsed follicular lymphoma: a single group, open-label, phase 2 trial. Lancet Oncol. 2014;15:69–77. doi:10.1016/S1470-2045(13)70551-5.
- Pauken KE, Sammons MA, Odorizzi PM, Manne S, Godec J, Khan O, Drake AM, Chen Z, Sen DR, Kurachi M, et al. Epigenetic stability of exhausted T cells limits durability of reinvigoration by PD-1 blockade. Science (New York, NY). 2016;354:1160–5. doi:10.1126/science.aaf2807.
- Sen DR, Kaminski J, Barnitz RA, Kurachi M, Gerdemann U, Yates KB, Tsao HW, Godec J, LaFleur MW, Brown FD, et al. The epigenetic landscape of T cell exhaustion. Science (New York, NY). 2016;354:1165–9. doi:10.1126/science.aae0491.
- Hisada Y, Mackman N. Cancer-associated pathways and biomarkers of venous thrombosis. Blood. 2017;130:1499–1506. doi:10.1182/blood-2017-03-743211.
- Menck K, Bleckmann A, Wachter A, Hennies B, Ries L, Schulz M, Balkenhol M, Pukrop T, Schatlo B, Rost U, et al. Characterisation of tumour-derived microvesicles in cancer patients' blood and correlation with clinical outcome. J Extracellular Vesicles. 2017;6:1340745. doi:10.1080/20013078.2017.1340745.
- Zhu X, You Y, Li Q, Zeng C, Fu F, Guo A, Zhang H, Zou P, Zhong Z, Wang H, et al. BCR-ABL1-positive microvesicles transform normal hematopoietic transplants through genomic instability: implications for donor cell leukemia. Leukemia. 2014;28:1666–75. doi:10.1038/leu.2014.51.
- Berchem G, Noman MZ, Bosseler M, Paggetti J, Baconnais S, Le Cam E, Nanbakhsh A, Moussay E, Mami-Chouaib F, Janji B, et al. Hypoxic tumor-derived microvesicles negatively regulate NK cell function by a mechanism involving TGF-beta and miR23 a transfer. Oncoimmunology. 2016;5:e1062968. doi:10.1080/2162402X.2015.1062968.
- Zhang HM, Li Q, Zhu X, Liu W, Hu H, Liu T, Cheng F, You Y, Zhong Z, Zou P, et al. miR-146b-5p within BCR-ABL1-positive microvesicles promotes leukemic transformation of hematopoietic cells. Cancer Res. 2016;76:2901–11. doi:10.1158/0008-5472.CAN-15-2120.
- Jin HT, Anderson AC, Tan WG, West EE, Ha SJ, Araki K, Freeman GJ, Kuchroo VK, Ahmed R. Cooperation of Tim-3 and PD-1 in CD8 T-cell exhaustion during chronic viral infection. Proc Natl Acad Sci U S A. 2010;107:14733–8. doi:10.1073/pnas.1009731107.
- Krishna S, Xie D, Gorentla B, Shin J, Gao J, Zhong XP. Chronic activation of the kinase IKKbeta impairs T cell function and survival. J Immunol (Baltimore, Md: 1950). 2012;189:1209–19. doi:10.4049/jimmunol.1102429.
- Terao M, Fratelli M, Kurosaki M, Zanetti A, Guarnaccia V, Paroni G, Tsykin A, Lupi M, Gianni M, Goodall GJ, et al. Induction of miR-21 by retinoic acid in estrogen receptor-positive breast carcinoma cells: biological correlates and molecular targets. J Biol Chem. 2011;286:4027–42. doi:10.1074/jbc.M110.184994.
- Bally AP, Lu P, Tang Y, Austin JW, Scharer CD, Ahmed R, Boss JM. NF-kappaB regulates PD-1 expression in macrophages. J Immunol (Baltimore, Md: 1950). 2015;194:4545–54. doi:10.4049/jimmunol.1402550.
- Chen J, Jiang CC, Jin L, Zhang XD. Regulation of PD-L1: a novel role of pro-survival signalling in cancer. Annals Oncol Official J Eur Soc Medical Oncol. 2016;27:409–16. doi:10.1093/annonc/mdv615.
- Zhang C, Wang W, Liu C, Lu J, Sun K. Role of NF-kappaB/GATA3 in the inhibition of lysyl oxidase by IL-1beta in human amnion fibroblasts. Immunol Cell Biol. 2017;95:943–52. doi:10.1038/icb.2017.73.
- Delhase M, Kim SY, Lee H, Naiki-Ito A, Chen Y, Ahn ER, Murata K, Kim SJ, Lautsch N, Kobayashi KS, et al. TANK-binding kinase 1 (TBK1) controls cell survival through PAI-2/serpinB2 and transglutaminase 2. Proc Natl Acad Sci U S A. 2012;109:E177–86. doi:10.1073/pnas.1119296109.
- Abramowski-Mock U, Delhove JM, Qasim W. Gene modified T cell therapies for hematological malignancies. Hematol /Oncol Clin N Am. 2017;31:913–26. doi:10.1016/j.hoc.2017.06.005.
- Ozkazanc D, Yoyen-Ermis D, Tavukcuoglu E, Buyukasik Y, Esendagli G. Functional exhaustion of CD4+ T cells induced by co-stimulatory signals from myeloid leukaemia cells. Immunology. 2016;149:460–71. doi:10.1111/imm.12665.
- Ribas A, Dummer R, Puzanov I, VanderWalde A, Andtbacka RHI, Michielin O, Olszanski AJ, Malvehy J, Cebon J, Fernandez E, et al. Oncolytic virotherapy promotes Intratumoral T cell infiltration and improves Anti-PD-1 immunotherapy. Cell. 2017;170:1109–19.e10. doi:10.1016/j.cell.2017.08.027.
- Alsaab HO, Sau S, Alzhrani R, Tatiparti K, Bhise K, Kashaw SK, Iyer AK. PD-1 and PD-L1 checkpoint signaling inhibition for cancer immunotherapy: Mechanism, combinations, and clinical outcome. Frontiers Pharmacol. 2017;8:561. doi:10.3389/fphar.2017.00561.
- Scott-Browne JP, Lopez-Moyado IF, Trifari S, Wong V, Chavez L, Rao A, Pereira RM. Dynamic changes in chromatin accessibility occur in CD8+ T cells responding to viral infection. Immunity. 2016;45:1327–40. doi:10.1016/j.immuni.2016.10.028.
- Ghoneim HE, Fan Y, Moustaki A, Abdelsamed HA, Dash P, Dogra P, Carter R, Awad W, Neale G, Thomas PG, et al. De novo epigenetic programs inhibit PD-1 blockade-mediated T cell rejuvenation. Cell. 2017;170:142–57.e19. doi:10.1016/j.cell.2017.06.007.
- Wang R, Xu A, Zhang X, Wu J, Freywald A, Xu J, Xiang J. Novel exosome-targeted T-cell-based vaccine counteracts T-cell anergy and converts CTL exhaustion in chronic infection via CD40 L signaling through the mTORC1 pathway. Cell Mol Immunol. 2017;14:529–45. doi:10.1038/cmi.2016.23.
- Camussi G, Deregibus MC, Bruno S, Grange C, Fonsato V, Tetta C. Exosome/microvesicle-mediated epigenetic reprogramming of cells. Am J Cancer Res. 2011;1:98–110
- da Silveira JC, de Avila A, Garrett HL, Bruemmer J, Winger Q, Bouma G. Cell-secreted vesicles containing microRNAs as regulators of gamete maturation. J Endocrinol. 2018;236:R15–R27. doi:10.1530/JOE-17-0200.
- Zhang G, Li N, Li Z, Zhu Q, Li F, Yang C, Han Q, Lv Y, Zhou Z, Liu Z. microRNA-4717 differentially interacts with its polymorphic target in the PD1 3' untranslated region: A mechanism for regulating PD-1 expression and function in HBV-associated liver diseases. Oncotarget. 2015;6:18933–44
- Ghandadi M, Sahebkar A. MicroRNA-34 a and its target genes: Key factors in cancer multidrug resistance. Curr Pharmaceutical Design. 2016;22:933–9. doi:10.2174/1381612822666151209153729.
- Li Q, Johnston N, Zheng X, Wang H, Zhang X, Gao D, Min W. miR-28 modulates exhaustive differentiation of T cells through silencing programmed cell death-1 and regulating cytokine secretion. Oncotarget. 2016;7:53735–50
- Bally AP, Tang Y, Lee JT, Barwick BG, Martinez R, Evavold BD, Boss JM. Conserved region C functions to regulate PD-1 expression and subsequent CD8 T cell memory. J Immunol (Baltimore, Md: 1950) 2017;198:205–17. doi:10.4049/jimmunol.1601464.
- Zhao A, Yang Z, Sun R, Grinchuk V, Netzel-Arnett S, Anglin IE, Driesbaugh KH, Notari L, Bohl JA, Madden KB, et al. SerpinB2 is critical to Th2 immunity against enteric nematode infection. J Immunol (Baltimore, Md: 1950). 2013;190:5779–87. doi:10.4049/jimmunol.1200293.
- Sharfe N, Merico D, Karanxha A, Macdonald C, Dadi H, Ngan B, Herbrick JA, Roifman CM. The effects of RelB deficiency on lymphocyte development and function. J Autoimmunity. 2015;65:90–100. doi:10.1016/j.jaut.2015.09.001.
- Langmead B, Trapnell C, Pop M, Salzberg SL. Ultrafast and memory-efficient alignment of short DNA sequences to the human genome. Genome Biol. 2009;10:R25. doi:10.1186/gb-2009-10-3-r25.
- Kim D, Langmead B, Salzberg SL. HISAT: a fast spliced aligner with low memory requirements. Nat Methods. 2015;12:357–60. doi:10.1038/nmeth.3317.
- Li B, Dewey CN. RSEM: accurate transcript quantification from RNA-Seq data with or without a reference genome. BMC Bioinformatics. 2011;12:323. doi:10.1186/1471-2105-12-323.
- Tarazona S, Furio-Tari P, Turra D, Pietro AD, Nueda MJ, Ferrer A, Conesa A. Data quality aware analysis of differential expression in RNA-seq with NOISeq R/Bioc package. Nucleic Acids Res. 2015;43:e140
- Zhang HM, Liu T, Liu CJ, Song S, Zhang X, Liu W, Jia H, Xue Y, Guo AY. AnimalTFDB 2.0: a resource for expression, prediction and functional study of animal transcription factors. Nucleic Acids Res. 2015;43:D76–81. doi:10.1093/nar/gku887.
- Zhang HM, Kuang S, Xiong X, Gao T, Liu C, Guo AY. Transcription factor and microRNA co-regulatory loops: important regulatory motifs in biological processes and diseases. Briefings Bioinformatics. 2015;16:45–58. doi:10.1093/bib/bbt085.
- Kohl M, Wiese S, Warscheid B. Cytoscape: software for visualization and analysis of biological networks. Methods Mol Biol (Clifton, NJ). 2011;696:291–303. doi:10.1007/978-1-60761-987-1_18.
- Ito K, Murphy D. Application of ggplot2 to Pharmacometric Graphics. CPT: Pharmacometrics Sys Pharmacol. 2013;2:e79
- Dennis G, Jr., Sherman BT, Hosack DA, Yang J, Gao W, Lane HC, Lempicki RA. DAVID: Database for annotation, visualization, and integrated discovery. Genome Biol. 2003;4:P3. doi:10.1186/gb-2003-4-5-p3.